Abstract
It has previously been shown that the HERMES method (‘Hadamard Encoding and Reconstruction of MEGA-Edited Spectroscopy’) can be used to simultaneously edit pairs of metabolites (such as N-acetyl-aspartate (NAA) and N-acetyl aspartyl glutamate (NAAG), or glutathione and GABA). In this study, HERMES is extended for the simultaneous editing of three overlapping signals, and illustrated for the example of NAA, NAAG and Aspartate (Asp). Density-matrix simulations were performed in order to optimize the HERMES sequence. The method was tested in NAA and Asp phantoms, and applied to the centrum semiovale of the nine healthy control subjects that were scanned at 3T. Both simulations and phantom experiments showed similar metabolite multiplet patterns with good segregation of all three metabolites. In vivo measurements show consistent relative signal intensities and multiplet patterns with concentrations in agreement with literature values. Simulations indicate co-editing of glutathione, glutamine, and glutamate, but their signals do not significantly overlap with the detected aspartyl resonances. This study demonstrates that a four-step Hadamard-encoded editing scheme can be used to simultaneously edit three otherwise overlapping metabolites, and can measure NAA, NAAG, and Asp in vivo in the brain at 3T with minimal crosstalk.
1. Introduction
In vivo 1H MR spectroscopy (MRS) allows for the detection of endogenous molecules within the brain but suffers from a lack of spectral dispersion. This hampers reliable quantification of low-concentration metabolites, for which specialized techniques such as J-difference editing are often needed (1-3). In J-difference editing, selective manipulation of a spin-system of interest gives a difference spectrum containing only the molecules affected by the editing pulses, after subtraction of stronger overlapping signals. Since editing is used for low concentration metabolites, long acquisitions are needed in order to obtain sufficient signal-to-noise ratio (SNR), making the detection of multiple metabolites from multiple brain regions very time consuming. Recently, the concept of simultaneous editing of multiple overlapping resonances was introduced, dubbed ‘Hadamard Encoding and Reconstruction of Mega-Edited Spectroscopy’ (HERMES) (1,4). By simultaneously recording data from more than one metabolite, HERMES has the potential to substantially increase the scope of clinical and research studies while maintaining tolerable scan times.
For each metabolite undergoing J-difference editing, half of the averages must be editing-ON and half editing-OFF. Thus, the editing scheme for a single metabolite 1 typically interleaves (ON1, OFF1, ON1, OFF1…), and the difference of the ONs and OFFs give the metabolite-1 spectrum. In order to perform a second, independent editing experiment at the same time, the editing scheme for the second metabolite must be orthogonal to this, for example (ON2, ON2, OFF2, OFF2), and the difference between the ONs and OFFs gives the metabolite-2 spectrum. The Hadamard-derived orthogonality of the two editing schemes ensures that no metabolite-1 signal contributes to the metabolite-2 spectrum and vice versa. This two-metabolite HERMES was demonstrated for simultaneously editing N-acetyl aspartate (NAA, a marker for neuronal mitochondrial viability (1)) and N-acetyl aspartyl glutamate (NAAG, a modulator of glutamatergic neurotransmission (1)). This method can be extended to edit a third target spin system simultaneously, by choosing an editing scheme that is orthogonal to the first two, such as (ON3, OFF3, OFF3, ON3).
As shown in Figure 1, NAA, NAAG and free aspartate (Asp) share the same aspartyl moiety, making it difficult to distinguish between their spectra using conventional localized spectroscopy. However, the α -aspartyl protons of each molecule have substantially different chemical shifts (NAA 4.38 ppm; NAAG 4.61 ppm; Asp 3.89 ppm), so that selective editing pulses can be applied to each of these separately, while their overlapping coupled β -aspartyl resonances are observed at ∼2.6 ppm. Thus, it should be possible to simultaneously edit NAA, NAAG and Asp using the HERMES method.
Fig. 1.

Chemical structures of Asp, NAA, and NAAG including chemical shifts and coupling constants for the α- and β-aspartyl resonances and corresponding spectra. The α-protons targeted by the editing pulses are highlighted in green while the observed β-aspartyl protons are highlighted in tan.
In this paper, the HERMES sequence was optimized for the simultaneous detection of NAA, NAAG and Asp using density-matrix simulations to explore the echo-time modulation of the aspartyl spin system. Feasibility of this approach was demonstrated in phantoms and in vivo in the human brain at a magnetic field strength of 3 Tesla.
2. Methods
A four-step HERMES scheme was developed to edit NAA, NAAG, and Asp, consisting of four MEGA-PRESS sub-experiments A, B, C, and D as shown in Figure 2 with conventional amplitude-modulated slice-selective refocusing pulses (bandwidth 1200 Hz). In the first sub-acquisition A (ONNAA, ONNAAG, ONAsp), a broader editing pulse with a rectangular inversion profile was optimized to invert the Asp spins at 3.89 ppm, NAAG spins at 4.61 ppm, and NAA spins at 4.38 ppm. This 20-ms sinc-Gaussian editing pulse was applied at 4.27 ppm (bandwidth 200 Hz). The other three sub-experiments (B, C, and D) applied narrowband editing pulses selective for one of the three metabolites (NAA, NAAG, Asp): Experiment B at 4.35 ppm with a duration of 35 ms and bandwidth of 35 Hz (ONNAA, OFFNAAG, OFFAsp); Experiment C at 4.62 ppm with a duration of 45 ms and a bandwidth of 28 Hz (OFFNAA, ONNAAG, OFFAsp); and Experiment D at 3.89 ppm with a duration of 45 ms and a bandwidth of 28 Hz (OFFNAA, OFFNAAG, ONAsp). These editing pulse offsets and durations were chosen as a result of preliminary exploratory investigations aimed at minimizing editing crosstalk. Combining the sub-spectra as in the bottom table of Figure 2 leads to separate J-difference-edited spectra for NAA, NAAG, and Asp.
Fig. 2.
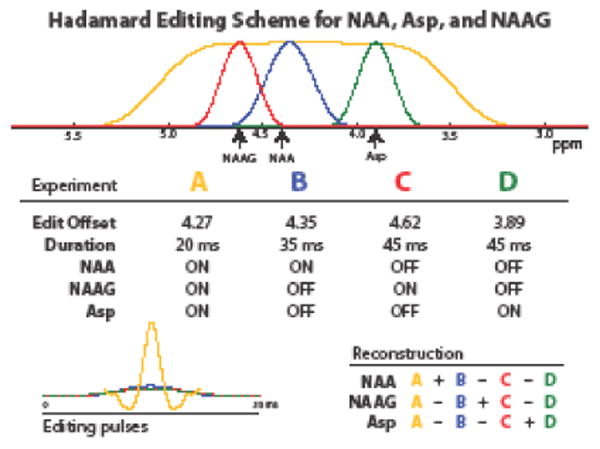
Editing pulse schematic for HERMES editing of Asp, NAA, and NAAG. In the top panel, the inversion profile of the editing pulses are plotted, and color-coded by experiment. The middle table shows the four experiments acquired with the listed editing pulse offsets and durations, while the amplitude modulation functions of the four pulses are shown overlaid in the bottom left panel. The bottom right table shows the Hadamard combinations of the different experiments that give the edited spectra of NAA, NAAG and Asp respectively.
2.1 Simulations
The optimal echo time (TE) to edit NAA and NAAG using HERMES has been previously determined (1), but the TE-dependency of Asp was not considered. Density-matrix simulations for Asp were therefore performed using the MATLAB-based ‘FID-A’ program (5). TE was varied from 70 ms to 210 ms, with the 20 ms editing pulses applied at 3.89 ppm (ON) and 10 ppm (OFF). The area of the detected Asp β-aspartyl ∼2.7 ppm peak was compared with that of NAA and NAAG (up to TE = 260 ms) with and without an estimated in vivo T2-weighting, assuming that all three metabolites share similar T1 and T2 relaxation times (6). T2 was assumed to be equal to that of the NAA singlet at 2 ppm (0.277 s).
Non-ideal editing (here termed ‘crosstalk’), i.e. the presence of unwanted aspartyl signals in the different Hadamard reconstructions, was quantified (between 2.3 ppm and 3.0 ppm) as the root-mean squared of the unwanted signal expressed as a percentage of the root-mean squared of the intended reconstructed spectrum for the same molecule. In addition, other potentially co-edited metabolites, i.e. those with spins coupled to spins with chemical shifts that occur within the bandwidth of the editing pulses (taurine, tyrosine, the glutamate and cysteine moieties of glutathione (GSH), glutamate, and glutamine), were also simulated with the same HERMES scheme. Chemical shifts and coupling constants were taken from reference 7 and simulated spectra were evaluated both with equimolar concentrations and in vivo concentrations taken from the same reference.
2.2 Phantom Experiments
All experiments were performed on a Philips Achieva 3T scanner using a body coil (maximum B1 = 13.5 μT) for transmitting RF pulses and a 32-channel head coil for receive.
MEGA-PRESS measurements were made in a 25 mM Asp phantom and in a 10 mM NAA phantom. Scan parameters were: (3 cm)3 voxel size; CHESS water suppression; TR = 2 s; and 64 averages. TE was varied from 70 ms to 210 ms, with the 20 ms sinc-Gaussian editing pulses applied at 3.89 ppm (ON) and 10 ppm (OFF) for Asp; for NAA, the editing pulses were applied at 4.38 ppm (ON) and 10 ppm (OFF).
HERMES experiments were also performed in the same phantoms. All three Hadamard combination spectra were reconstructed for each metabolite to quantify crosstalk. Note that experiments were not performed in an NAAG phantom - none was available due to the high cost of NAAG.
2.3 In Vivo Experiments
HERMES NAA/NAAG/Asp experiments were performed in 9 healthy adults (5 female; age 29 ± 5 years) in a 5×3×3 cm3 voxel in the right centrum semiovale. Scan parameters were the same as for the phantom experiments, except that VAPOR water suppression (8) was used and 384 transients acquired. Based on the simulations and phantom experiments, a TE of 150 ms was used for the in vivo scans. Prospective frequency correction for B0 field drift was performed based on interleaved water-unsuppressed references (9), which were also acquired for metabolite quantification.
The ‘Gannet’ program (10) was used to frequency- and phase-correct individual transients using the signal from the N-acetyl peak (11). Hadamard reconstruction of the sub-acquisitions was then performed according to the bottom panel of Figure 2 to give separate NAA, NAAG, and Asp spectra.
A non-linear least-squares fitting algorithm (using nlinfit in MATLAB) was implemented to model the in vivo NAA, NAAG, and Asp spectra. For NAA fitting, the model included the simulated NAA lineshape and a linear baseline, with three fitted parameters: NAA amplitude, slope and offset. For NAAG fitting, the model included the simulated NAAG lineshape, a Gaussian to model GSH and a linear baseline, with six fitted parameters: NAAG amplitude, GSH amplitude, offset and width, and baseline slope and offset. For Asp fitting, the model included the simulated Asp lineshape, as well as the NAA and NAAG cross-term lineshapes (with fixed relative amplitudes set by the outcomes of NAA and NAAG modeling), and a linear baseline, i.e. four fitted parameters: Asp amplitude, the crossterm amplitude, and baseline slope and offset.
Scaling factors from the fitting routine indicate the relative concentrations of NAA, NAAG and Asp. The total [NAA+NAAG] concentration can be estimated from the 2 ppm methyl signal and internal water reference, using a Lorentzian model for the N-acetyl (NA) methyl signal and Lorentzian-Gaussian model for water, as implemented in Gannet (10). Relaxation correction was performed using T1/T2 values for NA/water of: T1NA = 1.36 s; T1water = 0.832 s; T2NA = 0.277 s; T2water = 0.0792 s. MR-visible water concentration was assumed to be 35750 mM (1, 6). Based on the calculated N-acetyl concentration, concentrations of NAA, NAAG and Asp can be inferred (1, 12) assuming that the aspartyl resonances of all 3 compounds have similar T1 and T2 relaxation times.
3. Results
In both simulations and phantom experiments, Asp shows significant TE-modulation of the observed peak at 2.6 ppm from TE = 70 ms to 210 ms, reaching a maximally negative signal at 140-160 ms, whether or not T2 relaxation is taken into account, as shown in Figures 3a – 3c. Simulations and phantom experiments for Asp show good agreement for TEs up to about 170 ms, but start to diverge at longer echo times (Figure 3a). In both phantom experiments and simulations, the TE-modulation of Asp deviates significantly from that of NAA and NAAG over the same echo time range (Figure 3b). NAA and NAAG simulations show maximal positive signal at TE 130 ms to TE 170 ms with and without an assumed in vivo T2 relaxation time of 0.277 s. This is also a range in which Asp obtains a maximal negative signal, thus a TE of 150 ms was chosen for HERMES editing of Asp, NAA, and NAAG.
Fig. 3.
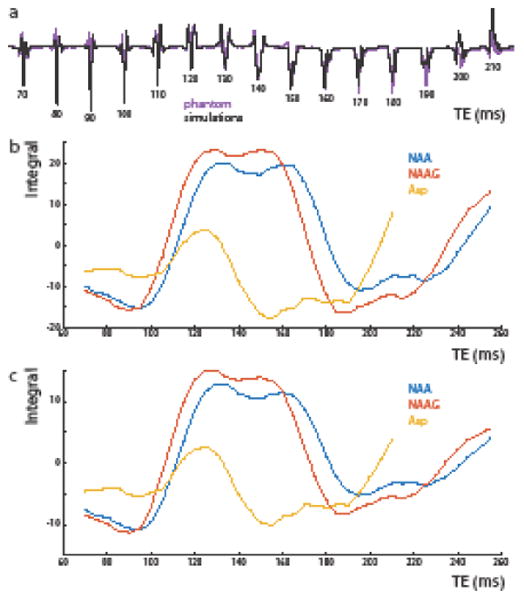
Simulations of MEGA-PRESS difference spectra of Asp, NAA, and NAAG at a range of echo times. (a) Simulations (black) and phantom (purple) MEGA-PRESS experiments of the Asp peak (∼2.7 ppm) at echo times varying from 70 to 210 ms. (b) Simulations of the peak areas of MEGA-PRESS difference spectra for Asp, NAA, and NAAG peaks at ∼2.6-2.7 ppm ppm as a function of echo time (70 to 260 ms). (c) Integrals of edited Asp, NAA, and NAAG peaks from (b) as a function of echo time with simulated T2 relaxation, assuming T2 = 277 ms for all metabolites.
Simulated HERMES NAA/NAAG/Asp sub-spectra are shown in Figure 4. NAA and NAAG show the expected positive refocused signal in the ON cases (A and B for NAA, A and C for NAAG) and the expected negative signal in the OFF cases (C and D for NAA, B and D for NAAG). For Asp, however, signals are negative in the ON cases (A and D) and positive in the OFF cases (B and C). Hadamard combinations of these subspectra are shown in Figure 5. It can be seen that reconstructed spectra for each metabolite are well segregated with little crosstalk between them (mean RMS 4.5%).
Fig. 4.
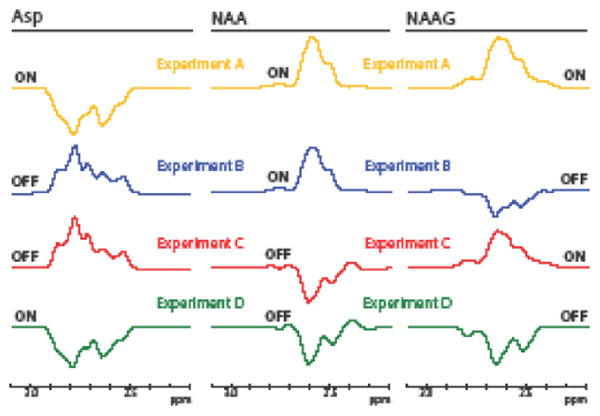
The simulated subspectra for Asp, NAA, and NAAG for each of the HERMES steps. Each row corresponds to the outcome of a single sub-experiment (A, B, C, D), as simulated for a different metabolite. The editing pulses that are used for each case are shown (with the same color coding) in Figure 2, bottom left. For NAA and NAAG, a positive refocused signal can be seen in the ONs for each metabolite and an inverted peak can be seen in the OFFs for each metabolite as expected. Relative to NAA and NAAG, the phase of the Asp peak in the ONs and OFFs is inverted, showing a negative signal in the ONs and a positive signal in the OFFs.
Fig. 5.
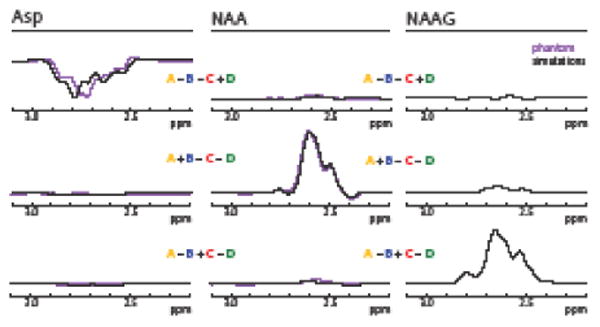
Simulations (purple) and phantom spectra (black) of Hadamard reconstructions of Asp (left), NAA (middle) and NAAG (right) for the editing scheme of Figure 2. The multiplet patterns are in good agreement between simulations and phantom experiments and all metabolites show good segregation into their intended reconstruction with little crosstalk between the Hadamard combinations.
There is good agreement between phantom data (Asp, NAA) and simulations of the HERMES reconstructions of individual metabolites, as shown in Figure 5, although the phantom multiplet patterns of NAA more closely agree with simulations than those of Asp. Phantom crosstalk values averaged to 6.3% RMS.
Figure 6a shows the Hadamard-reconstructed NAA, NAAG, and Asp spectra in all 9 subjects. The in vivo multiplet patterns and relative signal intensity of the three metabolites are consistent across all subjects. Representative fits to the data (shown in Figure 6b) demonstrate that the simulated model fits the data well for NAA, NAAG and Asp, yielding the following concentrations: NAA 8.03 ± 0.69 mM, and NAAG 2.16 ± 0.34 mM and Asp 0.88 ± 0.17 mM, in good agreement with literature values of about 7.8 mM for NAA, 1.9 mM for NAAG, and 1 – 1.4 mM for Asp. (1, 7, 13, 14).
Fig. 6.
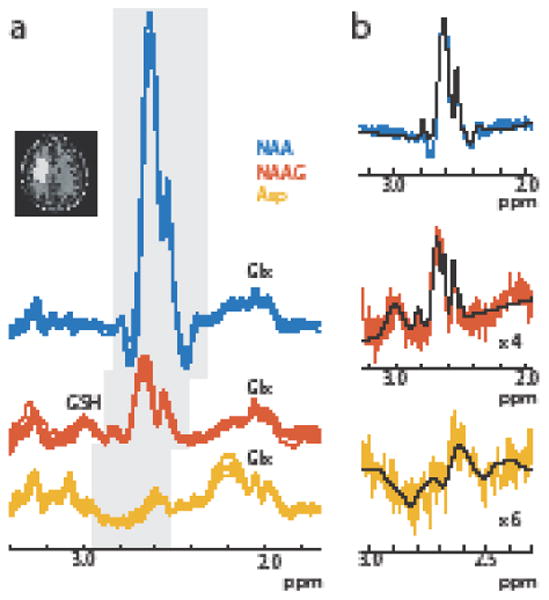
(a) Simultaneous, separable in vivo HERMES editing of NAA (blue), NAAG (orange), and Asp (yellow) in all 9 subjects. The β-aspartyl resonances are highlighted in grey. The reconstructed spectra show consistent multiplet patterns and relative signal intensities between subjects. b) Representative fits of the in vivo data in one subject for NAA, NAAG and Asp.
Simulations of co-edited metabolites are shown in Figure 7. All of the metabolites considered (except taurine) have resonances in the vicinity of the detected region of Asp, NAA, and NAAG, however actual resonance overlap is minimal (Figure 7a). When in vivo concentrations of co-edited metabolites are considered, this overlap is more significant but still relatively small (Figure 7b). Glutamate, glutamine, and the glutamate moiety of GSH (Glx) are co-edited to a greater degree in the Asp Hadamard combination than in either the NAA or NAAG reconstructed spectra. The predicted co-editing of glutamate, glutamine, and the glutamate moiety of GSH between the three Hadamard combinations agrees well with the spectra recorded in vivo (Figure 6a); the signal intensity of these peaks ∼2.1-2.2 ppm is similar in the NAA and NAAG reconstructed spectra, but is greater in the Asp reconstructed spectra. The cysteine moiety of glutathione at 2.95 ppm is larger in the NAAG Hadamard combination than in the Asp or NAA Hadamard combinations and partially overlaps with the detected region of NAAG. This glutathione peak can also be seen in vivo (Figure 6a). Thus, a Gaussian function centered on 2.95 ppm for the GSH-cysteine moiety was included in the fitting of the NAAG spectrum (Figure 6b). Tyrosine is co-edited more in the Asp combination but was not included in the fit due to its low concentration and consequently low signal contribution in the resulting Asp combination (Figure 7b).
Fig. 7.
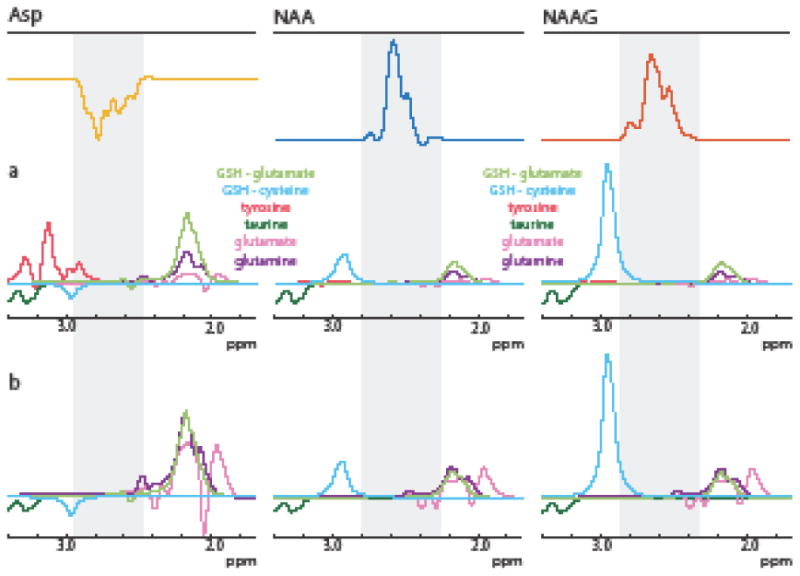
Simulations of co-edited metabolites in each Hadamard combination for the HERMES scheme given in Figure 2 (a) assuming equimolar concentrations and (b) weighted according to in vivo concentration values in literature. Grey denotes the detected β-aspartyl region of Asp, NAA, or NAAG in the reconstructed spectra. The cysteine moiety of glutathione is most predominantly edited in the NAAG spectrum and partially overlaps with the detected region of NAAG. Glutamate, glutamine, and the glutamate moiety of glutathione are co-edited to a greater degree in the Asp Hadamard combination but do not overlap significantly with the detected region.
4. Discussion
Asp is an excitatory amino acid neurotransmitter present at approximately 1 mM concentration which has been previously detected in vivo in the human brain using MR spectroscopy (7). 1H MRS studies have suggested changes in Asp in various disorders such as Alzheimer's disease, ischemia, and obsessive-compulsive disorder (16-18), but given its low concentration, and strong overlap with NAA, quantification of Asp by fitting of conventional localized spectra is challenging. Asp, NAA and NAAG form a metabolic pathway with acetylation of Asp leading to the synthesis of NAA and subsequent combination of NAA with glutamate forming NAAG. Considering its role as a neurotransmitter, and close metabolic association to the Krebs cycle and other MRS metabolites, it is perhaps surprising that measurements of Asp using MRS (either conventional, or J-difference editing) have not been more widely explored (13, 18).
In this paper, it is shown that a four-step Hadamard-encoded editing scheme is capable of simultaneously editing NAA, NAAG, and Asp with minimal crosstalk. All three metabolites share the same optimal echo time, allowing for HERMES editing with near maximal sensitivity for each. HERMES editing represents a three-fold reduction of scan time compared to sequential editing of each compound individually using MEGA-PRESS. These data also demonstrate that Asp can be edited in vivo and that the HERMES scheme, previously introduced for editing pairs of metabolites, can be extended to simultaneously edit three otherwise overlapping metabolites.
The HERMES scheme proposed has a threefold benefit over consecutive MEGA-PRESS experiments, i.e. one third the total experiment time to match SNR or √3 SNR benefit for the same total experiment time. There is an intermediate possibility – to share the OFF scans between the three MEGA-PRESS scans. Such a shared-off scan could be implemented as an interleaved four-step cycle very similar to HERMES, but with the ALL-ON scan of HERMES replaced by an ALL-OFF. Such a scan would still only use half of the acquired data for each difference spectrum, resulting in √2 lower SNR than the corresponding HERMES scan, which uses all data for each quantified metabolite.
The edited Asp signal is optimally edited in the same TE range as NAA and NAAG (at TE = 150 ms), but with opposite polarity. This unexpected result is likely due to its larger geminal β -β (J33′) coupling (-17.43 Hz, compared to the -15.92 Hz and -15.91 Hz of NAA and NAAG respectively), which is not refocused by the editing pulses. The long optimal TE value of 150 ms also has the advantage that long-duration, very selective editing pulses can be used to minimize crosstalk in the Hadamard reconstructions of all three metabolites. Although the Asp TE-modulation is in good agreement between simulations and phantom experiments up to about TE ∼160 ms, the multiplet form diverges significantly at longer TE; the reason for this is unclear, but may either be due to inaccuracies in the spin system parameters used for the simulations, or other factors such as spatially inhomogeneous coupling evolution which was not considered in the simulations (2, 19).
In this implementation of HERMES, both NAA and NAAG are edited reliably with concentrations and metabolite patterns similar to those found in reference 1 and in phantom experiments and simulations. This suggests that the implementation of the triple-aspartyl HERMES presented here does not bias the metabolite concentration measurements. It is also shown that, despite its low concentration, Asp can be quantified reliably using J-difference editing. HERMES detection of all three metabolites is aided by the high-bandwidth editing pulse in experiment A that has a more rectangular inversion profile (compared to the conventional (sinc-Gaussian editing pulses) that can fully invert the full frequency range of targeted spins (0.72 ppm) of NAA, NAAG, and Asp. The editing pulses in experiments B, C, and D are also sufficiently selective so that NAA and NAAG are well separated from other edited metabolites. Quantification of Asp with HERMES can be improved upon, however, by reducing the contamination from NAA and NAAG in the Asp Hadamard combination with a fuller optimization of the frequency offsets and durations of the applied editing pulses. It is a limitation that the quantification presented here relies on assumptions about the relaxation behavior of the different aspartyl spin systems. Indeed, HERMES experiments like this, performed with variable TR (and possibly TE) might provide a feasible route to measuring relaxation parameters in vivo.
Comparing the co-editing simulations performed here to those in reference 1, this implementation of HERMES does not significantly co-edit any additional metabolites. The cysteine moiety of glutathione remains the most significantly co-edited metabolite within the detected NAAG frequency range and was included in the fitting of the spectra. Considering the dissimilarity between the Asp multiplet pattern ∼2.6 ppm in phantom experiments and in vivo, residual NAA and NAAG were included in the final fit to the Aspartate spectrum which resulted in a good fit of the simulated model to the Asp spectrum.
In conclusion, a four-step HERMES editing scheme has been adapted to edit three metabolites simultaneously. Separable editing of NAA, NAAG, and Asp functions consistently in vivo, in terms of both the metabolites' multiplet patterns and measured concentrations. Compared to sequential MEGA-PRESS acquisitions of the same metabolites, HERMES measurements take one third of the time.
Highlights.
HERMES can simultaneously edit three metabolites.
Overlapping signals from NAA, NAAG and Asp are resolved by Hadamard editing.
Simulated metabolite multiplet patterns agree with phantom experiments.
Measured in vivo concentrations in agreement with literature values.
Acknowledgments
This work was supported by NIH R01 EB016089 and P41 EB015909.
Footnotes
Publisher's Disclaimer: This is a PDF file of an unedited manuscript that has been accepted for publication. As a service to our customers we are providing this early version of the manuscript. The manuscript will undergo copyediting, typesetting, and review of the resulting proof before it is published in its final citable form. Please note that during the production process errors may be discovered which could a ect the content, and all legal disclaimers that apply to the journal pertain.
References
- 1.Chan KL, Puts NAJ, Schär M, Barker PB, Edden RAE. HERMES: Hadamard encoding and reconstruction of MEGA-edited spectroscopy. Magn Res Med. 2016;76:11–19. doi: 10.1002/mrm.26233. [DOI] [PMC free article] [PubMed] [Google Scholar]
- 2.Chan KL, Puts NAJ, Snoussi K, Harris AD, Barker PB, Edden RAE. Echo time optimization for J-difference editing of glutathione at 3T. Magn Reson Med. 2016;504:498–504. doi: 10.1002/mrm.26122. [DOI] [PMC free article] [PubMed] [Google Scholar]
- 3.Harris AD, Saleh MG, Edden RAE. Edited 1 H magnetic resonance spectroscopy in vivo: Methods and metabolites. Magn Reson Med. 2017;77:1377–1389. doi: 10.1002/mrm.26619. [DOI] [PMC free article] [PubMed] [Google Scholar]
- 4.Saleh MG, Oeltzschner G, Chan KL, Puts NAJ, Mikkelsen M, Schär M, Harris AD, Edden RAE. Simultaneous edited MRS of GABA and glutathione. Neuroimage. 2016;142:576–582. doi: 10.1016/j.neuroimage.2016.07.056. [DOI] [PMC free article] [PubMed] [Google Scholar]
- 5.Simpson R, Devenyi GA, Jezzard P, Hennessy TJ, Near J. Advanced processing and simulation of MRS data using the FID appliance (FID-A)-An open source, MATLAB-based toolkit. Magn Reson Med. 2015;33:23–33. doi: 10.1002/mrm.26091. [DOI] [PubMed] [Google Scholar]
- 6.Harris AD, Puts NAJ, Edden RAE. Tissue correction for GABA-edited MRS: Considerations of voxel composition, tissue segmentation, and tissue relaxations. J Magn Reson Imaging. 2015;42:1431–1440. doi: 10.1002/jmri.24903. [DOI] [PMC free article] [PubMed] [Google Scholar]
- 7.Govindaraju V, Young K, Maudsley AA. Proton NMR chemical shifts and coupling constants for brain metabolites. NMR Biomed. 2000;13:129–53. doi: 10.1002/1099-1492(200005)13:3<129::aid-nbm619>3.0.co;2-v. [DOI] [PubMed] [Google Scholar]
- 8.Tkáč I, Starčuk Z, Choi IY, Gruetter R. In vivo 1H NMR spectroscopy of rat brain at 1 ms echo time. Magn Res Med. 1999;41:649–656. doi: 10.1002/(sici)1522-2594(199904)41:4<649::aid-mrm2>3.0.co;2-g. [DOI] [PubMed] [Google Scholar]
- 9.Edden RAE, Oeltzschner G, Harris AD, Puts NAJ, Chan KL, Boer VO, Schär M, Barker PB. Prospective frequency correction for macromolecule-suppressed GABA editing at 3T. J Magn Reson Imaging. 2016;44:1474–1482. doi: 10.1002/jmri.25304. [DOI] [PMC free article] [PubMed] [Google Scholar]
- 10.Edden RAE, Puts NAJ, Harris AD, Barker PB, Evans CJ. Gannet: A batch-processing tool for the quantitative analysis of gamma-aminobutyric acid-edited MR spectroscopy spectra. J Magn Reson Imaging. 2013;40:1445–1452. doi: 10.1002/jmri.24478. [DOI] [PMC free article] [PubMed] [Google Scholar]
- 11.Near J, Edden R, Evans CJ, Paquin R, Harris A, Jezzard P. Frequency and phase drift correction of magnetic resonance spectroscopy data by spectral registration in the time domain. Magn Reson Med. 2014;50:44–50. doi: 10.1002/mrm.25094. [DOI] [PMC free article] [PubMed] [Google Scholar]
- 12.Edden RAE, Pomper MG, Barker PB. In vivo differentiation of N-acetyl aspartyl glutamate from N-acetyl aspartate at 3 Tesla. Magn Reson Med. 2007;57:977–982. doi: 10.1002/mrm.21234. [DOI] [PubMed] [Google Scholar]
- 13.Murdoch JB, Wheaton AJ, Anderson R. MEGA-PRESSing onward for more metabolites: aspartate, lactate, and PE. Proceedings of the 21st Annual Meeting of ISMRM; Salt Lake City, Utah, USA. 2013. Abstract 2026. [Google Scholar]
- 14.Pouwels PJ, Frahm J. Differential distribution of NAA and NAAG in human brain as determined by quantitative localized proton MRS. NMR Biomed. 1997;10:73–8. doi: 10.1002/(sici)1099-1492(199704)10:2<73::aid-nbm448>3.0.co;2-4. [DOI] [PubMed] [Google Scholar]
- 15.Klunk WE, Xu C, Panchalingam K, McClure RJ, Pettegrew JW. Quantitative 1H and 31P MRS of PCA extracts of postmortem Alzheimer's disease brain. Neurobiol Aging. 1996;17:349–357. doi: 10.1016/0197-4580(96)00035-8. [DOI] [PubMed] [Google Scholar]
- 16.Castillo M, Kwock L, Mukherji SK. Clinical applications of proton MR spectroscopy. AJNR Am J Neuroradiol. 1996;17:1–15. [PMC free article] [PubMed] [Google Scholar]
- 17.Ljungberg M, Nilsson MKL, Melin K, Jönsson L, Carlsson A, Carlsson Å, Forssell-Aronsson E, Ivarsson T, Carlsson M, Starck G. 1H magnetic resonance spectroscopy evidence for occipital involvement in treatment-naive paediatric obsessive–compulsive disorder. Acta Neuropsychiatr. 2016:1–12. doi: 10.1017/neu.2016.52. [DOI] [PubMed] [Google Scholar]
- 18.Menshchikov PE, Akhadov A, Semenova NA. Spectra editing with MEGA-PRESS pulse sequence for direct aspartate observation. ISMRM Workshop on MR Spectroscopy. 2016 [Google Scholar]
- 19.Near J, Evans CJ, Puts NAJ, Barker PB, Edden RAE. J-difference editing of gamma-aminobutyric acid (GABA): simulated and experimental multiplet patterns. Magn Reson Med. 2013;70:1183–1191. doi: 10.1002/mrm.24572. [DOI] [PMC free article] [PubMed] [Google Scholar]


