Abstract
Triple negative breast cancer (TNBC) is a particularly important breast cancer subtype with an aggressive clinical phenotype that is associated with a higher likelihood of metastasis. This subtype is characterized by an absence of the estrogen (ER) and progesterone (PR) receptors, as well as the human epidermal growth factor receptor 2 (HER2/HER neu). The absence of the three receptors significantly reduces targeted treatment options for patients with TNBC and as such, there is an urgent need to identify novel treatment targets. Here, we provide detailed information regarding the design of a multi-platform dataset that describes genome-wide assessment of miRNA (assessed by microarray, GSE38167) and gene expression (assessed by microarray, GSE61723), as well as methylation (assessed by Illumina HM450K BeadChip, GSE78751) in TNBCs, matched normal adjacent tissues and matched lymph node metastases. The use of this multi-platform dataset is likely to uncover novel markers and key pathways involved in progression to lymph node metastasis in TNBC.
| Specifications | |
| Organism/cell line/tissue | Homo sapiens/breast cancer specimens (triple negative subtype) |
| Sex | Female |
| Sequencer or array type |
|
| Data format | Raw (.tar) and processed (.txt) |
| Experimental factors | Matched normal adjacent tissue, tumour tissue, matched lymph node metastases |
| Experimental features | This study has investigated miRNA, gene and methylation profiles in primary TNBC cases (miRNA (n = 31), gene (n = 33), methylation (n = 23)) and matched lymph node metastases (miRNA (n = 13), gene (n = 15), methylation (n = 12)) compared with matched normal breast tissues (miRNA (n = 23), gene (n = 17), methylation (n = 11, 3 pooled samples and 1 single sample)). |
| Consent | This study complies with the Helsinki Declaration with ethical approval from the Hunter New England Human Research Ethics Committee (Approval number: 09/05/20/5.02). In accordance with the National Statement on Ethical Conduct in Research Involving Humans, a waiver of consent was granted for this study. |
| Sample source location | Newcastle, NSW, Australia |
1. Direct link to deposited data
miRNA arrays (GSE38167): https://www.ncbi.nlm.nih.gov/geo/query/acc.cgi?acc=GSE38167.
Gene expression arrays (GSE61723): https://www.ncbi.nlm.nih.gov/geo/query/acc.cgi?acc=GSE61723.
Illumina HM450K BeadChip (GSE78751): https://www.ncbi.nlm.nih.gov/geo/query/acc.cgi?acc=GSE78751.
2. Experimental design, materials and methods
2.1. Study cohort
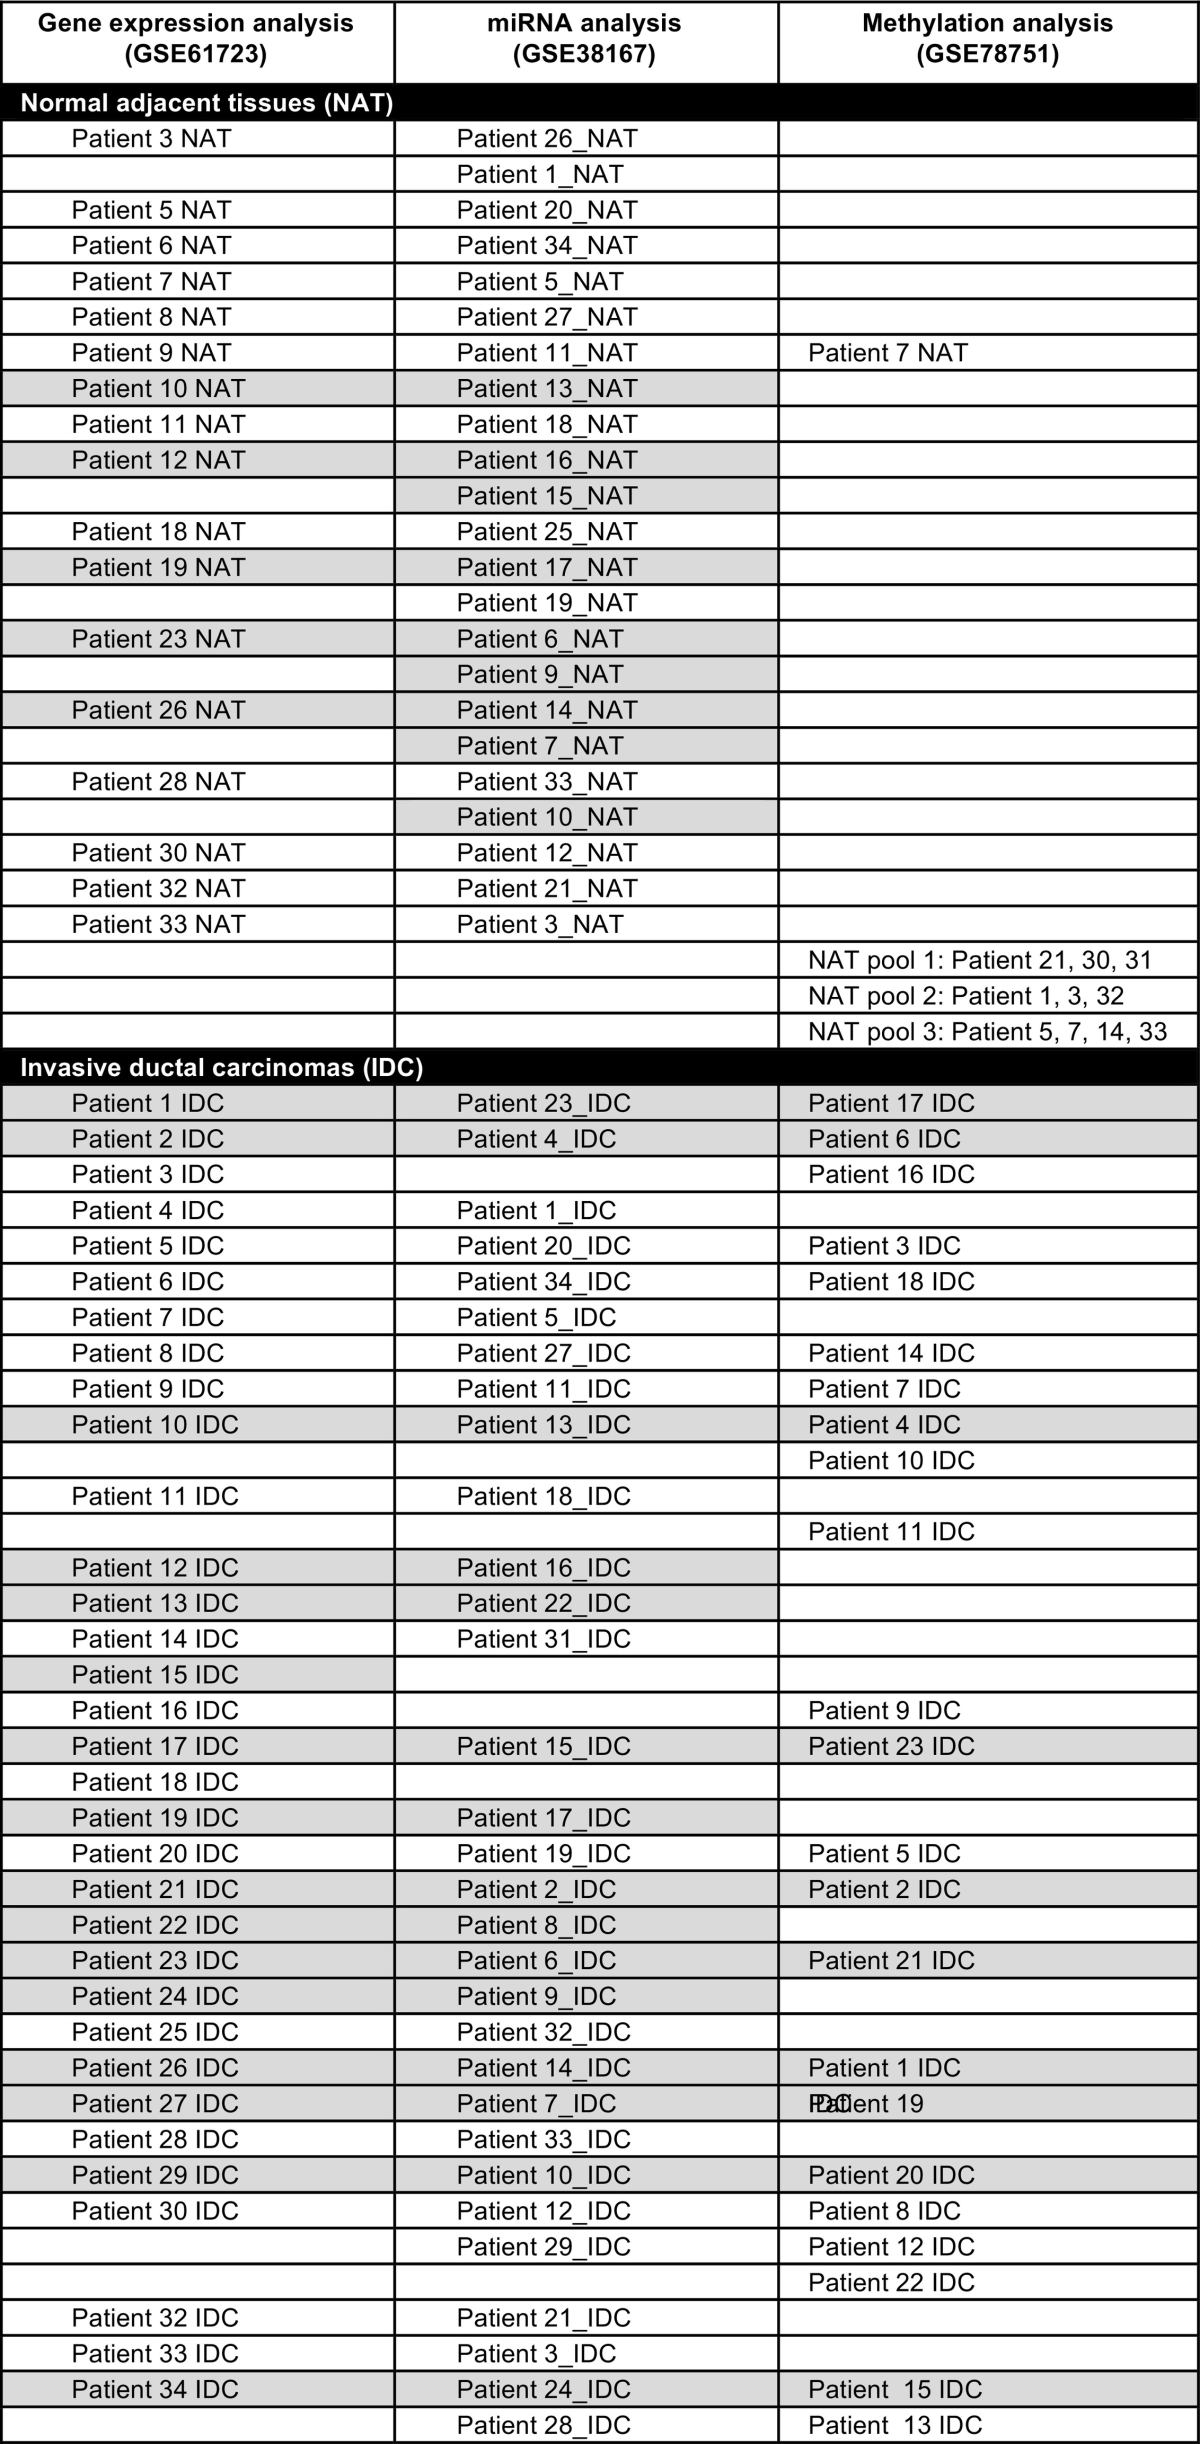
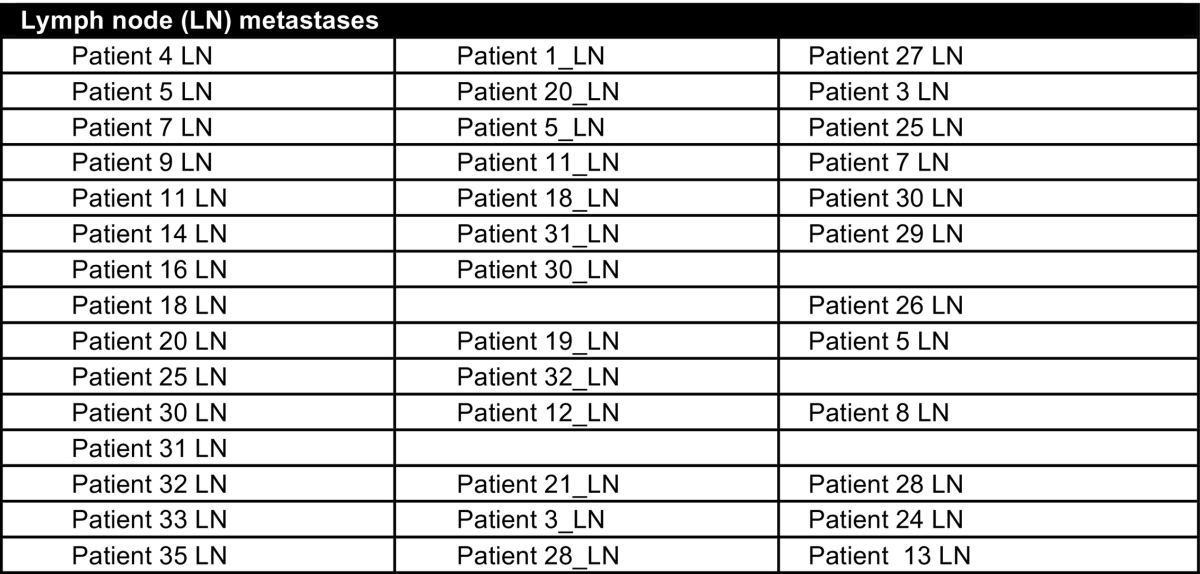
A total of 38 grade 3, triple negative, invasive ductal carcinomas (IDCs), 23 matched normal adjacent tissues (NAT), and 15 lymph node metastases (LNmet) were used for this analysis. All samples were formalin-fixed, paraffin-embedded (FFPE) and obtained from the archives of Pathology North, John Hunter Hospital, Newcastle, Australia. This cohort has been described previously [1], [2], [3]. Due to a lack of material not all samples were included in all studies and the number of samples in each of the studies is as follows: TNBC cases (miRNA (n = 31), gene (n = 33), methylation (n = 23)), matched lymph node metastases (miRNA (n = 13), gene (n = 15), methylation (n = 12)) and matched normal breast tissues (miRNA (n = 23), gene (n = 17), methylation (n = 11, 3 pooled samples and 1 single sample)). Because the analysis of miRNA, gene and methylation was performed at distinct times, the patient identifiers do not match between the individual studies described in Gene Expression Omnibus and Table 1 shows the corresponding patient identifiers between the studies so that miRNA, gene and methylation data can be linked to an individual patient.
Table 1.
Labelling of patient samples in individual studies of whole genome gene, miRNA and methylation analysis. Cases shaded in grey are lymph node negative and unshaded cases are lymph node positive.
2.2. RNA extraction
Total RNA was extracted using the miRNeasy FFPE kit (Qiagen, Doncaster, VIC, Australia). RNA was quantified using the Quant-it RiboGreen RNA Assay kit (Invitrogen, Mulgrave, VIC, Australia) and purity assessed by A260/A280 and A260/230 ratios (> 1.8) using the Nanodrop. The RNA integrity of selected samples was analysed using the 2100 Bioanalyser and the RNA 6000 Nano kit (Agilent Technologies, Mulgrave, VIC, Australia).
2.3. DNA extraction
The Gentra Puregene Tissue Kit (Qiagen, Venlo, Limburg, Netherlands) was used to isolate DNA from FFPE tissue following the manufacturers' instruction with minor modifications as previously described [2]. DNA was quantitated using the Qubit dsDNA BR Assay Kit according to the manufacturers' instructions (Life Technologies, Carlsbad, CA, United States of America).
2.4. miRNA profiling
miRNA profiling was performed as previously described [1]. Briefly, 100 ng of total RNA was dephosphorylated and labelled with Cy3 using the miRNA Complete Labelling and Hyb Kit (Agilent Technologies). Labelled RNA was hybridised to Human miRNA microarrays (Sanger Release 14.0) according to the manufacturers' instructions (Agilent Technologies) and scanned on an Agilent High-resolution C scanner. Data from 15,000 probe features representing 904 unique miRNAs was extracted using Agilent Feature Extraction software (v10.7.3.1) and converted to background subtracted signal intensities. The extracted data was imported into Genespring GX (Agilent Technologies) where it was log2 transformed and median normalised. 570 miRNA transcripts had a signal intensity threshold above background in at least one sample. Unpaired t-tests identified miRNAs with significantly altered expression (> 2-fold, p < 0.05, FDR < 5%).
2.5. Gene expression profiling
Gene expression profiling was performed as previously described [3]. Briefly, 100 ng total RNA was amplified (Ovation FFPE WTA kit) and biotinylated (Encore Biotin module) according to the manufacturers' instructions (Nugen, San Carlos, California, USA). The samples were hybridised to HuGene 2.0 arrays (Affymetrix, Santa Clara, California, USA) and 17 h later washed and stained. The HumanGene 2.0 arrays (Affymetrix) contain probe features representing 11,000 lncRNAs, 24,000 genes, and 30,000 coding transcripts. The arrays were scanned on a GeneChip Scanner 3000 7G (Affymetrix). The data was imported to Genomic Suite 6.6 (Partek, St Louis, Missouri, USA) and a robust multi-array analysis (RMA) was performed, which included log2 transformation, background correction, quantile normalisation and summarisation of the probe features resulting in a set of expression signal intensities. Unpaired t-tests identified genes that were found to be significantly different between samples (p-value < 0.05; fold change > 1.5 or <− 1.5). Correction for multiple testing was performed using Benjamini – Hochberg procedure.
2.6. DNA methylation profiling
DNA methylation profiling was performed as previously described [2]. The Infinium HD FFPE quality control (QC) Assay (Illumina, San Diega, CA, USA) was used to assess the integrity of the DNA used for the analysis according to the manufacturers' instructions. Bisulfite conversion was performed using the EZ-96 DNA Methylation Kit (Zymo Research, Irvine, CA, USA). FFPE Restoration was undertaken following the Infinium HD FFPE Restore Protocol (Illumina). The Infinium HD FFPE Methylation Assay (Illumina) with the hybridisation, washing and staining of the arrays as well as the scanning (iScan) of the HumanMethylation 450 K BeadChip arrays was performed using the manufacturers' instructions. The data from all samples was imported in form of the idat files into Genomic Suite 6.6 (Partek) and Illumina normalisation was performed. ANOVA analysis was performed to detect differentially methylated loci between groups (e.g. IDC versus NAT, LNmet versus NAT, and IDC versus LNmet). Significance was granted if p < 0.05 and the estimated difference between groups (Δß) was <− 0.1 or > 0.1, signifying a methylation change of at least 10%. These analyses were performed on single loci and on differentially methylated regions (DMR) – a minimum of three significant consecutive probes. Pathway enrichment analysis was performed using Genomic Suite 6.6 (Partek). All significant loci were filtered to include loci that are within enhancer and/or promoter regions. These were then used for pathway enrichment analysis, a tool within Genomic Suite 6.6 (Partek). The enrichment score is the negative natural log of the enrichment p-value derived from the Fisher's exact test of the pathway enrichment analysis.
3. Discussion
Here we have described a dataset involving miRNA, gene and epigenome analysis of TNBC primary breast cancers, their matched normal adjacent tissues and matched lymph node metastases. This dataset also includes breast cancers of the triple negative breast cancer subtype with no known lymph node involvement, hence, providing a unique opportunity to dissect clinically relevant changes associated with lymph node metastasis in triple negative breast cancer. To the best of our knowledge, no other multi-platform dataset exists that includes matched lymph node metastases in this subtype. In breast cancer, the number of positive lymph nodes (LN) is known to have an inverse linear correlation with prognosis and survival [4]. This is not the case with TNBC, where it has been shown that any LN involvement is associated with worse disease-free and overall survival [5]. Hence, the use of this multi-platform dataset is likely to uncover novel markers and key pathways involved in progression to lymph node metastasis in TNBC.
Conflict of interest
The authors declare that there are no competing interests.
Acknowledgements
The authors would like to thank Dr. Ricardo Vilain for pathological review of all tumour and normal tissue specimens used in this analysis as well as Ms. Tina Hope and Ms. Sarah Nielsen for assistance with archival specimens. This work was supported by funding from the National Breast Cancer Foundation (CG-12-07) and the Hunter Medical Research Institute (HMRI 10-22).
References
- 1.Avery-Kiejda K.A., Braye S.G., Mathe A., Forbes J.F., Scott R.J. Decreased expression of key tumour suppressor microRNAs is associated with lymph node metastases in triple negative breast cancer. BMC Cancer. 2014;14(1):51. doi: 10.1186/1471-2407-14-51. [DOI] [PMC free article] [PubMed] [Google Scholar]
- 2.Mathe A., Wong-Brown M., Locke W.J., Stirzaker C., Braye S.G., Forbes J.F., Clark S.J., Avery-Kiejda K.A., Scott R.J. DNA methylation profile of triple negative breast cancer-specific genes comparing lymph node positive patients to lymph node negative patients. Sci Rep. 2016;6:33435. doi: 10.1038/srep33435. [DOI] [PMC free article] [PubMed] [Google Scholar]
- 3.Mathe A., Wong-Brown M., Morten B., Forbes J.F., Braye S.G., Avery-Kiejda K.A., Scott R.J. Novel genes associated with lymph node metastasis in triple negative breast cancer. Sci Rep. 2015;5:15832. doi: 10.1038/srep15832. [DOI] [PMC free article] [PubMed] [Google Scholar]
- 4.Carter C.L., Allen C., Henson D.E. Relation of tumor size, lymph node status, and survival in 24,740 breast cancer cases. Cancer. 1989;63(1):181–187. doi: 10.1002/1097-0142(19890101)63:1<181::aid-cncr2820630129>3.0.co;2-h. [DOI] [PubMed] [Google Scholar]
- 5.Hernandez-Aya L.F., Chavez-Macgregor M., Lei X., Meric-Bernstam F., Buchholz T.A., Hsu L., Sahin A.A., Do K.A., Valero V., Hortobagyi G.N., Gonzalez-Angulo A.M. Nodal status and clinical outcomes in a large cohort of patients with triple-negative breast cancer. J. Clin. Oncol. 2011;29(19):2628–2634. doi: 10.1200/JCO.2010.32.1877. [DOI] [PMC free article] [PubMed] [Google Scholar]


