

Abstract
Importance
Neurocognition is a central characteristic of schizophrenia and other psychotic disorders. Identifying the pattern and severity of neurocognitive functioning during the “near-psychotic”, prodromal, clinical high-risk (CHR) state is necessary to develop accurate predictors of psychosis and more effective and potentially preventative treatments.
Objective
Identify core neurocognitive dysfunctions associated with the CHR phase, and measure the ability of neurocognitive tests to predict the transition to psychosis. Determine if the neurocognitive deficits are robust or explained by potential confounders.
Design
Case control study. Baseline neurocognitive functioning collected from 2008–2012 in the second phase of the North American Prodrome Longitudinal Study (NAPLS-2).
Setting
A consortium of eight university-based, outpatient programs studying the psychosis prodrome in North America.
Participants
CHR individuals (n=689) and healthy controls (HCs, n=264) consisting of 137 male and 127 female HC and 398 male and 291 female CHR individuals ages 12–35.
Interventions or Exposures
A naturalistic, observational study.
Main Outcome and Measure(s)
Neurocognitive differences between those who did and did not transition to psychosis, differences between medicated and unmedicated groups, and time to conversion. Nineteen neuropsychological tests and four factors derived from factor analysis.
Results
The factors were Executive Function/Visual-Spatial, Verbal, Attention/Working Memory, and Declarative Memory. Amongst widespread mild to moderate impairments, CHR individuals were significantly impaired compared to HCs on Attention/Working Memory and Declarative Memory. CHR converters had large Declarative Memory and Attention/Working Memory deficits (Cohen’s d = ~0.8, p <.001) compared with controls and were significantly worse on these dimensions than non-converters. In Cox regression, impaired Declarative Memory and high Verbal (premorbid) ability in addition to age, site and positive psychotic symptoms, significantly predicted time to conversion in those who later transitioned to psychosis. The pattern of impairments could not be accounted for by premorbid or current general cognitive ability, medications, current depression, alcohol or cannabis abuse.
Conclusions and Relevance
Neurocognitive impairment is a robust characteristic of CHR individuals, especially those who later develop psychosis. Tests tapping verbal and visual declarative memory and attention/working memory were most sensitive to imminent psychosis amongst those at CHR. Interventions targeting the enhancement of neurocognitive functioning are warranted in this population.
Keywords: Neurocognition, Clinical High Risk, Prodrome, Psychosis, Schizophrenia, Antipsychotic Medications
INTRODUCTION
Neurocognitive dysfunction is a hallmark feature of schizophrenia1–5 and, to a lesser extent, of other psychoses6; a conceptualization originating roughly 100 years ago7 with Kraepelin8 and Bleuler9. There is ample evidence of significant but milder impairments during the premorbid phase10–12, greater deficits during the prodromal or clinical high risk (CHR) period,13–15 culminating in relatively severe deficits in the first episode16 and chronic phases17. This suggests an evolution of neurocognitive dysfunction in individuals developing psychosis, especially schizophrenia10,14,18,19. The CHR20 period is of considerable interest because it offers a temporal window into the changes occurring during the “near-psychotic” state, before confounders such as chronicity and long-term medication use cloud the picture.
A substantial body of neurocognitive research in CHR populations has been summarized in a number of meta-analyses13–15. “Small-to-medium effect size (ES) impairments across most neurocognitive domains studied (Cohen’s d = −0.26 to −0.67) and small-to-large ESs (d = −0.35 to −0.84) in those who convert to psychosis (CHR+C)” have been reported14. Verbal memory and processing speed have emerged as relatively strong predictors of psychosis13,14,21–24. However, small samples, different measures, and variable reporting of sample characteristics limit the reliability of these findings. In this second phase of the North American Prodrome Longitudinal Study (NAPLS-2), we assessed the largest CHR sample to date.
First, we sought to identify the key neurocognitive functions impaired in the CHR stage, especially in those who later convert to psychosis. Descriptions of schizophrenia place considerable emphasis on the centrality of dysfunctions in attention1,2,25,26 and working memory27,28. Evidence of severe deficits in declarative memory29 has more recently emerged in first episode16,30,31 and CHR14,21,22 samples. Olfactory identification deficits have also been touted as a possible risk factor32,33 and processing speed34 and general cognitive ability have been shown to be robustly impaired in persons who later develop schizophrenia.10,14 We chose to provide extensive coverage of neurocognitive dimensions thought a priori to mark the evolution into frank psychosis.
Second, we investigated if the neurocognitive profiles were characterized by a general deficit syndrome or specific impairments35. This is of particular relevance for those individuals who transition to psychotic disorders as it provides critical information about the nature of neurocognition in the earliest phase of psychosis36. We hypothesized that the CHR+C group would be characterized by especially salient deficits against a background of general impairments.
Third, we examined differences between medicated and unmedicated CHR individuals. Many of these young people take a range of medications including antipsychotics.37 Such medications could improve or impair cognition idiosyncratically. Prior CHR neurocognitive studies have not systematically addressed medication status. The large sample in NAPLS-2 enabled an investigation of a sizeable subgroup of CHR+C individuals who have never been medicated, and thus help to identify an unadulterated picture of neurocognitive function.
Finally, we explored the potential usefulness of neurocognition for predicting transition to psychosis. While it is unlikely that neurocognitive measures will be highly predictive by themselves of conversion to psychosis, in part because they are impaired in many neuropsychiatric disorders38,39, knowing their relative sensitivities in combination with clinical features may help in the real-world prediction of psychosis or disability24,40,41.
METHODS
Participants
NAPLS-2 is a consortium of eight programs studying the psychosis prodrome in North America, as in NAPLS-1. The methodology and clinical features of the NAPLS-2 study are detailed elsewhere42,43. From a sample of 764 CHR participants and 279 healthy controls (HCs) ranging in age from 12–35, 689 CHR and 264 HC participants provided baseline neurocognitive data. The study protocols and informed consents were approved by the ethical review boards of all sites, and all procedures comply with the ethical standards of the relevant committees on human experimentation and with the Helsinki Declaration, as revised in 2008.
Inclusion and exclusion criteria
The CHR sample met the Criteria of Prodromal Syndromes (COPS)20, based on the Structured Interview for Psychosis Risk Syndromes (SIPS)20, or if under age 19, criteria for schizotypal personality disorder (n=21) or COPS. Participants were excluded if they had a lifetime Axis I psychotic disorder, estimated IQ’s < 70 on both measures of IQ, a central nervous system disorder, or DSM-IV substance dependence in the past 6 months. Other non-psychotic DSM-IV disorders were not exclusionary (e.g., substance abuse disorder, major depression) unless they clearly caused or better accounted for prodromal symptoms. Antipsychotic medications were allowed, provided there was clear evidence that psychotic symptoms were not present when the medication was started. HCs could not meet criteria for any prodromal syndrome, current or past psychotic or Cluster A personality disorder, or have first-degree relatives with a history of psychotic disorder or psychotic symptoms.
Measures
The SCID was used to rule out psychosis and to identify DSM-IV Axis I or cluster A disorders.44 For some analyses, we used a rescaled sum of unusual thought content/delusional ideas (P1) and suspiciousness/persecutory ideas items (P2) from the SIPS positive symptoms45. Transition to psychosis was determined by meeting SIPS Presence of Psychotic Symptoms (POPS) criteria20. Assessments were at baseline, 12 and 24 months. Current alcohol and marijuana use was assessed with the Alcohol and Drug Use Scale (AUS/DUS46). The Calgary Depression Scale for Schizophrenia (CDSS47,48) was used to assess depression.
The neuropsychological battery was designed to cover a range of functions using well-established clinical neuropsychological tests, as well as experimental measures of sensory, perceptual, or cognitive functions hypothesized to be important indicators of CHR status or conversion to psychosis. These included the MATRICS battery49–52, the Wechsler Abbreviated Scale of Intelligence (WASI) for general intellectual ability53 and the Wide Range Achievement Test-4 (WRAT-4) reading task to estimate premorbid ability54. Experimental measures included the Babble test (for auditory perception55), the University of Pennsylvania Smell Identification Test (UPSIT56) for olfactory identification, a visual and verbal paired associate memory test (PAM57), and three auditory attention & working memory continuous performance tests (ACPT58–60). One summary measure from each test was chosen a priori as the best estimate of the function of that test. We factor analyzed (FA) the test battery to reduce the number of variables. Supplementary (S) text and Table S1 provide extensive detail on the battery.
Statistical Analysis
We examined missing data prior to implementing multiple imputation (MI)61,62. From a sample of 1043, 953 received baseline neurocognitive testing (91.4%). Of the CHR sample that transitioned to psychosis during the two-year follow-up (n=93), 89 received testing (95.7%). Overall data completeness for the tested sample (n=953) was 96.6% for 19 test variables. After MI, we conducted a FA of the 19 neurocognitive variables (see Supplementary text). All analyses were done with SPSS, version 23.63
Groups were HCs, CHR converters (CHR+C) and non-converters (CHR-NC). T-tests, Kolmogorov-Smirnov Z and Chi Square tests were used to assess demographic comparability. Due to differences in age and maternal education, we controlled for both using MANCOVA and also controlled for site as a random effects factor with a linear mixed model. We covaried for estimated and premorbid IQ to test the role of general intellectual ability in cognitive dysfunctions. We compared medicated vs. nonmedicated groups of CHR+C vs HC, and CHR+C vs CHR-NC by conducting MANOVA with planned comparisons using residualized factor scores generated from the linear mixed models.
To examine group cognitive profiles we residualized out age and maternal education from all neurocognitive indices (four factors derived from FA). Area under the curve (AUC) was calculated by the ROC program in SPSS. Prediction of conversion to psychosis and time to conversion was assessed by logistic and Cox regression. Covariates were selected based on similar prediction analyses conducted in NAPLS-164 and NAPLS-245 and entered into the model if they were associated with survival time and predicted conversion status in logistic regression. Survival time was time to the last SIPS interview or conversion, whichever occurred first. Candidate covariates were added to the model as a block then subjected to backward selection with a criterion p value of 0.10. Candidates that survived at p ≤ .05 within domain were entered into an omnibus model. ESs were calculated with Cohen’s d. Bonferroni corrected significance for mean comparisons was set for individual tests at p<.00263 (.05/19) and for factors at p< .0125 (.05/4).
RESULTS
Demographics (Table 1)
Table 1.
Demographic and Clinical Characteristics Between Clinical High-Risk (CHR) Groups and Healthy Control (HC) Participants
| HC (n=264) | CHR (n=689) | CHR-NC (n=600) | CHR+C (n=89) | HC v. CHR | HC v. CHR+C | CHR-C v. CHR-NC | ||
|---|---|---|---|---|---|---|---|---|
| Variable | Mean (SD) | Cohen’s d (p) | ||||||
| Age in years | 19.8 (4.7) | 18.5 (4.2) | 18.5 (4.3) | 18.1 (3.6) | .30 (<.001) | .38 (<.01) | .09 (.41) | |
| Years of education | 12.7 (3.6) | 11.2 (2.8) | 11.3 (2.8) | 11.0 (2.5) | .49 (<.001) | .51 (<.001) | .11 (.23) | |
| WASI IQ Estimate | 111.0 (14.1) | 103.7 (15.3) | 103.9 (15.4) | 102.1 (14.6) | .49 (<.001) | .63 (<.001) | .12 (.30) | |
| WRAT-4 Reading | 108.6 (16.5) | 105.1 (16.4) | 105.1 (16.6) | 105.6 (15.2) | .21 (<.01) | .19 (.13) | −.03 (.78) | |
| Calgary Depression Scale | 4.1 (4.8) | 4.6 (4.8) | 4.5 (4.8) | 5.1 (4.8) | −.10 (.20) | −.21 (.12) | −.12 (.31) | |
| Days from Baseline SIPS to Final Follow-up SIPS1,2 | 642.5 (198.7) | 540.2 (265.8) | 583.9 (236.5) | 291.5 (287.2) | .41 (<.001) | 1.57 (<.001) | 1.20 (<.001) | |
| Number (%) | χ2 (p) | |||||||
| Alcohol Use1 | .01 (.91) | .24 (.62) | .28 (.60) | |||||
| 1-2x/week or more | 41 (15.8) | 104 (15.5) | 92 (15.8) | 12 (13.6) | ||||
| Less than 1–2x/week | 218 (84.2) | 565 (84.5) | 489 (84.2) | 76 (86.4) | ||||
| Cannabis Use1 | .39 (.53) | .08 (.77) | .01 (.91) | |||||
| 1–2x/week or more | 21(8.1) | 63 (9.4) | 55 (9.5) | 8 (9.1) | ||||
| Less than 1–2x/week | 238 (91.9) | 606 (90.6) | 526 (90.5) | 80 (90.9) | ||||
| Sex | 2.7 (.10) | 2.06 (.15) | .68 (.41) | |||||
| Male | 137 (51.9) | 398 (57.8) | 343 (57.2) | 55 (61.8) | ||||
| Female | 127 (48.1) | 291 (42.2) | 257 (42.8) | 34 (38.2) | ||||
| Race1 | .60 (.44) | <.001 (1.0) | .29 (.59) | |||||
| Not White | 119 (45.1) | 291 (42.3) | 251 (42.0) | 40 (45.0) | ||||
| White | 145 (54.9) | 397 (57.6) | 348 (58.0) | 49 (55.1) | ||||
| Hispanic or Latino1 | 45 (17.0) | 127 (18.4) | 111 (18.5) | 16 (18.0) | .25 (.62) | .04 (.84) | .01 (.91) | |
| Father’s education1 | 1.2 (.27) | .79 (.37) | .08 (.78) | |||||
| High school or less | 82 (31.1) | 232 (33.7) | 201 (33.5) | 31 (34.8) | ||||
| College and more | 177 (67.0) | 421 (61.1) | 368 (61.3) | 53 (59.6) | ||||
| Mother’s education | 12.8 (<.001) | 1.6 (.19) | 1.3 (.25) | |||||
| High school or less | 46 (17.4) | 198 (28.7) | 177 (29.5) | 21 (23.6) | ||||
| College and more | 218 (82.6) | 491 (71.3) | 423 (70.5) | 68 (76.4) | ||||
| Medication Status1,3 | ||||||||
| Never Medicated | 234 (90.3) | 249 (36.3) | 222 (37.2) | 27 (30.3) | — | — | 1.5 (.22) | |
| Currently Medicated | 7 (2.7) | 287 (41.8) | 249 (41.7) | 38 (42.7) | — | — | .05 (.83) | |
| Current Antipsychotics | 0 | 139 (20.3) | 117 (19.6) | 22 (24.7) | — | — | 1.3 (.25) | |
| Current Antidepressants | 2 (0.8) | 176 (25.7) | 158 (26.5) | 18 (20.2) | — | — | 1.5 (.22) | |
| Current Stimulants | 2 (0.8) | 47 (6.7) | 39 (6.5) | 8 (9.0) | — | — | .75 (.38) | |
p < 0.05,
p < 0.01,
p < 0.001.
Categorical variables tested by Chi Square test. Expanded alcohol and cannabis use (6 categories) and parental education (8 categories) were tested with Kolmogorov-Smirnov test with the same results as listed; Continuous variables tested by t-test. Cohen’s d used for effect sizes.
Some subjects have missing data.
SIPS is Structured Interview for Prodromal Symptoms,
Some people taking more than one medication. HC = Healthy Control; CHR = Clinical High Risk; CHR+C = CHR Converter; CHR – NC = CHR Non-Converter
There were 137 male and 127 female HCs and 398 male and 291 female CHR individuals. HCs were significantly older, had significantly more education, and HC mothers had significantly more education. The groups did not differ in sex or race distribution, father’s education, or ethnicity. There were no significant differences on any demographic characteristic between CHR+C and CHR-NC groups.
Clinical (Table 1)
Groups did not significantly differ in frequency of alcohol or marijuana use or on depression. There were no significant correlations between these clinical characteristics and neurocognitive factors. The CHR+C group had a significantly shorter follow-up period than the CHR-NC subgroup, reflecting time to conversion and attrition. CHR+C and CHR-NC subjects received a variety of medications including anti-psychotics, anti-depressants, stimulants, and others, but there were no significant differences in rates between the two CHR groups.
Factor Analysis (Table 2)
Table 2. Factor Analysis of 17 Test Scores1.
Rotated Factor Matrix after Varimax rotation with Kaiser normalization
| Factor | ||||
|---|---|---|---|---|
| 1 | 2 | 3 | 4 | |
| WRAT4 Reading | .188 | .769 | .241 | .133 |
| WASI Vocabulary | .203 | .747 | .206 | .313 |
| WASI Block Design | .733 | .392 | −.015 | .273 |
| A-CPT-QA Vigil | .166 | .186 | .416 | .210 |
| A-CPT-Q3A Mem | .150 | .127 | .505 | .242 |
| A-CPT-Q3A INT | .390 | .168 | .387 | .177 |
| Trails A Transformed Score | .451 | .148 | .328 | .103 |
| BACS Symbol Coding | .365 | .189 | .514 | .300 |
| HVLT-R | .087 | .217 | .332 | .570 |
| WMS-3 Spatial Span F | .506 | .086 | .313 | .113 |
| WMS-3 Spatial Span B | .520 | .107 | .280 | .228 |
| U Maryland LNS | .275 | .430 | .418 | .349 |
| NAB Mazes | .602 | .108 | .137 | .152 |
| BVMT-R | .371 | .158 | .163 | .527 |
| Category Fluency | .179 | .212 | .303 | .391 |
| CPT-IP | .242 | .431 | .512 | .135 |
| PAM | .178 | .102 | .131 | .519 |
Nineteen tests were administered in the study. The Babble task did not correlate meaningfully with any of the other tasks, and the UPSIT was weakly correlated. Both loaded very weakly in initial Factor Analyses, and thus they were both excluded from the final Factor Analysis.
Bolded numbers are those with factor loadings of .40 or larger
Factor 1: Executive/Visual-Spatial
Factor 2: Verbal
Factor 3: Attention/Working Memory
Factor 4: Declarative Memory
Supplementary text explains factor selection. The factors (F) were: F1 – Executive Function (EF)/Visual-Spatial; F2 – Verbal; F3 – Attention/Working Memory (WM); F4- Declarative Memory. Two tests laden with sensory-perceptual processes (olfaction and audition) had very low (UPSIT) or negligible loadings (Babble) initially and were dropped from the FA. They were analyzed with the other individual tests. The bivariate correlations among tests are in Table S2.
Neurocognition Group Comparisons: CHR vs. Controls (Table 3)
Table 3.
Neuropsychological Performance Between Clinical High-Risk (CHR) Groups and Healthy Control (HC) Participants
| Neuropsychological Tasks and Factors | HC (n = 264) | CHR (n = 689) | CHR-NC (n=600) | CHR-C (n=89) | HC v. CHR | HC v. CHR-NC | HC v. CHR+C | CHR-NC v. CHR+C |
|---|---|---|---|---|---|---|---|---|
| Mean (SD) | Statistical Significance (P values) | |||||||
| WRAT4 Reading | 60.4 (6.4) | 58.2 (7.5) | 58.1 (7.7) | 58.8 (5.5) | .12 | .09 | .84 | .37 |
| WASI Vocabulary | 59.9 (9.5) | 54.4 (10.2) | 54.4 (10.4) | 54.2 (8.9) | <.001 | <.001 | .002 | .85 |
| WASI Block Design | 49.1 (14.4) | 45.2 (15.6) | 45.5 (15.5) | 42.8 (15.6) | .03 | .08 | .01 | .10 |
| A-CPT-QA Vigil – % Hits | 97.2 (4.9) | 94.5 (8.5) | 94.8 (8.2) | 92.2 (10.2) | <.001 | <.001 | <.001 | .004 |
| A-CPT-Q3A Mem – % Hits | 87.6 (10.9) | 80.6 (15.2) | 81.2 (14.9) | 76.7 (16.7) | <.001 | <.001 | <.001 | .006 |
| A-CPT-Q3A INT – % Hits | 61.0 (20.8) | 54.8 (22.0) | 55.4 (21.8) | 50.5 (23.2) | .002 | .007 | <.001 | .04 |
| Trails A transformed score | 0.04 (0.0) | 0.04 (0.0) | 0.04 (0.0) | 0.03 (0.0) | <.001 | <.001 | <.001 | .01 |
| BACS Symbol Coding | 64.3 (12.9) | 56.8 (12.9) | 57.3 (13.0) | 53.4 (12.0) | <.001 | <.001 | <.001 | .01 |
| HVLT-R | 27.4 (4.2) | 25.5 (5.1) | 25.7 (5.1) | 24.4 (5.3) | <.001 | <.001 | <.001 | .02 |
| WMS-3 Spatial Span F | 9.3 (2.0) | 8.6 (2.1) | 8.6 (2.0) | 8.3 (2.4) | <.001 | <.001 | .001 | .33 |
| WMS-3 Spatial Span B | 8.6 (1.8) | 7.9 (2.0) | 7.9 (2.0) | 7.6 (2.3) | <.001 | <.001 | <.001 | .16 |
| U Maryland LNS | 16.3 (3.4) | 14.6 (3.7) | 14.7 (3.6) | 13.8 (4.2) | <.001 | <.001 | <.001 | .02 |
| NAB Mazes | 21.0 (4.8) | 20.1 (5.1) | 20.2 (5.2) | 19.7 (4.9) | .05 | .09 | .06 | .37 |
| BVMT-R | 27.6 (5.4) | 25.4 (6.1) | 25.7 (6.0) | 23.3 (6.6) | <.001 | <.001 | <.001 | <.001 |
| Category Fluency | 25.7 (5.7) | 23.5 (5.8) | 23.7 (5.8) | 22.2 (5.8) | <.001 | <.001 | <.001 | .02 |
| CPT-IP – d1 | 2.8 (0.7) | 2.4 (0.8) | 2.4 (0.8) | 2.3 (0.8) | <.001 | <.001 | <.001 | .40 |
| PAM – % Hits | 68 (18.0) | 63 (18.0) | 63 (18.0) | 57 (18.0) | .001 | .009 | <.001 | .001 |
| Babble | 2.9 (2.4) | 3.2 (3.0) | 3.2 (3.1) | 3.5 (2.2) | .14 | .19 | .13 | .45 |
| UPSIT | 34.6 (3.7) | 33.5 (4.5) | 33.6 (4.5) | 33.0 (4.9) | .01 | .02 | .02 | .30 |
| 1. Executive/Visual-Spatial | 0.13 (0.85) | −0.05 (0.86) | −0.03 (0.85) | −0.20 (0.88) | .01 | .04 | .004 | .08 |
| 2. Verbal | 0.19 (0.79) | −0.07 (0.89) | −0.09 (0.90) | 0.07 (0.75) | .36 | .20 | .30 | .05 |
| 3. Attention/Working Memory | 0.34 (0.66) | −0.13 (0.80) | −0.10 (0.78) | −0.33 (0.92) | <.001 | <.001 | <.001 | .01 |
| 4. Declarative Memory | 0.19 (0.66) | −0.07 (0.77) | −0.03 (0.75) | −0.38 (0.82) | <.001 | <.001 | <.001 | <.001 |
d1 is d prime, a measure of signal detection; P values reflect age, site, and maternal education corrected models. Bonferroni corrected p values are shown in bold for effect sizes: p <.0026 for individual tasks, <.0125 for factors. Undlerlined Values: Significant at Bonferroni level after controlling for WASI IQ. Shaded Values: Significant at Bonferroni level after controlling for WRAT4 Reading. HC = Healthy Control; CHR = Clinical High Risk; CHR+C = CHR Converter; CHR – NC = CHR Non-Converter
The CHR group performed significantly worse than HCs on all 19 tests combined (MANOVA F [19, 933] = 6.71, p < .001), on the four factors combined (F [4, 948] = 24.18, p < .001) and controlling for age, maternal education, and site on 2/4 factors, Attention/WM [1,948]=56.52, p< .001; Declarative Memory F[1,948]=22.83, p<.001) and on 14/19 individual tests. The largest ES (Attention/WM) was of moderate magnitude. The average ES across the 19 tests was small, d = 0.30. Model-corrected profiles are shown in Figure 1. Controlling separately for WASI IQ and WRAT4 Reading, Attention/WM and Declarative Memory factors remained significantly different between groups. CHR-HC differences remained significant on 12/14 individual tests covarying WRAT Reading. Covarying WASI IQ yielded fewer significant differences.
Figure 1.
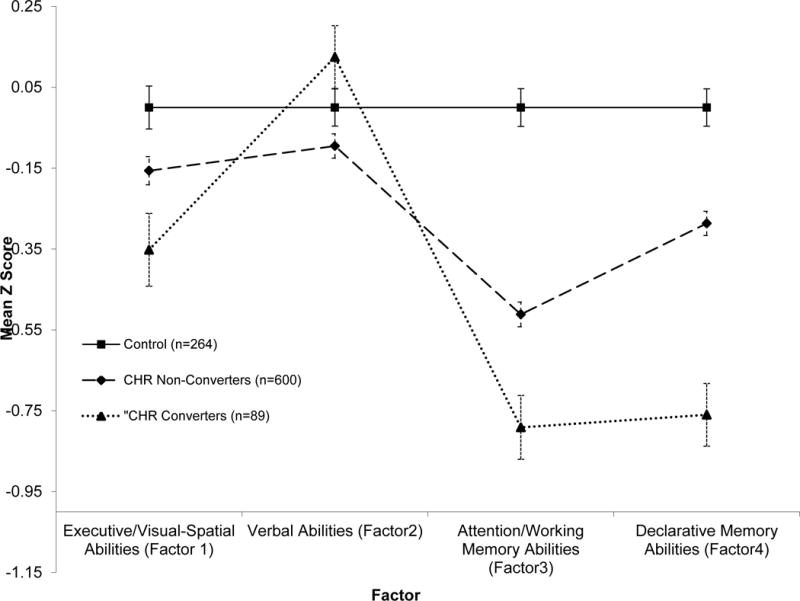
Neuropsychological Profile By Diagnostic Group Adjusted for Age, Maternal Education and Site
CHR+C vs. Controls
CHR+C participants performed significantly worse than HCs (F [19,333] =5.95, p < .001) using all tests. The four factor MANOVA (F [4, 348] = 22.82, p < .001) showed significant differences. In models controlling for age, site, and maternal education, CHR+C subjects performed significantly worse on 3/4 factors: Attention/WM (d = 0.80), Declarative Memory (d = 0.77), and EF/Visual-Spatial (d = 0.36). The average ES across the 19 tests was d= 0.47. Figure 2 illustrates model adjusted ESs. CHR+C subjects performed significantly worse on Attention/WM, Verbal, and Declarative Memory and 12/14 individual tests after controlling for WRAT Reading. They showed fewer significant test differences after covarying WASI IQ.
Figure 2.
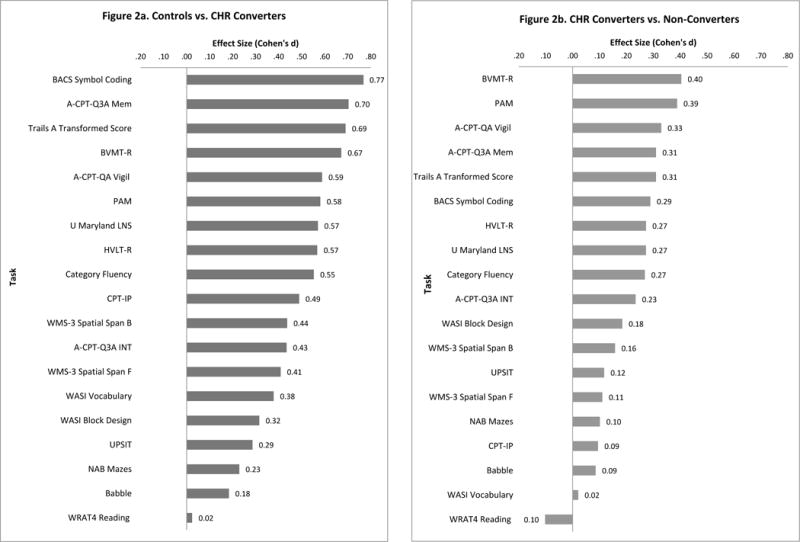
Effect Sizes (Cohen’s d) for Individual Tests Adjusted for Age, Maternal Education and Site, for Controls, Clinical High Risk (CHR) Participants, and CHR Converters
Impairments were comparable comparing 252 currently unmedicated HCs with 51 unmedicated CHR+Cs, with 38 currently medicated CHR+Cs, and between 236 never medicated HCs with 29 never medicated CHR+Cs. The smaller group of CHR+C’s on antipsychotic medications was significantly impaired on Attention/WM and Declarative Memory compared to HCs. Moreover, there were no significant cognitive differences between currently unmedicated CHR+Cs vs. medicated CHR+Cs, or between never medicated CHR+Cs vs. medicated CHR+Cs, or between CHR+Cs with and without antipsychotic medications. (Supplementary Text, Table S3 and Figure S1 for details).
CHR+C vs. CHR-NC (table 3)
The CHR+C group performed significantly worse than CHR-NC (MANOVA F [19,669] = 1.90, p = .01; four factor MANOVA F [4, 684] = 6.51, p < .001), specifically on Attention/Working Memory (d=.28) and Declarative Memory (d = 0.48) after controlling for age, site, and maternal education. CHR+C performed significantly worse in mixed linear model contrasts only on BVMT-R (d = 0.40) and PAM (d = 0.39). The average ES across the 19 tests was d = 0.20. Covarying WASI IQ and WRAT Reading, CHR+C’s performed significantly better on Verbal, and worse on Declarative Memory, and on the BVMT-R and PAM tasks.
Prediction Analyses (see Supplementary text)
After exploring a range of possible predictors, Age (b = −.10, Hazard Ratio [HR] = .90, 95% Confidence Interval [CI] = .84–.97, p = .003, P1/P2 symptoms (b = .44, HR = 1.56, 95% CI = 1.36–1.78, p <.001) and dummy codes for 3 sites were retained. The Verbal (b = .40, HR = 1.48, 95% CI = 1.08–2.04, p =.02) and Declarative Memory (b = −.87, HR = .42, 95% CR = .31–.56, p <.001) factors were retained. Similar results were observed in logistic regression analyses predicting conversion. Cox regression was then run with strongest loading individual component tests (BVMT-R, HVLT-R, and PAM for Declarative Memory; WRAT4 Reading and WASI-Vocabulary for Verbal). All covariates were retained, as were BVMT-R (b = .05, HR = .95, 95% CI = .91–.99, p = .009), HVLT-R (b = −.05, HR = .95, 95% CI = .91–1.00, p = .04), WRAT4 Reading (b = .05, HR = 1.05, 95% CR = 1.01–1.10, p = .009) and PAM (b = −1.83, HR = .16, 95% CI = .05–.54, p = .003). Declarative Memory had the highest AUC (.624) followed by Attention/WM (AUC = .568). The highest AUCs for Declarative Memory tests were PAM (.607), BVMT-R (.604), and HVLT-R (.576) and for Attention/WM were BACS Symbol Coding (.584), Trails A (.582), ACPT Q3A Memory (.579) and ACPT QA Vigilance (.568) (Table S4).
DISCUSSION
In the largest and most detailed study of CHR prodromal cases, using a multi-site, case-control design and standardized assessments, we demonstrated that individuals at CHR were impaired in virtually all neurocognitive dimensions compared to controls, and this could not be accounted for by premorbid or current general cognitive ability, current depression, medications, alcohol or cannabis abuse. ESs in comparison to HCs for Declarative Memory and Attention/WM were large (d=~0.8) for CHR+C participants. Compared to CHR-NC, CHR+C participants were significantly impaired in Attention/WM and Declarative Memory, the latter significantly predicting conversion to psychosis and time to event in concert with positive symptoms. Comparable impairments were observed in never-medicated and currently unmedicated CHR-NCs and CHR+C’s. These data demonstrate the sensitivity of neurocognitive function as a component risk marker for psychosis.
Our findings support theoretical models hypothesizing Attention/WM impairments, and even more strongly, impaired Declarative Memory, as central to the CHR stage.20–22 The results are consistent with NAPLS-1, in which Declarative Memory had the largest ES decrement and roughly the same magnitude in CHR+C.13,14 The distinct profile of performance across domains, especially in CHR+C, suggests that at the incipient psychotic phase, specific forms of neurocognition are affected and are predictive of later psychosis.
Within CHR participants, there was considerable variability in neurocognitive performance. CHR-NC’s impairments (mean d = 0.30), were on the order of other psychiatric disorders in young people, such as attention-deficit/hyperactivity disorder (ADHD)65. CHR+Cs impairments (mean d = 0.47) were approximately 57% larger, although smaller than those observed in first episode schizophrenia16 (Table S5). Analyses of individual variability and longitudinal analyses are needed to identify how profile and severity differ according to comorbid disorders, final diagnoses (e.g., schizophrenia vs. bipolar psychosis) and pre- and post-conversion.
A key question was how neurocognitive deficits are associated with medication status. Psychotropic-naive and unmedicated subgroups had significant impairments comparable to the overall CHR subgroups. Treated groups, including with antipsychotic medications, were largely comparable to those without treatment, except they had somewhat greater Attention/WM impairment. These observations emphasize the essential nature of neurocognitive impairment in the CHR stage and de-emphasize the role of medications as confounders in our results. Our design precludes conclusions about causality and future work should study the effect of medications on neurocognition in CHR populations in a prospective design.
There were a number of other potentially important observations. The unexpectedly higher Verbal score (reflecting WRAT4 Reading) that was retained in logistic and Cox regressions in concert with impaired Declarative Memory was not a significant predictor in univariate comparisons. This pattern of high verbal premorbid ability and impaired memory, coupled with P1/P2 composite appears to be a pernicious combination predicting conversion and needs replication. Importantly, the BVMT-R (a visual-memory test) showed comparably large impairments as the two verbal memory tasks, highlighting that Declarative Memory deficits in CHR are not solely verbal, and that Declarative Memory impairments are key neurocognitive risk markers66.
Neurocognitive tests used in concert with other clinical and psychobiological measures may enhance prediction of psychosis or functional outcome. For example, in analyses limited to two tests selected from literature review14 prior to these neuropsychological analyses, NAPLS-2 investigators found that the HVLT-R and BACS Symbol Coding added modest but significant independent predictive power above the clinical measures in a risk calculator algorithm for psychosis conversion45 and this was replicated in an independent non-NAPLS sample67. Similar results have been observed in other studies24,40,41. In this study, we showed that other tests, including BVMT-R, PAM, and ACPT QA Vigil added significant independent variance beyond P1-P2 symptoms, augmenting the importance of neurocognitive markers.
Strengths and Limitations
NAPLS-2, because of its large sample from diverse geographical areas, extensive neurocognitive coverage, remarkably complete neurocognitive dataset, and large never-medicated sample, allowed for a strong confirmation of neurocognitive hypotheses. The NAPLS-2 study built upon and improved the NAPLS-1 assessment, confirming and expanding prior results (Table S5). This broad range of measures expanded the scope of what is known about CHR neurocognition.
Limitations include the fact that most of these tests and factors are complex. Thus, while Declarative Memory is clearly affected, the tasks tapping this domain cannot parse the specific mechanisms underlying the deficits. Further research with more molecular measures of cognition, such as those developed by CENTRACS68, may allow specification of the cognitive processes underlying the deficits. We did not randomize or counterbalance the order of tests, so we cannot rule out order effects. However, the most impaired tasks were spread out across the battery from the sixth to the last tests in the battery so there is no obvious fatigue effect.
Conclusions
Neurocognitive impairment is common in CHR individuals, and of clinically meaningful magnitude, especially in those who later develop psychosis. Declarative Memory and Attention/WM are important targets for early cognitive enhancing interventions with this population69–73.
Supplementary Material
Acknowledgments
The authors would like to acknowledge Caitlin Bryant, Victoria Choate, Michelle Friedman-Yakoobian, Anthony Giuliano, Andrea Gnong-Granato, Matcheri S. Keshavan, Robert W. McCarley, Raquelle Mesholam-Gately, Jayne-Marie Nova, Corin Pilo-Comtois, Janine Rodenhiser-Hill, Rachael Serur, Lynda Tucker, and Joanne-Wojcik for their valued assistance with the study at the Beth Israel Deaconess Medical Center site. We also acknowledge the scientific contributions of Ralph E. Hoffman, of Yale University, who developed the Babble test, and who died during the writing of the manuscript. We would also like to acknowledge the support of Robert Heinssen. Statistical consultation was provided by Stephen V. Faraone, PhD, Michael F. Green, PhD and Gerhard Hellemann, PhD on the factor analyses and from Dr. Faraone on statistical approaches. No compensation was given to any of them specifically for this work. Dr. Faraone is a paid statistical consultant to the Commonwealth Research Center (directed by the first author) and provides periodic consultation as he did for this manuscript. Stephen V. Faraone, Ph.D. is Distinguished Professor of Psychiatry and of Neuroscience & Physiology, SUNY Upstate Medical University, New York. Michael F. Green, Ph.D. is a Professor-in-Residence in the Department of Psychiatry and Biobehavioral Sciences and the Semel Institute for Neuroscience and Human Behavior at the Geffen School of Medicine at UCLA, California. Gerhard Hellemann, PhD, is Assistant Professor of Statistics in UCLA’s Semel Institute for Neuroscience and Human Behavior and a senior faculty consultant in the Semel Institute Biostatistics Core (SIStat), UCLA, California. Dr. Seidman has obtained written permission to include the names of individuals in the Acknowledgment section of the manuscript. Dr. Seidman and Dr. Shapiro had full access to all the data in the study and take responsibility for the integrity of the data and the accuracy of the data analysis.
Role of Funding Source: This study was supported by the National Institute of Mental Health (NIMH) grants U01 MH081928, P50 MH080272, R01 MH096027 and the Commonwealth of Massachusetts SCDMH82101008006 to Dr. Seidman; grant U01 MH081984 to Dr. Addington; grants R01 MH60720, U01 MH082022 and K24 MH76191 to Dr. Cadenhead; grant U01 MH081902 to Dr. Cannon; P50 MH066286 (Prodromal Core) to Dr. Bearden; U01 MH081857 grant to Dr. Cornblatt; grant U01 MH082004 to Dr. Perkins; grant U01 MH081988 to Dr. Walker; grant U01 MH082022 to Dr. Woods; Clinical Translational Science Award (UL1RR025758) and General Clinical Research Center Grant (M01RR01032) from the National Center for Research Resources to Harvard University and Beth Israel Deaconess Medical Center, the National Center for Research Resources (P41RR14075), and Shared Instrumentation Grants (1S10RR023401, 1S10RR019307, 1S10RR023043). The content is solely the responsibility of the authors and does not necessarily represent the official views of the National Center for Research Resources or the National Institutes of Health. The NIMH had no further role in study design; in the collection, analysis and interpretation of data; in the writing of the report; and in the decision to submit the paper for publication.
Footnotes
Contributors: Drs. Seidman, Addington, Cadenhead, Cannon, Cornblatt, McGlashan, Perkins, Tsuang, Walker, Woods, Bearden, and Mathalon, were responsible for the design of the study and for the supervision of all aspects of data collection. Drs. Stone, and Woodberry contributed to data collection and supervision at the Beth Israel Deaconess Medical Center (BIDMC) site. Dr. Seidman led the writing up of the results, with contributions from Drs. Shapiro, Stone and Woodberry at BIDMC, and NAPLS Principal Investigators. Ms. Ashley Ronzio contributed to presentation of the data in figures and tables, and carried out some analyses. Drs. Seidman, Shapiro, Woodberry and Woods were responsible for data analysis. All authors contributed to and approved the final manuscript.
Conflict of Interest: There are no conflicts of interest for any of the authors with respect to the data in this paper or for the study.
References
- 1.Mirsky AF. Neuropsychological bases of schizophrenia. Ann Rev Psychol. 1969;20:321–348. doi: 10.1146/annurev.ps.20.020169.001541. [DOI] [PubMed] [Google Scholar]
- 2.Seidman LJ. Schizophrenia and brain dysfunction: an integration of recent neurodiagnostic findings. Psychol Bull. 1983;94(2):195–238. [PubMed] [Google Scholar]
- 3.Green MF. What are the functional consequences of neurocognitive deficits in schizophrenia? Am J Psychiatry. 1996;153(3):321–330. doi: 10.1176/ajp.153.3.321. [DOI] [PubMed] [Google Scholar]
- 4.Heinrichs RW. The primacy of cognition in schizophrenia. Am Psychol. 2005;60(3):229–242. doi: 10.1037/0003-066X.60.3.229. [DOI] [PubMed] [Google Scholar]
- 5.Kahn RS, Keefe RS. Schizophrenia is a cognitive illness: time for a change in focus. JAMA Psychiatry. 2013;70(10):1107–1112. doi: 10.1001/jamapsychiatry.2013.155. [DOI] [PubMed] [Google Scholar]
- 6.Lewandowski KE, Cohen BM, Ongur D. Evolution of neuropsychological dysfunction during the course of schizophrenia and bipolar disorder. Psychol Med. 2011;41:225–241. doi: 10.1017/S0033291710001042. [DOI] [PubMed] [Google Scholar]
- 7.Heckers S. What is the core of schizophrenia? JAMA Psychiatry. 2013;70(10):1009–10. doi: 10.1001/jamapsychiatry.2013.2276. [DOI] [PubMed] [Google Scholar]
- 8.Kraepelin E. Dementia Praecox and Paraphrenia. Edinburgh, Scotland: E & S Livingston; 1919. [Google Scholar]
- 9.Bleuler E. Dementia Praecox or the Group of Schizophrenias. New York, NY: International Universities Press; 1950. [Google Scholar]
- 10.Woodberry K, Giuliano AJ, Seidman LJ. Premorbid IQ in schizophrenia: a meta-analytic review. Am J Psychiatry. 2008;165:579–587. doi: 10.1176/appi.ajp.2008.07081242. [DOI] [PubMed] [Google Scholar]
- 11.Reichenberg A, Caspi A, Harrington H, et al. Static and dynamic cognitive deficits in childhood preceding adult schizophrenia: a 30-year study. Am J Psychiatry. 2010;167:160–169. doi: 10.1176/appi.ajp.2009.09040574. [DOI] [PMC free article] [PubMed] [Google Scholar]
- 12.Cannon M, Caspi A, Moffitt TE, et al. Evidence for early-childhood, pan-developmental impairment specific to schizophreniform disorder: results from a longitudinal birth cohort. Arch Gen Psychiatry. 2002;59:449–456. doi: 10.1001/archpsyc.59.5.449. [DOI] [PubMed] [Google Scholar]
- 13.Fusar-Poli P, Deste G, Smieskova R, et al. Cognitive functioning in prodromal psychosis: a meta-analysis. Arch Gen Psychiatry. 2012;69(6):562–571. doi: 10.1001/archgenpsychiatry.2011.1592. [DOI] [PubMed] [Google Scholar]
- 14.Giuliano AJ, Li H, Mesholam-Gately RI, Sorenson SM, Woodberry KA, Seidman LJ. Neurocognition in the psychosis risk syndrome: a quantitative and qualitative review. Curr Pharm Des. 2012;18(4):399–415. doi: 10.2174/138161212799316019. [DOI] [PubMed] [Google Scholar]
- 15.Bora E, Murray RM. Meta-analysis of cognitive deficits in ultra-high risk to psychosis and first-episode psychosis: do the cognitive deficits progress over, or after, the onset of psychosis? Schizophr Bull. 2014;40(4):744–755. doi: 10.1093/schbul/sbt085. [DOI] [PMC free article] [PubMed] [Google Scholar]
- 16.Mesholam-Gately RI, Giuliano AJ, Goff KP, Faraone SV, Seidman LJ. Neurocognition in first-episode schizophrenia: a meta-analytic review. Neuropsychology. 2009;23(3):315–336. doi: 10.1037/a0014708. [DOI] [PubMed] [Google Scholar]
- 17.Heinrichs RW, Zakzanis KK. Neurocognitive deficits in schizophrenia: a quantitative review of the evidence. Neuropsychology. 1998;12(3):426–445. doi: 10.1037//0894-4105.12.3.426. [DOI] [PubMed] [Google Scholar]
- 18.MacCabe JH, Wicks S, Löfving S, et al. Decline in cognitive performance between ages 13 and 18 years and the risk for psychosis in adulthood: a Swedish longitudinal cohort study in males. JAMA Psychiatry. 2013;70:261–270. doi: 10.1001/2013.jamapsychiatry.43. [DOI] [PubMed] [Google Scholar]
- 19.Liu CH, Keshavan MS, Tronick E, Seidman LJ. Perinatal risks and childhood premorbid indicators of later psychosis: next steps for early psychosocial intervention. Schizophr Bull. 2015;41:801–816. doi: 10.1093/schbul/sbv047. [DOI] [PMC free article] [PubMed] [Google Scholar]
- 20.McGlashan TH, Walsh BC, Woods SW. The psychosis-risk syndrome: handbook for diagnosis and follow-up. New York, NY: Oxford University Press, Inc.; 2010. [Google Scholar]
- 21.Lencz T, Smith CW, McLaughlin D, et al. Generalized and specific neurocognitive deficits in prodromal schizophrenia. Biol Psychiatry. 2006;59(9):863–871. doi: 10.1016/j.biopsych.2005.09.005. [DOI] [PubMed] [Google Scholar]
- 22.Seidman LJ, Giuliano AJ, Meyer EC, et al. Neuropsychology of the prodrome to psychosis in the NAPLS consortium: relationship to family history and conversion to psychosis. Arch Gen Psychiatry. 2010;67(6):578–588. doi: 10.1001/archgenpsychiatry.2010.66. [DOI] [PMC free article] [PubMed] [Google Scholar]
- 23.Frommann I, Pukrop R, Brinkmeyer J, et al. Neuropsychological profiles in different at-risk states of psychosis: executive control impairment in the early–and additional memory dysfunction in the late–prodromal state. Schizophr Bull. 2010;37(4):861–873. doi: 10.1093/schbul/sbp155. [DOI] [PMC free article] [PubMed] [Google Scholar]
- 24.Michel C, Ruhrmann S, Schimmelmann BG, Klosterkotter J, Schulze-Lutter F. A stratified model for psychosis prediction in clinical practice. Schizophr Bull. 2014;40(6):1533–1542. doi: 10.1093/schbul/sbu025. [DOI] [PMC free article] [PubMed] [Google Scholar]
- 25.Nuechterlein KH, Dawson ME. Information processing and attentional functioning in the developmental course of schizophrenia disorders. Schizophr Bull. 1984;10(2):160–203. doi: 10.1093/schbul/10.2.160. [DOI] [PubMed] [Google Scholar]
- 26.Cornblatt BA, Keilp JG. Impaired attention, genetics and the pathophysiology of schizophrenia. Schizophr Bull. 1994;20:31–46. doi: 10.1093/schbul/20.1.31. [DOI] [PubMed] [Google Scholar]
- 27.Park S, Holzman PS. Schizophrenics show spatial working memory deficits. Arch Gen Psychiatry. 1992;49:975–982. doi: 10.1001/archpsyc.1992.01820120063009. [DOI] [PubMed] [Google Scholar]
- 28.Park S, Gooding DC. Working memory impairment as an endophenotypic marker of a schizophrenia diathesis. Schizophr Res Cogn. 2014;1(3):127–136. doi: 10.1016/j.scog.2014.09.005. [DOI] [PMC free article] [PubMed] [Google Scholar]
- 29.Tamminga CA, Stan AD, Wagner AD. The hippocampal formation in schizophrenia. Am J Psychiatry. 2010;167:1178–1193. doi: 10.1176/appi.ajp.2010.09081187. [DOI] [PubMed] [Google Scholar]
- 30.Saykin AJ, Shtasel DL, Gur RE, et al. Neuropsychological deficits in neuroleptic naive patients with first-episode schizophrenia. Arch Gen Psychiatry. 1994;51(2):124–131. doi: 10.1001/archpsyc.1994.03950020048005. [DOI] [PubMed] [Google Scholar]
- 31.Aleman A, Hijman R, de Haan EHF, Kahn RS. Memory impairment in schizophrenia: a meta-analysis. Am J Psychiatry. 1999;156:1358–1366. doi: 10.1176/ajp.156.9.1358. [DOI] [PubMed] [Google Scholar]
- 32.Brewer WJ, Wood SJ, McGorry PD, et al. Impairment of olfactory identification ability in individuals at ultra-high risk for psychosis who later develop schizophrenia. Am J Psychiatry. 2003;160(10):1790–1794. doi: 10.1176/appi.ajp.160.10.1790. [DOI] [PubMed] [Google Scholar]
- 33.Turetsky BI, Kamath V, Calkins ME, et al. Olfaction and schizophrenia clinical risk status: just the facts. Schizophr Res. 2012;139:260–261. doi: 10.1016/j.schres.2012.04.016. [DOI] [PMC free article] [PubMed] [Google Scholar]
- 34.Dickinson D, Ramsey ME, Gold JM. Overlooking the obvious: a meta-analytic comparison of digit symbol coding tasks and other cognitive measures in schizophrenia. Arch Gen Psychiatry. 2007;64(5):532–542. doi: 10.1001/archpsyc.64.5.532. [DOI] [PubMed] [Google Scholar]
- 35.Schaefer J, Giangrande E, Weinberger DR, Dickinson D. The global cognitive impairment in schizophrenia: consistent over decades and around the world. Schizophr Res. 2013;150(1):42–50. doi: 10.1016/j.schres.2013.07.009. [DOI] [PMC free article] [PubMed] [Google Scholar]
- 36.Woodberry KA, Seidman LJ, Giuliano AJ, Verdi MB, Cook WL, McFarlane WR. Neuropsychological profiles in individuals at clinical high risk for psychosis: relationship to psychosis and intelligence. Schizophr Res. 2010;123:188–198. doi: 10.1016/j.schres.2010.06.021. [DOI] [PMC free article] [PubMed] [Google Scholar]
- 37.Woods SW, Addington J, Bearden CE, et al. Psychotropic medication use in youth at high risk for psychosis: comparison of baseline data from two research cohorts 1998–2005 and 2008–2011. Schizophr Res. 2013;148(1–3):99–104. doi: 10.1016/j.schres.2013.05.019. [DOI] [PMC free article] [PubMed] [Google Scholar]
- 38.McGrath LM, Braaten EB, Doty ND, et al. Extending the ‘cross-disorder’ relevance of executive functions to dimensional neuropsychiatric traits in youth. [published online September 28, 2015] J Child Psychol Psychiatry. doi: 10.1111/jcpp.12463. [DOI] [PMC free article] [PubMed] [Google Scholar]
- 39.Hill SK, Reilly JL, Keefe RSE, et al. Neuropsychological impairments in schizophrenia and psychotic bipolar disorder: findings from the Bipolar-Schizophrenia Network on Intermediate Phenotypes (B-SNIP) Study. Am J Psychiatry. 2013;170:1275–1284. doi: 10.1176/appi.ajp.2013.12101298. [DOI] [PMC free article] [PubMed] [Google Scholar]
- 40.Keefe RSE, Perkins DO, Gu H, Zipursky RB, Christensen BK, Lieberman JA. A longitudinal study of neurocognitive function in individuals at-risk for psychosis. Schizophr Res. 2006;88:26–35. doi: 10.1016/j.schres.2006.06.041. [DOI] [PubMed] [Google Scholar]
- 41.Riecher-Rossler A, Pflueger MO, Aston J, et al. Efficacy of using cognitive status in predicting psychosis: a 7-year follow-up. Biol Psychiatry. 2009;66:1023–1030. doi: 10.1016/j.biopsych.2009.07.020. [DOI] [PubMed] [Google Scholar]
- 42.Addington J, Cadenhead KS, Cornblatt BA, et al. North American Prodrome Longitudinal Study (NAPLS 2): overview and recruitment. Schizophr Res. 2012;142(1–3):77–82. doi: 10.1016/j.schres.2012.09.012. [DOI] [PMC free article] [PubMed] [Google Scholar]
- 43.Addington J, Liu L, Buchy L, Cadenhead KS, et al. North American Prodrome Longitudinal Study (NAPLS 2): the prodromal symptoms. J Nerv Ment Dis. 2015;203:328–335. doi: 10.1097/NMD.0000000000000290. [DOI] [PMC free article] [PubMed] [Google Scholar]
- 44.Spitzer RL, Williams JB, Gibbon M. Instruction Manual for the Structured Clinical Interview for DSM-IV. New York, NY: Biometrics Research Dept, New York State Psychiatric Institute; 1994. [Google Scholar]
- 45.Cannon TD, Yu C, Addington J, Bearden CE, Cadenhead KS, Cornblatt BA, Heinssen R, Jeffries CD, Mathalon DH, McGlashan TH, Perkins DO, Seidman LJ, Tsuang MT, Walker EF, Woods SW, Kattan M. An individualized risk calculator for psychosis. Am J Psychiatry. 2016 doi: 10.1176/appi.ajp.2016.15070890. [DOI] [PMC free article] [PubMed] [Google Scholar]
- 46.Drake RE, Mueser K, McHugo G. Clinical Rating Scales. In: Sederer L, Dickey B, editors. Outcomes assessment in clinical practice. Williams and Wilkins; Baltimore: 1996. pp. 113–116. [Google Scholar]
- 47.Addington D, Addington J, Maticka-Tyndale E. Assessing depression in schizophrenia: the Calgary depression scale. Br J Psychiatry. 1993;163(Suppl 22):39–44. [PubMed] [Google Scholar]
- 48.Addington J, Shah H, Liu L, Addington D. Reliability and validity of the Calgary depression scale for schizophrenia (CDSS) in youth at clinical high risk for psychosis. Schizophr Res. 2014;153(0):64–67. doi: 10.1016/j.schres.2013.12.014. [DOI] [PMC free article] [PubMed] [Google Scholar]
- 49.Nuechterlein KH, Green MF. MATRICS Consensus Cognitive Battery. Los Angeles, CA: MATRICS Assessment, Inc; 2006. [Google Scholar]
- 50.Nuechterlein KH, Green MF, Kern RS, et al. The MATRICS Consensus Cognitive Battery, part 1: test selection, reliability, and validity. Am J Psychiatry. 2008;165:203–213. doi: 10.1176/appi.ajp.2007.07010042. [DOI] [PubMed] [Google Scholar]
- 51.Kern RS, Nuechterlein KH, Green MF, et al. The MATRICS Consensus Cognitive Battery, part 2: co-norming and standardization. Am J Psychiatry. 2008;165:214–220. doi: 10.1176/appi.ajp.2007.07010043. [DOI] [PubMed] [Google Scholar]
- 52.McCleery A, Green MF, Hellemann GS, et al. Latent structure of cognition in schizophrenia: a confirmatory factor analysis of the MATRICS Consensus Cognitive Battery (MCCB) Psychol Med. 2015;45:2657–2666. doi: 10.1017/S0033291715000641. [DOI] [PMC free article] [PubMed] [Google Scholar]
- 53.Wechsler D. WASI Manual. San Antonio, CA: The Psychological Corporation, Harcourt Brace & Company; 1999. [Google Scholar]
- 54.Wilkinson GS, Robertson GJ. The Wide Range Achievement Test Administration Manual. Fourth. Wilmington, DE: Wide Range, Inc; 2006. [Google Scholar]
- 55.Hoffman R, Woods S, Hawkins K, et al. Extracting spurious messages from noise and risk of schizophrenia-spectrum disorders in a prodromal population. Br J Psychiatry. 2007;191(4):355–356. doi: 10.1192/bjp.bp.106.031195. [DOI] [PubMed] [Google Scholar]
- 56.Doty RL. The Smell Identification Test ™ Administration Manual. 3rd. Haddon Heights, NJ: Sensonics, Inc; 1995. [Google Scholar]
- 57.Jacobson S, van Erp TG, Karlsgodt K, Torre J, Bearden CE, Cannon TD. Reduced temporo-limbic engagement during encoding of word pairs in an associative memory task in the psychosis prodrome: Baseline fMRI findings from the North American Prodrome Longitudinal Study (NAPLS). Presented at the 13th International Congress on Schizophrenia Research (IC0SR) APR; 02-06, 2011; Colorado Springs, CO.. [Google Scholar]
- 58.Seidman LJ, Breiter H, Goodman JM, et al. A functional magnetic resonance imaging study of auditory vigilance with low and high information processing demands. Neuropsychology. 1998;12:505–518. doi: 10.1037//0894-4105.12.4.505. [DOI] [PubMed] [Google Scholar]
- 59.Seidman LJ, Meyer EC, Giuliano AJ, et al. Auditory working memory impairments in individuals at familial high risk for schizophrenia. Neuropsychology. 2012;26:288–303. doi: 10.1037/a0027970. [DOI] [PMC free article] [PubMed] [Google Scholar]
- 60.Huang S, Seidman LJ, Rossi S, Ahveninen J. Distinct cortical networks activated by auditory attention and working memory load. Neuroimage. 2013;83:1098–1108. doi: 10.1016/j.neuroimage.2013.07.074. [DOI] [PMC free article] [PubMed] [Google Scholar]
- 61.Schafer JL, Olsen MK. Multiple imputation for multivariate missing-data problems: A data analyst’s perspective. Multivariate Behavioral Research. 1998;33:545–571. doi: 10.1207/s15327906mbr3304_5. [DOI] [PubMed] [Google Scholar]
- 62.Rubin DB. Multiple imputation after 18+ years. Journal of the American Statistical Association. 1996;91:473–489. [Google Scholar]
- 63.IBM Corp. IBM SPSS Statistics for Windows, Version 23.0. Armonk, NY: p. 2014. Released. [Google Scholar]
- 64.Cannon TD, Cadenhead KS, Cornblatt B, Woods SW, Addington J, Walker EF, Seidman LJ, Perkins DO, Tsuang MT, McGlashan TH, Heinssen R. Prediction of psychosis in youth at high clinical risk: A multi-site longitudinal study in North America. Arch Gen Psychiatry. 2008;65:28–37. doi: 10.1001/archgenpsychiatry.2007.3. [DOI] [PMC free article] [PubMed] [Google Scholar]
- 65.Seidman LJ. Neuropsychological function in people with ADHD across the lifespan. Clin Psychol Rev. 2006;26:466–485. doi: 10.1016/j.cpr.2006.01.004. [DOI] [PubMed] [Google Scholar]
- 66.Cirillo MA, Seidman LJ. Verbal declarative memory dysfunction in schizophrenia: from clinical assessment to genetics and brain mechanisms. Neuropsychol Rev. 2003;13(2):43–77. doi: 10.1023/a:1023870821631. [DOI] [PubMed] [Google Scholar]
- 67.Carrion R, Cornblatt BA, Burton CZ, Tso IF, Auther A, Adelsheim A, Calkins R, Carter CS, Niendam T, Taylory SF, McFarlane WR. Personalized prediction of psychosis: External validation of the NAPLS2 psychosis risk calculator with the EDIPPP project. Am J Psychiatry. 2016 doi: 10.1176/appi.ajp.2016.15121565. [DOI] [PMC free article] [PubMed] [Google Scholar]
- 68.Gold JM, Barch DM, Carter CS, et al. Clinical, functional and inter-task correlations of measures developed by the Cognitive Neuroscience Test Reliability and Clinical Applications for Schizophrenia Consortium. Schizophr Bull. 2012;38(1):144–152. doi: 10.1093/schbul/sbr142. [DOI] [PMC free article] [PubMed] [Google Scholar]
- 69.Keshavan MS, Vinogradov S, Rumsey J, Sherrill J, Wagner A. Cognitive training in mental disorders: update and future directions. Am J Psychiatry. 2014;171(5):510–522. doi: 10.1176/appi.ajp.2013.13081075. [DOI] [PMC free article] [PubMed] [Google Scholar]
- 70.Rauchensteiner S, Kawohl W, Ozgurdal S, et al. Test-performance after cognitive training in persons at risk mental state of schizophrenia and patients with schizophrenia. Psychiatry Res. 2011;185(3):334–339. doi: 10.1016/j.psychres.2009.09.003. [DOI] [PubMed] [Google Scholar]
- 71.Holzer L, Urben S, Passini CM, et al. A randomized controlled trial of the effectiveness of computer-assisted cognitive remediation (CACR) in adolescents with psychosis or at high risk of psychosis. Behav Cogn Psychother. 2014;42(4):421–434. doi: 10.1017/S1352465813000313. [DOI] [PubMed] [Google Scholar]
- 72.Hooker CI, Carol EE, Eisenstein TJ, et al. A pilot study of cognitive training in clinical high risk for psychosis: initial evidence of cognitive benefit. Schizophr Res. 2014;157(1–3):314–316. doi: 10.1016/j.schres.2014.05.034. [DOI] [PMC free article] [PubMed] [Google Scholar]
- 73.Piskulic D, Barbato M, Liu L, Addington J. Pilot study of cognitive remediation therapy on cognition in young people at clinical high risk of psychosis. Psychiatry Res. 2015;225(1–2):93–98. doi: 10.1016/j.psychres.2014.10.021. [DOI] [PubMed] [Google Scholar]
Associated Data
This section collects any data citations, data availability statements, or supplementary materials included in this article.