

Abstract
Recently a system was developed in which transplanted donor spermatogonial stem cells establish complete spermatogenesis in the testes of an infertile recipient. To obtain insight into stem cell activity and the behavior of donor germ cells, the pattern and kinetics of mouse spermatogonial colonization in recipient seminiferous tubules were analyzed during the 4 mo following transplantation. The colonization process can be divided into three continuous phases. First, during the initial week, transplanted cells were randomly distributed throughout the tubules, and a small number reached the basement membrane. Second, from 1 wk to 1 mo, donor cells on the basement membrane divided and formed a monolayer network. Third, beginning at about 1 mo and continuing throughout the observation period, cells in the center of the network differentiated extensively and established a colony of spermatogenesis, which expanded laterally by repeating phase two and then three. An average of 19 donor cell-derived colonies developed from 106 cells transplanted to the seminiferous tubules of a recipient testis; the number of colonized sites did not change between 1 and 4 mo. However, the length of the colonies increased from 0.73 to 5.78 mm between 1 and 4 mo. These experiments establish the feasibility of studying in a systematic and quantitative manner the pattern and kinetics of the colonization process. Using spermatogonial transplantation as a functional assay, it should be possible to assess the effects of various treatments on stem cells and on recipient seminiferous tubules to provide unique insight into the process of spermatogenesis.
Introduction
In the adult body of mammals, several self-renewing systems exist, including hematopoiesis, spermatogenesis, intestinal epithelium, and skin [1]. While all are important, none is more essential to species continuation than spermatogenesis, because it is responsible for generation of the male gamete and contributes to the genetic diversity necessary for evolution. Because of its importance, the process of spermatogenesis has been well characterized morphologically [2–4]. For many species, including primates, the precise cellular association of germ cells with supporting somatic Sertoli cells during differentiation in the seminiferous tubules has been identified [5–7]. These associations serve as the basis for classification of characteristic stages of spermatogenesis in seminiferous tubules of a species, and cell associations at any position in the tubule repeat at specific time intervals [8]. The precise and repeating morphological relationships among the cells result from exact timing of cell replication and differentiation events within the transit or differentiating cell population of spermatogenesis. In the rat, there are 10 mitotic and 2 meiotic divisions from the time a stem cell begins on the differentiation pathway until a spermatozoon is formed [4, 7]. According to Huckins and Oakberg [9], the spermatogonial stem cell is the most primitive form of undifferentiated type A spermatogonia and is designated single (As) or isolated (Ais). Type As spermatogonia develop sequentially into paired (Apr) and aligned (Aal) type A spermatogonia, which are connected by intercellular bridges because of incomplete cytokinesis. Type Apr and Aal spermatogonia are thought to be already committed to differentiation and belong to the amplifying compartment of spermatogenesis [9, 10]. Whether any spermatogonia other than type As can act as stem cells is unclear, because the above classification is based on morphological criteria. Stem cells are functionally defined by the ability to both self-renew and provide progeny for differentiation, and an appropriate assay system to identify these parameters has not been previously available.
While the cell morphology of these primitive stages of spermatogonia during the first four to eight divisions and their location on the basement membrane of the seminiferous tubule among Sertoli cells are well characterized, the pattern and kinetics of their expansion have been difficult to establish. In several species, irradiation or chemotherapeutic agents have been employed to destroy all stages of spermatogenesis except stem cells, which are known to be resistant to noxious agents [11–13]. The recolonization of the seminiferous tubule basement membrane by primitive spermatogonia is then monitored by whole mounts or serial-sectioning the testes at specific time intervals following irradiation and examining microscopically the germ cell expansion from stem cell activity. These extensive, laborious, and detailed studies have provided considerable information but suffer from important disadvantages. First, the degree of damage to the stem cells and seminiferous tubule by irradiation or chemotherapeutic agents is unknown and may affect the recolonization process [11, 13]. Second, the microscopic analysis is laborious, and it is difficult to reconstruct the multidimensional aspect of the recolonization process as spermatogenesis is reestablished over the course of several months [14, 15]. If the repopulating germ cells could be identified by a simple marker, analysis would be facilitated and improved.
Recently, a method for transplanting mouse spermatogonial stem cells from a fertile testis to the seminiferous tubules of an infertile testis has been described, and the donor cells generate spermatogenesis in the recipient testis [16]. Recipient males can become fertile and produce progeny with donor cell haplotype [17]. In addition, the donor cell-derived spermatogenesis in recipient testes lasts throughout the life of the mouse and has the structure and stages characteristic of spermatogenesis in the mouse [18]. Only stem cells can produce this result. Thus, the regeneration of spermatogenesis in recipient testes provides an opportunity to study stem cell repopulation of seminiferous tubules in a unique manner. By using transgenically marked donor cells, the pattern and kinetics of the repopulation process can be determined and the three-dimensional architecture of reconstruction followed.
Materials and Methods
Donor Cells
Cells for transplantation were obtained from the transgenic mouse line B6,129-TgR(ROSA26)26SOR, from The Jackson Laboratory (Bar Harbor, ME), designated ROSA26. The mice were maintained on a C57BL/6 × 129/ Sv genetic background and contain the Escherichia coli LacZ structural gene. Many cell types express the trans-gene, produce β-galactosidase, and can be stained blue with 5-bromo-4-chloro-3-indolyl β-d-galactoside (X-gal) [19]. In adult testes, all stages of germ cell differentiation stain blue, and in neonatal testes it is clear that the stem cells stain intensely blue [20]; therefore, donor-derived stem cells and differentiating germ cells can be readily identified in nontransgenic recipient mice. Cells for transplantation were obtained from 4- to 6-wk-old mice and prepared using a two-step digestion procedure to produce a suspension of testis cells [17, 21]. Donor cells were suspended in Dulbecco's Modified Eagle's medium containing 0.5 mM pyruvate, 6 mM lactate, 6 mM L-glutamine, 30 μg/ml penicillin, 50 μg/ml streptomycin, 10% fetal bovine serum, 1000 U/ml leukemia inhibitory factor, and 10 ng/ml basic fibroblast growth factor [22]. The cell suspension at a concentration of 108 cells/ml was microinjected into the efferent ducts of recipient testes and flowed through the rete testis to fill the seminiferous tubules. A volume of 10 μl can be injected into the tubules of a busulfan-treated mouse, about 106 cells [23]. Approximately 80–90% of the tubules were filled by the cell suspension using this technique [17, 23].
Recipient Mice
To provide immunologically compatible recipient testes, C57BL/6 × 129/Sv F1 (B6/129) hybrid mice were generated, and the males were treated with busulfan (50 mg/kg BW) at 4–6 wk of age [16, 17]. This treatment destroys endogenous spermatogenesis, and recipient seminiferous tubules contain primarily Sertoli cells [16, 24]. Donor cells were transplanted four or more weeks after busulfan treatment. Some recipient males also carried alleles for S1/+, W/+, or Sl/W on the B6/129 background [25]. However, these alleles did not influence colony number or length, and, therefore, results from all recipients were pooled. All experimental procedures were approved by the Animal Care and Use Committee at the University of Pennsylvania.
Analysis of Recipient Testes
At specific times after donor cell transplantation, recipient mice were killed, and the testes were recovered for analysis. In order to count colony number and determine length of each colony, the tunica was removed from each testis, and the seminiferous tubules were dissected apart using fine forceps. The dispersed tubules were fixed for 2 h in 4% paraformaldehyde at 4°C and washed in buffer [17, 23]. The seminiferous tubules were then incubated for 10-16 h with X-gal to identify areas of donor cell colonization. The number of colonies was counted for each testis, and the length of each colony was measured with an eyepiece micrometer using a stereomicroscope (magnification ×50). After colony analysis, the seminiferous tubules were processed for histological sections. Images of seminiferous tubules and histological sections were collected in a computer imaging system (Phase 3 Imaging Systems, Glen Mills, PA). ANOVA and Tukey's HSD multiple comparisons (Systat 7.0; SPSS Inc., Chicago, IL) were used to assess significance of differences.
Results
Pattern of Colony Formation
Recipient testes were examined at increasing time intervals after transplantation by dispersing the seminiferous tubules and incubating them in X-gal, which stained the donor cells blue and clearly distinguished them from recipient tissue. On Day 1 after transplantation, blue-stained donor cells were randomly distributed along recipient seminiferous tubules (Fig. 1, A and B). Mainly single cells were present, but doublets and groups of several cells could also be observed. Many cells were freely floating in the tubule lumen, because they readily changed position when pressure was applied to the tubule. However, the majority of donor cells were not easily displaced and appeared to be already adhering to Sertoli cells. Most of these adherent cells had not reached the basement membrane: a space between the blue donor cells and the basement membrane could be identified by moving the tubule and changing the microscopic focal plane. Histologic analysis also showed blue cells primarily in the center of the tubule (Fig. 2A). In contrast, at 0 and 4 h after transplantation, all donor cells appeared to be floating freely in the lumen of the tubule (data not shown). Therefore, during the first day after transplantation, most donor cells adhered to Sertoli cells but few had reached the basement membrane of the tubule.
Fig. 1.
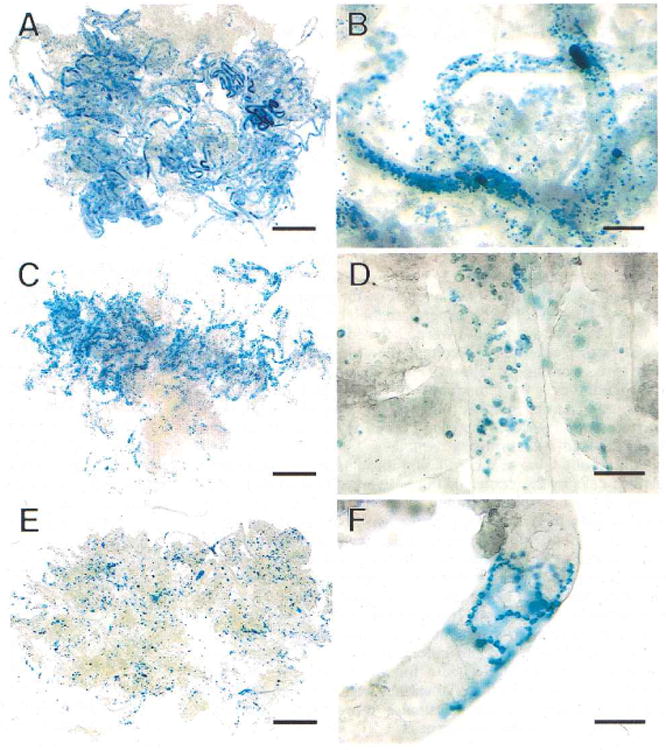
Colonization of recipient mouse seminiferous tubules by transgenic donor testis cells (stained blue) at intervals up to 2 wk post-transplantation. A) One day after transplantation, blue donor cells are widely dispersed in recipient tubules. B) Cells are primarily single or in small groups at one day after transplantation. C) One week after transplantation, blue cells are still spread throughout tubules, but small clusters of cells can be seen. D) These small clusters of cells at 1 wk represent the beginning of chains of spermatogonia. E) Two weeks after transplantation, small groups of cells can be seen at low magnification. F) These groups of cells at 2 wk represent chains of cells rapidly spreading and branching on the basement membrane. Stain, X-gal. Scale bars are 2 mm in A, C, E; 200 μm in B; and 100 μm in D and F.
Fig. 2.
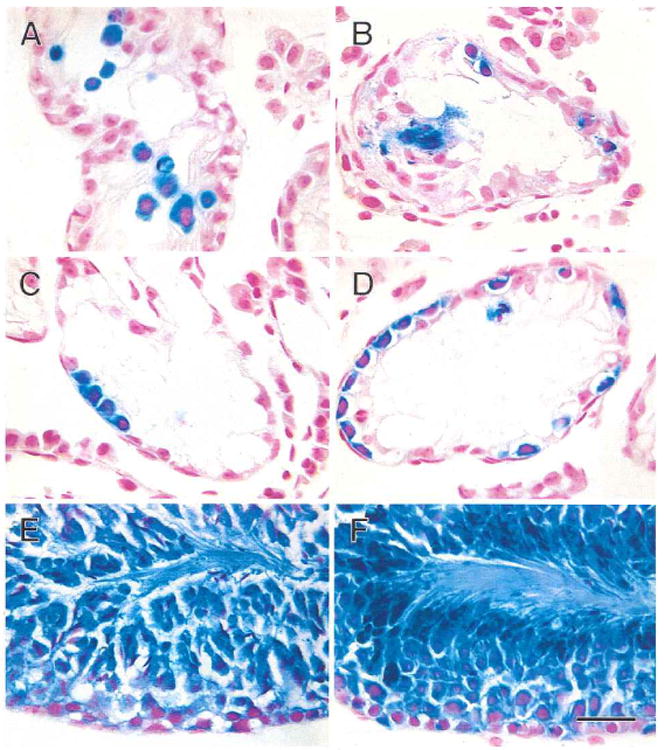
Transgenic donor cells (stained blue) in recipient mouse seminiferous tubules following transplantation. A) One day after transplantation, blue donor cells are widely scattered in the central area of the tubule. B) One week after transplantation, some donor cells have reached the basement membrane and are dividing. C) Two weeks after transplantation, blue donor cells on the basement membrane of the tubule are forming chains of spermatogonia. D) One month after transplantation, many blue cells are found on the basement membrane in the areas of colonization. E) Two months after transplantation, spermatogenesis has been established in the central areas of colonies. F) Three months after transplantation, spermatogenesis is well organized in the dark blue areas of the colonies. Stain, X-gal and nuclear fast red. Scale bar = 30 μm.
One week after transplantation, donor cells remained randomly dispersed along the recipient seminiferous tubules (Fig. 1C), and individual cells could be more easily visualized than on Day 1. In addition, the number of donor cells was reduced. These changes probably reflected removal of cells and debris by the flow of seminiferous tubule fluid as well as by phagocytic activity of Sertoli cells. Many donor cells were still adherent to Sertoli cells; however, some cells were now observed on the basement membrane, which could be readily determined by moving the tubule and changing the focal plane. Histological evaluation confirmed this observation (Fig. 2B). These latter cells were single or had begun to divide and form doublets or short chains connected by cytoplasmic bridges (Figs. 1D and 2B). The longest chain observed at 1 wk consisted of five cells on the basement membrane. Spermatogonial spreading on the basement membrane could be observed more readily at 2 wk after transplantation, because at that time the chain formation was more extensive and elaborate than at 1 wk (Fig. 1, E and F; Fig. 2C). In many instances, branching of the chains could be observed, and more than one chain was often found in an area of a tubule.
By 1 mo after transplantation, few individual cells or even short chains could be identified between colonies. As a result, the tubule segments occupied by blue cells were clearly recognized and were separated by lengths of relatively clear tubule (Fig. 3, A and B). At this time, the donor cell chains had expanded on the basement membrane in a two-dimensional monolayer, forming networks or “patches” of blue cells, and the cells were resting on the basement membrane (Fig. 2D). A network or patch was defined as a colony when it occupied more than 50% of the basal surface of the tubule and was at least 0.1 mm in length, because groups of cells of this size could be reliably identified. The majority of surviving cells at 1 mo were in colonies. In addition, 5 of the 237 colonies identified at 1 mo showed staining that indicated more than one layer of donor cells. Each of these 5 colonies had reached at least 1 mm in length, and multiple layers of donor cells were limited to the center of the blue segment (not shown).
Fig. 3.
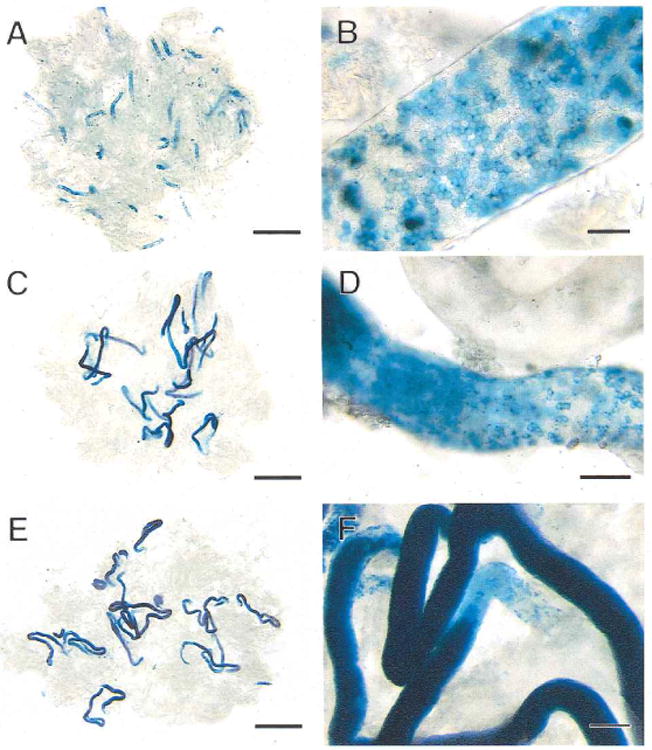
Colonization of recipient mouse seminiferous tubules by donor cells from the first to third month after transplantation. A) One month after transplantation, extensive blue areas are present in the tubules representing areas of germ cell colonization. B) These blue areas of colonization at 1 mo are composed of cellular chains and a network of cells on the basement membrane of the tubule. C) Two months after transplantation, the blue areas are dark in the center, indicating multiple layers of germ cells and development of spermatogenesis. D) The ends of the colonies at 2 mo consist of a network of cells on the basement membrane comparable to early stages of colonization. E) Three months after transplantation, the structure of the colonies is similar to that found at 2 mo, but each colony is longer. F) The intense blue color in the center of each colony at 3 mo represents complete spermatogenesis. The network of cells at the end of the colony, where colony extension is still continuing, is pale blue. Stain, X-gal. Scale bars are 2 mm in A, C, E; 50 μm in B; 100 μm in D; and 200 μm in F.
By 2 mo after transplantation, most colonies were well established and appeared as distinctive blue segments (Fig. 3, C and D). In contrast to the colonies at 1 mo, most colonies at 2 mo had a long dark blue stretch of completely filled segment with two or more layers of cells (Fig. 2E). Colonies generally had a weakly stained region at both ends, but occasionally staining ended more abruptly. Under higher magnification (Fig. 3D), these pale blue portions were found to be composed of single, paired, or small groups of cells forming a network on the basement membrane as seen in the samples at 1-2 wk following transplantation (Fig. 1, D and F). This suggests that the colonies were still growing at their extremities, repeating the same process observed in initial colony formation. At the same time, the spermatogenic differentiation process was in progress in the center of the colonies, as qualitatively complete spermatogenesis was observed in histological sections (Fig. 2E). In some parts of recipient testes, colonies were occasionally found aligned tandemly with weak blue or small, unstained white segments in between. This suggests that colonies derived from spermatogonial stem cells that were closely seeded at the time of transplantation could merge and form a long stretch of colonization. In the recipient testes at 3 and 4 mo after transplantation, the colonies were completely filled with blue cells (Fig. 2F), from the basement membrane to the lumen, along almost the entire length (Fig. 3, E and F). The appearance of colonies was similar at 2 and 4 mo, but the length increased with time. Even at 4 mo, the colonies had weakly stained portions at their ends, suggesting ongoing expansion. From 2 mo through 4 mo after transplantation, dispersed cells and patch structures were rarely observed in the area of recipient testes between the distinctive colonies.
Kinetics of Colony Formation
During the first 2 wk after transplantation, only patches of dividing spermatogonia could be observed as the potential beginning of colonies, and it was not always possible to verify these patches as potential colonies. Definite colonies could be first distinguished at about 1 mo after donor cell transplantation, and the length of individual colonies could be accurately determined. Measurements were then made at 1, 2, 3, and 4 mo to assess the rate of expansion (Fig. 4). During this period, the average colony length increased from 0.73 mm to 5.78 mm. The increase in colony length was significant for each 30-day period, and a linear regression calculated for the data intersected the abscissa at approximately 20 days. At each time point, there was considerable variation in colony length, but the coefficients of variation did not increase as the colonies became larger. The rate of increase was 24 μm/day for the first month and then increased to 44 μm/day, 69 μm/day, and 55 μm/day for the second, third, and fourth months, respectively. The lower rate of increase in colony length during the first month and the regression line intersect suggest that the initial events in colony formation were different from later expansion.
Fig. 4.
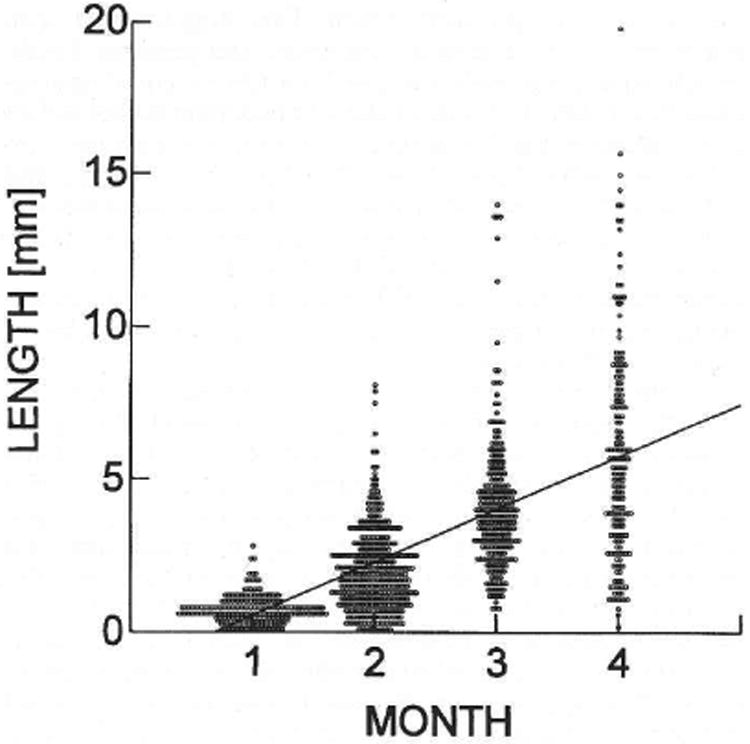
Length of donor cell-derived colonies of spermatogenesis in recipient seminiferous tubules. Each circle represents the measurement of an individual colony determined at the time indicated following cell transplantation. The average colony lengths in millimeters were 0.73 ± 0.03 (237), 2.05 ± 0.07 (367), 4.13 ± 0.14 (243), and 5.78 ± 0.27 (174) at 1, 2, 3, and 4 mo, respectively. Values are mean ± SEM (number of colonies measured). The increase in length at each month was significant (p < 0.001), and the regression line has the equation y = 1.73x − 1.188.
The number of donor cell-derived colonies found in each testis was also determined at monthly intervals and ranged from 2 to 56 (Fig. 5). There was variation in the number of colonies per testis at each of the monthly assay points, and the average number of colonies was 19.8, 24.5, 20.3, and 12.4 at 1, 2, 3, and 4 mo, respectively. No significant difference in colony number per testis was found during the period from 1 to 4 mo. The decrease in colony number observed at 4 mo could reflect the merging of adjacent colonies as described in the previous section. The ends of colonies appeared similar at 3 and 4 mo (see above), suggesting continuing growth, and our length measurements (Fig. 4) confirm this observation. Thus, the overall mean colony number for the 4-mo period was 19.3 ± 3.1 (mean ± SEM), which was not significantly altered from that at the time colonies could first be clearly identified at 1 mo.
Fig. 5.
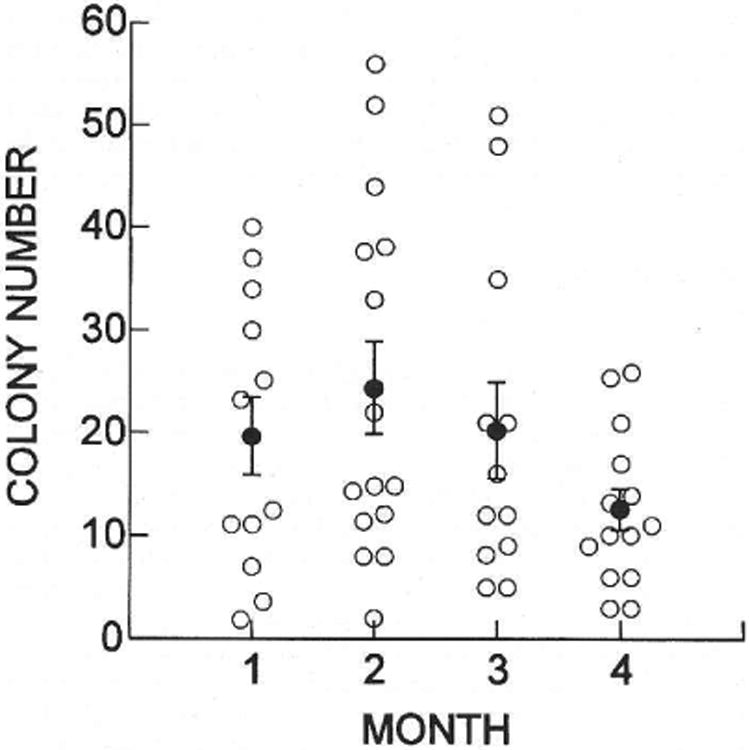
Number of donor cell-derived colonies of spermatogenesis in recipient testes. Open circles represent the number of colonies in a single testis determined at the time indicated after cell transplantation. The average numbers of colonies (filled circles) were 19.8 ± 3.9 (12), 24.5 ± 4.5 (15), 20.3 ± 4.6 (12), and 12.4 ± 2.0 (14) at 1, 2, 3, and 4 mo, respectively. Values are mean ± SEM (number of testes examined). There was no significant difference in the number of colonies present in recipient testes during the 4 mo of observation (ANOVA).
To determine whether the number of colonies in a testis influenced the length of individual colonies, a regression analysis of the data was performed. No significant correlation of colony length with colony number was found at any of the four monthly observation points nor for the pooled data representing 1021 colonies in 53 testes. Individual colonies increased in length at comparable rates regardless of the number of neighbors in the same testis, suggesting that low colony number in a testis was not the result of poor environment. On the basis of the absence of a correlation between colony number and length, the merging of colonies occasionally observed (see above) had a small and not significant effect on results (Figs. 4 and 5). In addition, there was no significant difference in colony number or colony length between right and left testes, nor was there a significant effect of mouse on colony length at any of the time points, suggesting that colonization in individual testes is independent of mouse effect.
Discussion
Pattern of Colonization
The definitive blue staining of donor ROSA26 germ cells provides a dramatic and dynamic representation of stem cell colonization of recipient seminiferous tubules. The ability to study in detail the pattern and kinetics of colonization of a recipient environment by donor stem cells in a self-renewing system is unique to spermatogenesis. While several excellent techniques, such as spleen colony formation [26] and bone marrow competitive repopulation assays [27], exist in the hematopoietic system to assess functional capability of injected cells, they do not allow systematic observation or quantification of the pattern or kinetics of progressive expansion of stem cells and differentiated stages. In the testis cell transplantation system, putative donor germ cells can be identified by their cellular characteristics [18, 28] or transgene expression [16, 20]. In the former instance, morphology of the cell population can be determined by histological observations, similar to studies that follow irradiation or chemotherapeutic treatment [11, 15]. However, the pattern of expansion is difficult to assess in two and three dimensions. In contrast, transgenically marked germ cells are readily observed, and their three-dimensional reconstruction of spermatogenesis in the recipient seminiferous tubule can be visualized.
In the present study with transgenic donor cells, the colonization of recipient seminiferous tubules was observed to be a continuous process that can be divided into three overlapping or continuous phases. The initial phase takes place during the first week following transplantation. Within one day, many donor cells adhere to Sertoli cells and become relatively immobile. Ultrastructural analyses indicate that some transplanted germ cells establish contact with small processes of recipient Sertoli cells in less than 1 h (Parreira and Russell, personal communication). Movement of germ cells toward the basement membrane appears to begin immediately, but most stained cells were still in the lumen after 1 day. At 1 wk, donor cells were clearly present on the basement membrane. By the second week, donor cell proliferation on the basement membrane was extensive, and the histological (Fig. 2C) as well as whole-mount pattern (Fig. 1F) showed extensive cellular chains connected by intercellular bridges. Initially, these must represent chains of type Aal spermatogonia, but stem cell self-renewal also occurs to allow lateral spread of the colony. Late in the second phase, approximately 1 mo after transplantation, distinctive colonies can be seen as “patch” structures, most of which do not show a multiple layer structure. Therefore, extensive lateral expansion of the spermatogonial cell population along and around the recipient seminiferous tubule on the basement membrane occurs before there is significant differentiation of advanced stages of spermatogenesis. Also at 1 mo we observed, though very rarely, a small number of colonies (5 out of 237) with some staining in the adluminal compartment, indicating that differentiation could extend beyond the basal compartment of the seminiferous epithelium by this time. Interestingly, these colo- nies were all longer than 1 mm. This suggests that sper-matogonial stem cells must proliferate and generate daughter spermatogonia until the patch structures cover approximately a 1-mm segment of the seminiferous tubule before differentiation into the adluminal compartment occurs. Histological studies have shown that spermatocytes are first seen at about 1 mo after transplantation, indicating that differentiation begins 12–14 days after transplantation [28]. In the third phase of colonization, beginning at about 1 mo, differentiation of germ cells toward the center of the tubule occurs in all colonies and appears to keep pace with lateral expansion of the colony.
In order to accomplish long-term complete spermatogenesis, the stem cell must undergo self-renewal after transplantation. The proliferation profile of type As spermatogonia has been extensively studied in testes after irradiation [9, 12, 15]. Replication of spermatogonial stem cells begins within three days after irradiation, and the probability that the first division is self-renewal is close to 1.0 [29]. This probability is maintained at a high level, approximately 0.8. during the first week after irradiation, suggesting that active self-renewal division of stem cells and initiation of differentiation take place simultaneously late in the first week following irradiation [10, 29]. In fact, Apr and Aal spermatogonia are observed by five days after irradiation [9]. In our study, paired and short chains of donor cells, in addition to single cells, were observed on the basement membrane by 1 wk after transplantation. These results suggest that the self-renewal divisions of donor stem cells and the beginning of differentiation of donor stem cells initially proceed in a similar manner after transplantation and irradiation. However, the pattern of colony expansion after irradiation is difficult to follow for an extended period, whereas the extensive branching and cellular network that form the foundation of a colony of spermatogenesis can clearly be identified after transplantation and recolonization by transgenically marked donor cells. Furthermore, the extent of seminiferous tubule recolonization after irradiation declines with increasing levels of irradiation, and some areas of spermatogonial recolonization fail to differentiate [12, 14, 15]. In spermatogonial transplantation, the recipient tubules are exposed to busulfan, but more than 4 wk elapses before donor stem cells are introduced. Thus, because the stem cells or tubule environment may be damaged by irradiation, subsequent recolonization could provide only a partial representation of the process by which stem cells can repopulate a seminiferous tubule and generate spermatogenesis. Recolonization after irradiation may differ from recolonization after stem cell transplantation.
Kinetics of Colonization
After transplantation of donor cells, the Sertoli cell layer appears to act as a barrier and sorting mechanism, because most cells remain in the intraluminal compartment of the seminiferous tubules, with many cells eventually adhering to Sertoli cell membranes. Parreira et al. [28] suggested that many of these cells are phagocytized by Sertoli cells. Some transplanted cells move into the epithelium and lie between Sertoli cells, and a smaller number reach the basement membrane. Among these cells on the basement membrane are the spermatogonial stem cells, which divide to generate chains of cells and eventually colonies. Although extension of the regression line of colony length to the abscissa suggests that the growth of colonies begins about 20 days after transplantation, it is more likely that the initial period of stem cell division and spermatogonial spread differs in kinetics from later colony expansion. The presence of doublets and short chains of cells on the basement membrane by the end of the first week suggests that donor spermatogonial stem cell division begins within the first few days after transplantation. Likewise, early division of cells on the basement membrane occurred after transplantation of C57BL/6 testis cells to W recipients [28].
The kinetics of cellular expansion during this early period of repopulation is unclear. In previous studies in which germ cells have been destroyed by irradiation or busulfan treatment, it was demonstrated that several days elapsed before stem cells began to divide, and the period of delay before differentiation was influenced by the level of damage, e.g., gray (Gy) of irradiation [11, 12]. Under these conditions, the first cellular divisions generate only new stem cells, after which some divisions are allocated to form undifferentiated type Apr and Aal spermatogonia. Thus, the initial stem cell expansion and the degree of commitment of cells to the differentiation pathway are likely to be variable and influenced by stem cell and seminiferous tubule conditions, and this may account for the slower colony growth (24 μm/day) in the first month after donor cell transplantation. In addition, during the initial period of colony expansion, spermatogonia proliferate circumferentially as well as along the tubule; therefore, length is likely to increase more slowly than when the colony completely fills the tubule. Thus, the initial formation of a colony consists of five processes: 1) migration of stem cells to the basement membrane; 2) proliferation of stem cells and primitive spermatogonia; 3) longitudinal and circumferential spread of germ cells; 4) longitudinal extension of colonies; and 5) vertical differentiation of germ cells in the center of colonies. The time necessary for the first three probably contributes to the slower initial increase in colony length.
One month after transplantation, when colonies were well established, the increase in length was relatively constant and averaged 56 μm/day. After fission neutron irradiation, the colony expansion rate was about 27 μm/day and linear for up to 20 wk [15]. The rate was about 20% lower at 350 rad (3.5 Gy), the highest level of irradiation, than at 300 rad (3.0 Gy) [15]. Perhaps Sertoli cells or germ cells within irradiated testes are compromised and therefore support a lower rate of colony development than seen after stem cell transplantation. As a result of the slower rate of growth in repopulating colonies following neutron irradiation, the length of colonies at 15 wk was only 3.42 ± 0.17 mm (mean ± SEM) and 2.87 ± 0.29 mm after 300 (3.0 Gy) and 350 (3.5 Gy) rads of fission neutron irradiation [14, 15], compared to 5.78 ± 0.27 mm 4 mo after donor cell transplantation (Fig. 4).
The range in colony length at 4 mo after both irradiation (0.5-7.5 mm) and testis cell transplantation (0.2–19.8 mm) was large, and the reasons for this are unclear. However, it has been postulated to result from differences in the times when individual stem cells initiate division, the ratio of stem cell renewal relative to differentiation divisions in each colony, and the degree of degeneration affecting different colonies [12, 15, 29]. Loss of individual layers or stages of differentiating germ cells in colonies repopulating the tubules has been observed after stem cell transplantation [18, 28]. These abnormalities are most often seen at early time points after colonization begins, and at the ends of colonies. Thus, during the colonization process, if a stem cell fails to divide or degenerates, an entire set of progeny may be absent, resulting in a missing layer in the differentiation order of spermatogenesis. This phenomenon may also reflect variability in the overall proliferative ability in the stem cells of different colonies, which could contribute to length differences in seminiferous tubule recolonization.
After donor cell transplantation, no significant change in the number of colonies occurred after the first month, indicating that stem cells do not lie dormant for an extended period in the recipient tubule before initiating division. Studies of seminiferous tubule repopulation following irradiation and busulfan treatment also indicate that competent stem cells begin colony formation soon after the destruction of differentiated germ cells [11, 12,29]. Higher levels of irradiation and doses of busulfan destroy more stem cells and decrease the number of colonies [11–13]. Each of the colonies that regenerate after irradiation or busulfan treatment can be shown to arise from individual stem cells [12, 13, 30]. In our experiments, the number of colonies observed in each testis was low, an average of 19 colonies. Since there is no reason to believe that one area of the recipient seminiferous tubules would be able to attract or concentrate donor stem cells, it is likely that the cells are scattered along the 750 or 1000 mm of seminiferous tubule that are present in an irradiated or normal mouse testis, respectively [14, 15]. Taking our observations together with those of others, it seems likely that most individual colonies observed in recipient testes arise from single donor cells. The injected testis cell suspension contained 108 cells/ml, and 10 μl of suspension can be injected into the seminiferous tubules of a busulfan-treated mouse [23]; therefore, approximately 106 cells were introduced into the tubule lumen. Since 104 testis cells are thought to contain about two stem cells [10], approximately 200 stem cells were introduced into the tubules, which produced 19 colonies. If these assumptions are correct, the current transplantation technique results in generation of a colony by about 10% of the stem cells.
Transplantation of transgenic donor cells to recipient testes has provided an opportunity to study both the pattern and kinetics of stem cell colonization of seminiferous tubules. In part, these studies have extended earlier observations on recolonization of testes following irradiation or other toxic treatments. However, transgenic donor stem cell colonization allowed a unique visualization of the three-dimensional pattern of germ cell spread and differentiation in recipient tubules. Furthermore, the kinetics of the colonization process are different after transplantation because the rate of expansion is greater and colonies become larger, suggesting that toxic treatments that destroy most germ cells may also considerably influence the recolonization process. It should be possible in future experiments to compare the effect of various treatments to stem cell populations or recipient tubules on the pattern and kinetics of the colonization process, thereby providing a powerful assay of stem cell potential or supporting environment suitability. The spermatogonial transplantation technique thus offers the first functional assay system for stem cells and their environments, and will provide a wide range of opportunities for studies on male germ cell biology.
Acknowledgments
We thank I. Dobrinski, T. Ogawa, K. Orwig, L. Russell, and T. Shi-nohara for comments and suggestions. We are also grateful to C. Freeman and R. Naroznowski for maintaining experimental animals, and to J. Hay-den for assistance with photography.
Footnotes
This research was supported by the National Institutes of Health (NICHD 36504), USDA/NRI Competitive Grants Program (95-37205-2353), Commonwealth and General Assembly of Pennsylvania, and the Robert J. Kleberg, Jr. and Helen C. Kleberg Foundation.
References
- 1.Potten CS. Cell lineages. In: McGee JO'D, Issacson PG, Wright NA, editors. Oxford Textbook of Pathology. Vol. 1. Oxford: Oxford University Press; 1992. pp. 43–52. [Google Scholar]
- 2.Huckins C. The spcrmatogonial stem cell population in adult rats. I. Their morphology, proliferation, and maturation. Anat Rec. 1971;169:533–558. doi: 10.1002/ar.1091690306. [DOI] [PubMed] [Google Scholar]
- 3.Clermont Y. Kinetics of spermatogenesis in mammals: seminiferous epithelium cycle and spermatogonial renewal. Physiol Rev. 1972;52:198–236. doi: 10.1152/physrev.1972.52.1.198. [DOI] [PubMed] [Google Scholar]
- 4.Russell LD, Ettlin RA, Sinha Hikim AP, Clcgg ED. Histological and Histopathological Evaluation of the Testis. Clearwater, FL: Cache River Press; 1990. pp. 1–40. [Google Scholar]
- 5.Dym M. The male reproductive system. In: Weiss L, editor. Histology: Cell and Tissue Biology. 5th. New York: Elsevier Science Publishing Co. Inc.; 1983. pp. 1000–1053. [Google Scholar]
- 6.Russell LD. Morphological and function evidence for Sertoli-germ cell relationships. In: Russell LD, Griswold MD, editors. The Sertoli Cell. Clearwater, FL: Cache River Press; 1993. pp. 365–390. [Google Scholar]
- 7.de Kretser DM, Kerr JB. The cytology of the testis. In: Knobil E, Neill JD, editors. The Physiology of Reproduction. 2nd. New York: Raven Press Ltd; 1994. pp. 1177–1290. [Google Scholar]
- 8.Leblond CP, Clermont Y. Definition of the stages of the cycle of the seminiferous epithelium in the rat. Ann N Y Acad Sci. 1952;55:548–573. doi: 10.1111/j.1749-6632.1952.tb26576.x. [DOI] [PubMed] [Google Scholar]
- 9.Huckins C, Oakberg EF. Morphological and quantitative analysis of spermatogonia in mouse testes using whole mounted seminiferous tubules. II. The irradiated testes. Anat Rec. 1978;192:529–542. doi: 10.1002/ar.1091920407. [DOI] [PubMed] [Google Scholar]
- 10.Meistrich ML, van Beek MEAB. Spermatogonial stem cells. In: Desjardins C, Ewing LL, editors. Cell and Molecular Biology of the Testis. New York: Oxford University Press; 1993. pp. 266–295. [Google Scholar]
- 11.van Keulen CJG, de Rooij DG. Spermatogenetic clones developing from repopulating stem cells surviving a high dose of an alkylating agent. Cell Tissue Kinet. 1975;8:543–551. doi: 10.1111/j.1365-2184.1975.tb01240.x. [DOI] [PubMed] [Google Scholar]
- 12.Meistrich ML, Hunter NR, Suzuki N, Trostle PK, Withers HR. Gradual regeneration of mouse testicular stem cells after exposure to ionizing radiation. Radiat Res. 1978;74:349–362. [PubMed] [Google Scholar]
- 13.van Beek MEAB, Davids JAG, de Rooij DG. Nonrandom distribution of mouse spermatogonial stem cells surviving fission neutron irradiation. Radiat Res. 1986;107:11–23. [PubMed] [Google Scholar]
- 14.van den Aardweg GJMJ, de Ruiter-Bootsma AL, Kramer MR. Growth of spermatogenetic colonies in the mouse testis after irradiation with fission neutrons. Radiat Res. 1982;89:150–165. [PubMed] [Google Scholar]
- 15.van den Aardweg GJMJ, de Ruiter-Bootsma AL, Kramer MF, Davids JAG. Growth and differentiation of spermatogenetic colonies in the mouse testis after irradiation with fission neutrons. Radiat Res. 1983;94:447–463. [PubMed] [Google Scholar]
- 16.Brinster RL, Zimmermann JW. Spermatogenesis following male germ cell transplantation. Proc Natl Acad Sci USA. 1994;91:11298–11302. doi: 10.1073/pnas.91.24.11298. [DOI] [PMC free article] [PubMed] [Google Scholar]
- 17.Brinster RL, Avarbock MR. Germline transmission of donor haplo-type following spermatogonial transplantation. Proc Natl Acad Sci USA. 1994;91:11303. doi: 10.1073/pnas.91.24.11303. [DOI] [PMC free article] [PubMed] [Google Scholar]
- 18.Russell LD, Franca LR, Brinster RL. Ultrastructural observations of spermatogenesis in mice resulting from transplantation of mouse spermatogonia. J Androl. 1996;17:603–614. [PubMed] [Google Scholar]
- 19.Zambrowicz BP, Imamoto A, Fiering S, Herzenberg LA, Kerr WG, Soriano P. Disruption of overlapping transcripts in the ROSA 3geo 26 gene trap strain leads to widespread expression of β-galactosidase in mouse embryos and hematopoietic cells. Proc Natl Acad Sci USA. 1997;94:3789–3794. doi: 10.1073/pnas.94.8.3789. [DOI] [PMC free article] [PubMed] [Google Scholar]
- 20.Nagano M, Brinster RL. Spermatogonial transplantation and reconstitution of donor cell spermatogenesis in recipient mice. Acta Pathol Microsc Immunol Scand. 1998;106:47–57. doi: 10.1111/j.1699-0463.1998.tb01318.x. [DOI] [PubMed] [Google Scholar]
- 21.Bellve AR, Cavicchia JC, Millette CF, O'Brien DA, Bhatnagar YM, Dym M. Spermatogenic cells of the prepuberal mouse. J Cell Biol. 1977;74:68–85. doi: 10.1083/jcb.74.1.68. [DOI] [PMC free article] [PubMed] [Google Scholar]
- 22.Nagano M, Avarbock MR, Leonida EB, Brinster CJ, Brinster RL. Culture of mouse spermatogonial stem cells. Tissue Cell. 1998;30:389–397. doi: 10.1016/s0040-8166(98)80053-0. [DOI] [PMC free article] [PubMed] [Google Scholar]
- 23.Ogawa T, Arechaga JM, Avarbock MR, Brinster RL. Transplantation of testis germinal cells into mouse seminiferous tubules. Int J Dev Biol. 1997;41:111–122. [PubMed] [Google Scholar]
- 24.Bucci LR, Meistrich ML. Effects of busulfan on murine spermatogenesis: cytotoxicity, sterility, sperm abnormalities, and dominant lethal mutations. Mutat Res. 1987;176:259–268. doi: 10.1016/0027-5107(87)90057-1. [DOI] [PubMed] [Google Scholar]
- 25.Silvers WK. The Coat Colors of Mice: A Model for Mammalian Gene Action and Interaction. New York, NY: Springer-Verlag; 1979. pp. 206–267. [Google Scholar]
- 26.Till JE, McCulloch EA. A direct measurement of the radiation sensitivity of normal mouse bone marrow cells. Radiat Res. 1961;14:213–222. [PubMed] [Google Scholar]
- 27.Harrison DE. Competitive repopulation: a new assay for long-term stem cell functional capacity. Blood. 1980;55:77–81. [PubMed] [Google Scholar]
- 28.Parreira GG, Ogawa T, Avarbock MR, Franca LR, Brinster RL, Russell LD. Development of testis cell transplants. Biol Reprod. 1998;59:1360–1370. doi: 10.1095/biolreprod59.6.1360. [DOI] [PubMed] [Google Scholar]
- 29.van Beek MEAB, Meistrich ML, de Rooij DG. Probability of self-renewing divisions of spermatogonial stem cells in colonies, formed after fission neutron irradiation. Cell Tissue Kinet. 1990;23:1–16. doi: 10.1111/j.1365-2184.1990.tb01105.x. [DOI] [PubMed] [Google Scholar]
- 30.Withers HR, Hunter NR, Barkley HT, Jr, Reid BO. Radiation survival and regeneration characteristics of spermatogenic stem cells of mouse testis. Radiat Res. 1974;57:88–103. [PubMed] [Google Scholar]