

Abstract
PSP is a pathologically defined neurodegenerative tauopathy with a variety of clinical presentations including typical Richardson's syndrome and other variant PSP syndromes. A large body of neuroimaging research has been conducted over the past two decades, with many studies proposing different structural MRI and molecular PET/SPECT biomarkers for PSP. These include measures of brainstem, cortical and striatal atrophy, diffusion weighted and diffusion tensor imaging abnormalities, [18F] fluorodeoxyglucose PET hypometabolism, reductions in striatal dopamine imaging and, most recently, PET imaging with ligands that bind to tau. Our aim was to critically evaluate the degree to which structural and molecular neuroimaging metrics fulfill criteria for diagnostic biomarkers of PSP. We queried the PubMed, Cochrane, Medline, and PSYCInfo databases for original research articles published in English over the past 20 years using postmortem diagnosis or the NINDS-SPSP criteria as the diagnostic standard from 1996 to 2016. We define a five-level theoretical construct for the utility of neuroimaging biomarkers in PSP, with level 1 representing group-level findings, level 2 representing biomarkers with demonstrable individual-level diagnostic utility, level 3 representing biomarkers for early disease, level 4 representing surrogate biomarkers of PSP pathology, and level 5 representing definitive PSP biomarkers of PSP pathology. We discuss the degree to which each of the currently available biomarkers fit into this theoretical construct, consider the role of biomarkers in the diagnosis of Richardson's syndrome, variant PSP syndromes and autopsy confirmed PSP, and emphasize current shortfalls in the field.
Keywords: Progressive supranuclear palsy, diagnosis, magnetic resonance imaging, positron emission tomography, photon emission computed tomography
Introduction
Progressive supranuclear palsy (PSP) is a pathologic diagnosis with neurodegeneration characterized by abnormal tau pathology in the form of globose neurofibrillary tangles, tufted astrocytes, coiled bodies and threads1, with a predominance of 4-repeat (4R) tau isoforms2. Tau pathology is typically observed in the brainstem, basal ganglia, diencephalon, temporal, motor and premotor cortices1, 2, although distribution can vary3, 4. The most commonly recognized clinical presentation of PSP is Richardson's syndrome (PSP-RS) in which patients have early and notable gait and postural instability, frequent falls, and abnormal vertical eye movements (supranuclear gaze palsy)5, 6. However, a number of other clinical presentations of PSP have been increasingly recognized, including, but not limited to, PSP with predominant Parkinsonism (PSP-P)6, PSP with progressive gait freezing (PSP-PGF)7, PSP with predominant frontal presentation (PSP-F)8, PSP with a predominant speech/language disorder (PSP-SL)9, and PSP with predominant corticobasal syndrome (PSP-CBS)10. We have recently developed the Movement Disorder Society-endorsed PSP clinical diagnostic criteria that recognize this heterogeneity and provide criteria for the different clinical variants of PSP11. A major challenge faced during the revision of the diagnostic criteria was to determine whether there was enough evidence to support the inclusion of neuroimaging biomarkers in the diagnosis of PSP-RS, the other variant syndromes of PSP (vPSP), or in the diagnosis of pathological PSP, and what role they should play in the diagnostic criteria.
Table 1 provides a theoretical construct to judge the utility of diagnostic neuroimaging biomarkers in PSP. The first step is to demonstrate abnormalities in the group of interest compared to matched healthy controls and other clinically overlapping disease groups (level 1). In the context of PSP, this typically means demonstrating abnormalities in PSP-RS compared to other parkinsonian disorders, such as Parkinson's disease (PD), multiple system atrophy with predominant Parkinsonism (MSA-P) and CBS. However, if one wishes to ultimately develop a diagnostic biomarker for PSP pathology, it is also important not to ignore vPSP where neuroimaging signatures may differ from PSP-RS. A biomarker differentiating PSP-F, PSP-SL and PSP-CBS from other frontotemporal lobar degeneration spectrum disorders may also be valuable. In order for these group-level findings to translate into useful biomarkers, the next step is to demonstrate useful sensitivity and specificity (>80%) for the clinical diagnosis at the individual patient-level (level 2). Biomarkers that perform well at this level could be valuable to support the clinical diagnosis. However, since these analyses are based on comparison to clinical diagnosis, rather than gold standard of neuropathology, there is still no evidence at this point that the biomarker adds anything to clinical diagnosis, other than to increase confidence. A biomarker could surpass clinical diagnosis if one can demonstrate utility for early clinical diagnosis when patients have mild or non-specific symptoms and signs before they meet clinical criteria for the disease (level 3), or if one can demonstrate that a biomarker has a strong relationship with the presence of PSP pathology regardless of clinical phenotype (level 4). The later will ideally require the demonstration that a biomarker is highly associated with PSP pathology not only in patients diagnosed with PSP-RS, but also in vPSP, thus representing utility for the entire clinical spectrum of PSP. Neuroimaging biomarkers that satisfy level 4 may still, however, be considered only a surrogate marker of pathology, meaning that they correlate well with pathology but do not directly measure pathology. Thus, the Holy Grail in neuroimaging is to identify a biomarker that directly measures underlying pathology and hence could be considered a definitive pathological biomarker (level 5). We are getting closer to this goal with the development of PET ligands that can bind to abnormal tau in the brain, and current knowledge of these biomarkers will be discussed. At levels 4 and 5, the ideal biomarker would be one that is specific to PSP pathology, although biomarkers that could identify a 4R tauopathy could also be diagnostically useful. Another issue to consider when assessing the value of neuroimaging biomarkers is how well the proposed measures would translate into clinical practice; ideally they should be relatively inexpensive, convenient, safe, widely available and comparable across different centers.
Table 1.
Levels of evidence for neuroimaging biomarkers in PSP
| Level | Utility | PSP-RS | vPSP |
|---|---|---|---|
| 1 | Research tool | Group-level evidence that a biomarker is abnormal in PSP-RS | Group-level evidence that a biomarker is abnormal in vPSP |
| 2 | Supportive of clinical diagnosis | Individual-level data showing diagnostic value (high sensitivity + specificity) for PSP-RS | Individual-level data showing diagnostic value (high sensitivity + specificity) for vPSP |
| 3 | Supportive of early clinical diagnosis | Evidence for abnormalities before patients meet clinical criteria for PSP-RS | Evidence for abnormalities before patients meet clinical criteria for vPSP |
| 4 | Supportive of pathological diagnosis | Individual-level data showing diagnostic value for PSP pathology, regardless of syndrome | |
| 5 | Definitive | Biomarker of actual pathology | |
This review will utilize the theoretical construct outlined in Table 1 to evaluate the degree to which different proposed structural and functional neuroimaging metrics fulfill criteria as diagnostic biomarkers in PSP. As part of our efforts to develop the new diagnostic criteria, a detailed literature search and content evaluation was performed which form the basis of this review (Supplemental Data).
Structural MRI
Brainstem measures
Striking midbrain atrophy is typically observed in PSP-RS, and a number of midbrain metrics have been proposed as potential biomarkers. These metrics include visual assessment of midbrain atrophy, midbrain profile or the presence of specific morphological markers such as the “hummingbird” sign (atrophy of dorsal midbrain resembles hummingbirds head and bill in midsagittal plane12), “Mickey Mouse” sign (rounded rather than rectangular midbrain peduncles in axial planes)13, and “morning glory” sign (concavity of the lateral margin of the midbrain tegmentum in axial planes14) (Figure 1). Quantitative measures of midbrain anterior-posterior diameter, midsagittal area or volume have also been assessed. Studies are in general agreement that midbrain measurements are smaller in PSP-RS compared with MSA and PD14-31, although overlap can occur at the individual level, particularly between PSP-RS and MSA15, 16, 28, 30. Diagnostic sensitivity and specificity values (Table 2) are typically high (>90%) for differentiating PSP-RS from controls and from MSA and PD using midbrain area15-17, 32, although midbrain diameter15, 18-20, 22, 23, 32 and volume15, 24, and visual assessments13, 14, 20, 21, 25, 33, 34, have been more variable, not always meeting the 80% cut-point required for a level 2 biomarker. Visual assessments of midbrain can be particularly problematic since they are not quantitative, lack objectivity, and can be highly dependent on image acquisition and patient positioning35, 36.
Figure 1. Structural MRI demonstrating the morphological characteristics of PSP-RS and brainstem measurements.
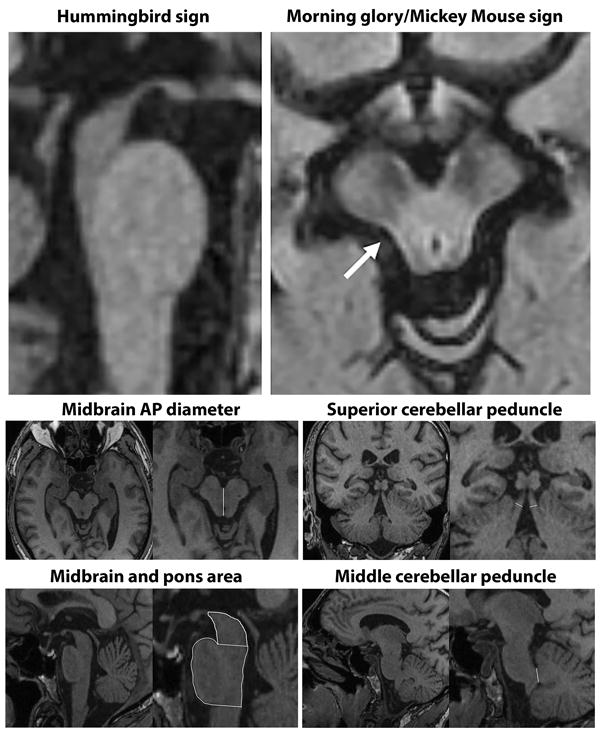
Top left sagittal slice shows the hummingbird sign with atrophy of the dorsal midbrain and relative preservation of the pons. Top right axial slice through the midbrain shows rounded midbrain peduncles (Mickey Mouse sign) and concavity of the lateral margin of the midbrain tegmentum (Morning glory sign, arrow). Bottom images show example measurements of the midbrain anteroposterior (AP) diameter, midbrain and pons area, superior cerebellar peduncle width and middle cerebellar peduncle width (modified from32).
Table 2.
Studies that report sensitivity and specificity of brainstem measurements for the diagnosis of PSP-RS compared to other parkinsonian disorders
| First author | Year | Comparison | Measure | Sensitivity | Specificity |
|---|---|---|---|---|---|
| Schrag20 | 2000 | 35 PSP-RS v 54 MSA | MB visual (MB atrophy) | 77 | 37 |
| Adachi14 | 2004 | 5 PSP-RS v 23 PD 14 MSA | MB visual (morning glory sign) | 80 | 97 |
| Righini25 | 2004 | 25 PSP-RS v 27 PD | MB visual (superior profile) | 68 | 88.8 |
| Righini25 | 2004 | 25 PSP-RS v 27 PD | MB visual (MB atrophy) | 68 | 77.7 |
| Price33 | 2004 | 12 PSP-RS v (12 PD, 12CN) | MB visual (MB atrophy) | 83 | 79 |
| Massey13* | 2012 | 22 PSP v 13 MSA | MB visual (MB atrophy) | 86.4 | 66.7 |
| Massey13* | 2012 | 22 PSP v 13 MSA | MB visual (Hummingbird) | 68.4 | 100 |
| Oba16 | 2005 | 21 PSP-RS v (23 PD, 25 MSA-P, 31 HC) | MB area | 100 | 91.3 |
| Cosottini15 | 2007 | 15 PSP-RS v (7 MSA-P, 14 CN) | MB area | 100 | 90.5 |
| Zanigni17 | 2016 | 23 PSP-RS v 42 PD | MB area | 96 | 98 |
| Moller32 | In Press | 106 PSP-RS v 204 PD | MB area | 84.0 | 83.8 |
| Moller32 | In Press | 106 PSP-RS v 60 MSA-P | MB area | 78.3 | 81.7 |
| Asato18 | 2000 | 8 PSP-RS v 9 MSA-P | MB diameter | 100 | 100 |
| Asato18 | 2000 | 8 PSP-RS v 21 MSA-C | MB diameter | 100 | 91 |
| Schrag20 | 2000 | 36 PSP-RS v 54 MSA | MB diameter | 23 | 96 |
| Cosottini15 | 2007 | 17 PSP-RS v (7 MSA-P, 4 CN) | MB diameter | 60 | 95.2 |
| Massey19* | 2013 | 12 PSP-RS v 7 MSA | MB diameter | 83 | 100 |
| Kim22 | 2015 | 29 PSP-RS v 82 PD | MB diameter | 50 | 85.3 |
| Owens21 | 2016 | 25 PSP-RS v (25 MSA, 25 PD) | MB diameter | 44 | 100 |
| Paviour24 | 2006 | 18 PSP-RS v (9 MSA-P, 9 PD, 18 HC) | MB volume | 72.2 | 91.9 |
| Paviour24 | 2006 | 18 PSP-RS v 9 MSA-P | MB volume | 83 | 33 |
| Cosottini15 | 2007 | 18 PSP-RS v (7 MSA-P, 14 CN) | MB volume | 86.7 | 76.2 |
| Oba16 | 2005 | 22 PSP-RS v (23 PD, 25 MSA-P, 31 HC) | MB-pons ratio | 100 | 100 |
| Cosottini15 | 2007 | 16 PSP-RS v (7 MSA-P, 14 CN) | MB-pons ratio | 86.7 | 100 |
| Quattrone38 | 2008 | 33 PSP-RS v 108 PD | MB-pons ratio | 90.9 | 93.5 |
| Quattrone38 | 2008 | 33 PSP-RS v 19 MSA-P | MB-pons ratio | 97 | 94.7 |
| Hussl41 | 2010 | 22 PSP-RS v 75 PD | MB-pons ratio | 63.6 | 94.7 |
| Hussl41 | 2010 | 22 PSP-RS v 26 MSA-P | MB-pons ratio | 63.6 | 84.6 |
| Morelli37 | 2011 | 42 PSP-RS v 170 PD | MB-pons ratio | 92.9 | 85.3 |
| Longoni39 | 2011 | 10 PSP-RS v 25 PD | MB-pons ratio | 90 | 96 |
| Massey19* | 2013 | 13 PSP-RS v 7 MSA | MB-pons ratio | 67 | 100 |
| Kim22 | 2015 | 30 PSP-RS v 82 PD | MB-pons ratio | 46.2 | 89.7 |
| Zanigni17 | 2016 | 24 PSP-RS v 42 PD | MB-pons ratio | 96 | 90 |
| Owens23 | 2016 | 25 PSP-RS v (25 MSA, 25 PD) | MB-pons ratio | 68 | 100 |
| Borroni45 | 2010 | 18 PSP-RS v (16 CBS, 28 FTD) | MB-pons ratio + CSF bio | 94.2 | 84 |
| Sankhla40 | 2016 | 20 PSP-RS v 13 PD | MB-pons ratio | 100 | 92.86 |
| Moller32 | In Press | 106 PSP-RS v 204 PD | MB-pons ratio | 77.4 | 80.4 |
| Moller32 | In Press | 106 PSP-RS v 60 MSA-P | MB-pons ratio | 77.8 | 89.4 |
| Quattrone38 | 2008 | 33 PSP-RS v 108 PD | MRPI | 100 | 100 |
| Quattrone38 | 2008 | 33 PSP-RS v 19 MSA-P | MRPI | 100 | 100 |
| Hussl41 | 2010 | 23 PSP-RS v 75 PD | MRPI | 81.8 | 76 |
| Hussl41 | 2010 | 23 PSP-RS v 26 MSA-P | MRPI | 81.8 | 92.3 |
| Morelli37 | 2011 | 42 PSP-RS v 170 PD | MRPI | 100 | 99.4 |
| Longoni39 | 2011 | 10 PSP-RS v 25 PD | MRPI | 100 | 92 |
| Kim22 | 2015 | 31 PSP-RS v 82 PD | MRPI | 92.3 | 39.7 |
| Zanigni17 | 2016 | 25 PSP-RS v 42 PD | MRPI | 87 | 93 |
| Nigro43 | 2016 | 88 PSP-RS v 234 PD | MRPI | 100 | 100 |
| Nigro43 | 2016 | 88 PSP-RS v 234 PD | MRPI (automated) | 97.3 | 97.4 |
| Sankhla40 | 2016 | 20 PSP-RS v 13 PD | MRPI | 100 | 100 |
| Mostile44 | 2016 | 12 PSP-RS v 17 vascular parkinsonism | MRPI | 100 | 100 |
| Moller32 | In Press | 106 PSP-RS v 204 PD | MRPI | 68.9 | 67.7 |
| Moller32 | In Press | 106 PSP-RS v 60 MSA-P | MRPI | 79.0 | 64.1 |
PD = Parkinson's disease; MSA-P = parkinsonian variant of multiple system atrophy; MSA-C = cerebellar variant of multiple system atrophy; CBS = corticobasal syndrome; FTD = frontotemporal dementia; CN = cognitively normal controls; MB = midbrain; MRPI = MR parkinsonism index; CSF bio = cerebrospinal fluid biomarkers
Studies with autopsy-confirmed PSP
A ratio of midbrain-to-pons area (Figure 1) in the midsagittal plane has been proposed as a biomarker to differentiate PSP-RS from MSA-P, given that MSA-P is associated with atrophy of pons and sparing of midbrain; the opposite pattern to PSP-RS15. Some studies have found high sensitivity and specificity for midbrain-pons area ratio in differentiating PSP-RS from MSA-P and from PD15-17, 19, 32, 37-40, although sensitivity has been lower in other studies22, 23, 41 (Table 2). The superior cerebellar peduncles (SCP) are also atrophic in PSP42, which contrasts to a relative sparing of the middle cerebellar peduncles (MCP). This has led to the development of the MR Parkinsonism index (MRPI) which takes into account both the midbrain-pons area ratio and the ratio of the MCP to SCP width [(P/M)*(MCP/SCP)]38 (Figure 1). The MRPI is typically increased in PSP-RS compared to controls, MSA-P and PD, and sensitivity and specificity values for the differential diagnosis of PSP-RS from MSA-P, PD and vascular parkinsonism have been excellent17, 22, 37-39, 41, 43, 44 (typically >80% and up to 100% sensitive in a few studies that represent different continents37-40, 43, 44) (Table 2). A number of studies have found that the MRPI was superior or equivalent to the midbrain-pons ratio in differentiating PSP-RS from MSA-P and PD17, 37, 38, 40, 41 (Table 2). Less data are available to assess how well midbrain measures could differentiate PSP-RS from CBS13, 45. There is, therefore, plenty of evidence to support brainstem measurements as level 2 diagnostic biomarkers in PSP-RS (Table 3). However, proposing one specific measure for the purposes of diagnostic criteria is challenging because centers differ in how they perform these measurements and specific cut-points vary and will likely be cohort- and acquisition-specific. The MRPI appears to be less affected by aging compared to the midbrain-pons-ratio46 but requires detailed measurement of a number of structures which may be difficult to standardize. Indeed, one multi-center study found that the MRPI did not perform as well as midbrain-to-pons ratio in differentiating PSP-RS from PD and MSA-P32. However, another multi-center study showed high sensitivity/specificity for the MRPI in differentiating PSP-RS and PD and showed that an automated MRPI measurement that does not rely on rater reliability performs as well as a manual MRPI measurement43. Automated methods for measuring midbrain volume are also now available47 and may improve standardization.
Table 3.
Currently available neuroimaging biomarkers that fulfill each level of evidence in PSP
| Level | Utility | PSP-RS | vPSP |
|---|---|---|---|
| 1 | Research tool |
|
|
| 2 | Supportive of clinical diagnosis |
|
|
| 3 | Supportive of early clinical diagnosis |
|
|
| 4 | Supportive of pathological diagnosis | None | |
| 5 | Definitive | None | |
DTI = diffusion tensor imaging; DWI= Diffusion weighted imaging; MRS = magnetic resonance spectroscopy; fMRI = functional magnetic resonance imaging; SPECT = Single-photon emission computed tomography; FDG-PET = [18F] fluorodeoxyglucose positron emission tomography; MRPI = MR Parkinsonism index; DAT = dopamine transporter
Level of evidence is supported by ≤3 published studies, suggesting lower level of reliability
There is evidence that these biomarkers could reach level 3, and show diagnostic value in early PSP-RS (Table 3). Studies have found that abnormal MRPI and midbrain-pons ratios predate, and can predict, the development of PSP-RS in patients with clinically unclassifiable parkinsonism at baseline in a retrospective23 and prospective study48, with abnormalities detected 15 months before patients fulfill criteria for PSP-RS in the retrospective study23.
Given that the clinical diagnosis of PSP-RS has high sensitivity and specificity for pathological PSP13, 49, 50, midbrain-based measures discussed above also tend to perform well in autopsy-confirmed studies19, 29. However, it is less clear whether these measures add anything to the clinical diagnosis of PSP-RS in predicting pathology, and hence could be level 4 biomarkers13. Group-level studies have failed to find midbrain atrophy in patients with PSP pathology who presented with clinical syndromes other than PSP-RS51, including patients presenting with CBS52. Conversely, reduced midbrain areas were identified in PSP-RS that had underlying corticobasal degeneration pathology51. It therefore appears that in many instances midbrain atrophy is related to the PSP-RS clinical presentation, rather than to the presence of PSP pathology, limiting its value as level 4 diagnostic biomarkers. In fact, midbrain area measures had a 93% sensitivity and 89% specificity in differentiating PSP-RS from other syndromes across a range of pathologies in the same study51, once again supporting midbrain measurements as level 2 biomarkers of PSP-RS. Similarly, another autopsy study found that midbrain atrophy was present in only 86.4% of pathologically confirmed PSP and the hummingbird sign was only present in 68.4% even after a disease duration of 4.8 years13. Midbrain atrophy has, however, been observed in speech and language disorders that are confirmed or suspected of having PSP pathology53-56, as well as in PSP-F8 and PSP-P39, 57-59. Midbrain atrophy in vPSP is typically less severe than in PSP-RS39, 56-58, although there is some suggestion that abnormalities on the MRPI could be an early feature in PSP-P59 and have some value as a level 3 biomarker.
Cortical measures
A number of group-level studies have demonstrated cortical atrophy in PSP-RS, typically involving the frontal lobes33, 60-74. The focus of atrophy appears to be the premotor cortex, but atrophy also spreads into prefrontal cortex. Studies have demonstrated that whole brain and frontal atrophy are greater in PSP-RS than PD24, 64, 67, 72, 75 and MSA-P72, although visual assessment of frontal atrophy had poor sensitivity (17% and 57%) and moderate specificity (75% and 83%) in differentiating PSP-RS from MSA13, 20 in two studies, reflecting the fact that discernible frontal atrophy is only present in approximately 60% of PSP-RS patients13. Frontal atrophy may be more useful if considered in addition to brainstem regions. One study found that adding frontal, third ventricle, and whole brain volumes to midbrain and SCP volumes improved the differentiation of PSP-RS from PD and MSA (sensitivity=88.9%, specificity=97.3%)24. Another showed that combining frontal, ventricular, and whole brain volumes could differentiate PSP-RS from PD and controls with 95.2% sensitivity and 90.9% specificity64. One caveat to consider, however, is that frontal atrophy is unlikely to differentiate PSP-RS from CBS, given that CBS shows striking frontal atrophy60, 62, 68, 76. Quantitative methods for assessing frontal volume or thickness also vary widely across studies and may influence diagnostic utility.
Frontal atrophy also occurs in vPSP, particularly in PSP-F8, PSP-SL9, 54, 55 and PSP-CBS52, 77 and can be greater than PSP-RS62, likely reflecting a shift in PSP pathological burden from brainstem to cortex78. The degree of frontal atrophy is similar in both PSP-PGF79 and PSP-P57 compared to PSP-RS. Although no diagnostic data are available on the value of frontal atrophy in vPSP, the presence of frontal atrophy would be consistent with these diagnoses. Data are needed to determine whether cortical measures could help differentiate vPSP from other frontotemporal lobar degeneration disorders that are primarily characterized by frontal atrophy.
Other subcortical measures
Atrophy of subcortical structures, including caudate nucleus, putamen, globus pallidus, subthalamus and thalamus, has also been observed in group-level studies of PSP-RS either using visual assessment or volumetric measurements13, 28, 62, 63, 74, 80-82. There is evidence that volumes of putamen, thalamus and globus pallidus are smaller in PSP-RS than PD82, with thalamus volumes also being smaller than MSA-P28. However, studies have found that visual assessments of putamen and globus pallidus atrophy are not diagnostically useful in differentiating PSP-RS from MSA or PD13, 20. The caudate nucleus, putamen and thalamus have also been reported to be atrophic in CBS13, 62, 83, and are unlikely to be diagnostically useful in differentiating PSP-RS and CBS. Basal ganglia structures have been reported to be atrophic in patients with PSP-P57, PSP-CBS52, 77, and PSP-SL9, with thalamic atrophy reported in PSP-PGF79. The diagnostic value of these findings is, however, unclear and limited to level 1 (Table 3). Abnormalities suggesting the presence of iron deposition have been observed in the putamen, globus pallidus and thalamus in PSP-RS84-87, with some evidence for differences from PD and MSA84, 85, 87, although diagnostic performance was sub-optimal85, 86. Results regarding signal increase or decrease of these structures on T2-weighted MRI in PSP-RS have been variable, with signal changes observed in less than 50% of patients13, 20, 88-90. Signal alterations in the SCP have also been observed in PSP-RS, but not in MSA-P or PD91, 92.
Pattern approaches to diagnosis
A number of studies have proposed that the assessment of multiple regions of the brain will optimize sensitivity and specificity for PSP-RS. These studies typically develop optimal prediction models93, or utilize automated machine-learning techniques to identify diagnostic patterns94-100. A number of these studies have found that assessment of multiple regions, including midbrain, basal ganglia95, 97, 98, 100, cerebellum98, 100 or thalamus99 provided excellent sensitivity and specificity to differentiate PSP-RS from PD and MSA-P. One study found that a prediction model using midbrain, putamen and cerebellar grey matter volumes could differentiate PSP-RS from MSA and PD with 90% sensitivity and 100% specificity in an early stage of the disease when not all patients had yet fulfilled clinical diagnostic criteria for these diseases100. It has also been suggested that volumetric white matter measurements may show greater diagnostic utility than grey matter measures94, 96. There is also some evidence that a pattern-based approach utilizing brainstem and cortical grey and white matter measures could be used in the differential diagnosis of autopsy-confirmed PSP and CBD93. Generally, assessing the pattern of atrophy, rather than focusing on specific regions, appears to be a sensible and sensitive and specific approach to differential diagnosis, although there is currently a lack of agreement across studies on which specific regions should be used and further validation of these results in independent cohorts is necessary. In addition, no data are yet available on how well these approaches perform in vPSP. There is further work needed before these approaches can be incorporated into clinical criteria.
Diffusion imaging
Measurements of microstructural damage using diffusion-weighted imaging (DWI) show some promise as biomarkers of PSP-RS. Apparent diffusion coefficient (ADC) measurements from DWI have been assessed in grey and white matter structures in PSP-RS, showing elevated ADC values in putamen, caudate, globus pallidus, midbrain, SCP and prefrontal and precentral white matter101-107. PSP-RS patients typically show higher ADC values in putamen, caudate nucleus, globus pallidus, SCP and midbrain compared to PD102, 106-108, with one study obtaining high sensitivity (90%) and specificity (100%) to differentiate PSP-RS from PD using values from the putamen107 and another obtaining 100% sensitivity and specificity using the SCP103. In comparison to MSA-P, PSP-RS has higher ADC values in the caudate nucleus106 and SCP103, 106 but lower values in the MCP105, 109, cerebellum110, and putamen101. Sensitivity and specificity values for differentiating PSP-RS from MSA-P are high using DWI of the SCP (sensitivity=96.4%, specificity=93.3%103). The diagnostic performance of DWI measurements is, therefore, excellent, supporting these measurements as level 2 biomarkers (Table 3). There is no consensus regarding the best structure to assess, although the SCP appears promising.
Diffusion tensor imaging (DTI) allows for the assessment of directional water diffusion and the interrogation of specific white matter tracts. White matter tract degeneration has been demonstrated to be a striking feature of PSP-RS, with abnormalities observed predominantly in SCP, cerebellum, body of the corpus callosum, cingulum, white matter laminar of the thalamus and premotor aspects of the superior longitudinal fasciculus63, 111-124. The majority of these white matter tracts show greater degeneration in PSP-RS compared to PD112, 118, 122, 125-127 and MSA-P72, 118, 126. Little data are currently available on the diagnostic utility of DTI measures, although the corpus callosum113 and SCP125 show high sensitivity and specificity in differentiating PSP-RS and PD. There is also evidence that adding DTI measures to the MRPI may help in the differentiation of PSP-RS from controls128. The diagnostic value of DTI measures to differentiate PSP-RS and MSA-P is unclear. It is also unclear whether DTI measures could differentiate PSP-RS and CBS, particularly given that patterns of DTI abnormalities overlap to a large degree between these two syndromes112, 129-131. A few studies have assessed DTI measures in PSP-P which appears to show similar, although slightly less severe, patterns of tract abnormalities in comparison with PSP-RS128. Some studies have found regions with greater abnormalities in PSP-P compared to PSP-RS, although the results have not been consistent across studies117, 120, 128. In summary, DTI abnormalities are striking in PSP-RS and have the potential to be useful diagnostic biomarkers (Table 3). Data are, however, needed on the utility of both DWI and DTI measures in vPSP and autopsy-confirmed PSP. The issue of whether DWI and DTI measurements can be translated into clinical practice is also unclear, since there is little standardization of methods across studies and no established diagnostic cut-points for these measurements.
PET/SPECT
[18F]FDG-PET
[18F]-fluorodeoxyglucose PET (FDG-PET) studies have shown hypometabolism in midbrain, basal ganglia, thalamus and frontal lobes in PSP-RS132-145, with frontal involvement particularly targeting premotor, precentral and prefrontal regions134 and anterior cingulate146 (Figure 2A). In an autopsy cohort including seven PSP patients (all PSP-RS), the most common FDG-PET findings were hypometabolism of thalamus (100%), caudate (86%), midbrain (86%), and frontal lobes (71%)145. PSP-RS tends to show greater frontal hypometabolism than PD and MSA146, with visual assessments of frontal hypometabolism producing good sensitivity (76%) and specificity (98%) for PSP-RS in one study147. Visual assessments of midbrain hypometabolism have performed modestly, with one study finding 79% sensitivity and 69% specificity in differentiating PSP-RS from MSA and CBS144. Consideration of the pattern of hypometabolism may hold more diagnostic promise. Visual assessment of the pattern of hypometabolism associated with PSP-RS (e.g. anterior cingulate, midbrain, basal ganglia) gave 93% sensitivity and 90% specificity to differentiate PSP-RS from PD, MSA and CBS in one study147. Automated pattern detection techniques have given mixed results148-152. Differentiating PSP-RS from CBS can be challenging, given that patterns of hypometabolism overlap between these two syndromes to a large degree138, 145, 152 although there is some suggestion that PSP-RS may have greater hypometabolism in midbrain and thalamus136, 153 and CBS patients have greater hypometabolism in parietal lobes135, 138, 153. The presence of hemispheric asymmetry in CBS may further help differentiate it from PSP-RS145, 152. Current evidence, therefore, provides some support for frontal and midbrain hypometabolism, or the combination of both, as potential level 2 biomarkers of PSP-RS (Table 3). There is some evidence that hypometabolism in striatum and cortex can be present before the development of clinical PSP-RS (level 3 biomarker), although this has only been observed in familial PSP154.
Figure 2. FDG-PET, DAT and tau PET findings in PSP-RS.
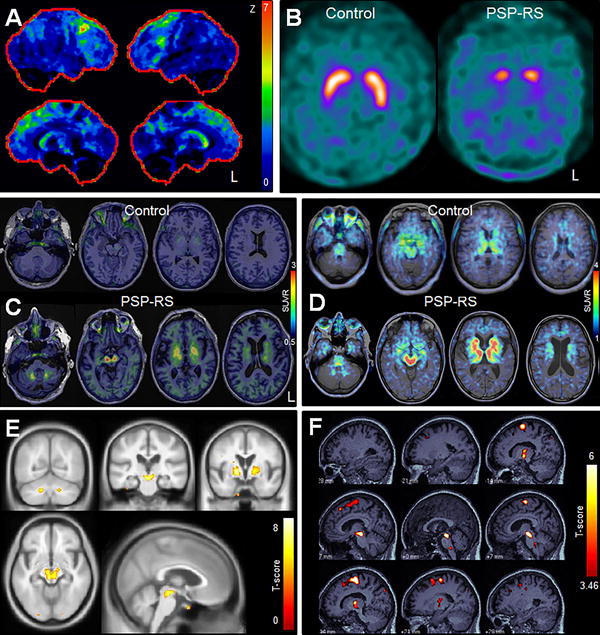
Panel A shows a statistical stereotactic surface projection map of an FDG-PET scan for a PSP-RS patient where Z score values represent differences from a normal cohort and are color coded as indicated in the color scale (0 = normal; 7 = most abnormal). Hypometabolism is observed in the frontal lobes, midbrain and caudate nucleus. Panel B demonstrates absent putamen DAT binding and reduced caudate binding in a patient with PSP-RS compared to a control subject. Panels C and E show [18F]AV-1451 results. Panel C shows [18F]AV-1451 tau-PET scans in a patient with PSP-RS and an age-matched control. The control shows some uptake in midbrain and basal ganglia, although uptake in these regions is greater in the PSP-RS patient. In addition, the PSP-RS patient shows uptake in the dentate nucleus of the cerebellum and thalamus. Panel E shows group-level [18F]AV-1451 findings in 10 patients with PSP-RS compared to healthy controls. Increased uptake in PSP-RS compared to controls is identified in dentate nucleus of the cerebellum, midbrain, thalamus, and basal ganglia (Modified from183). Panels D and F show THK-5351 results. Panel D shows a THK-5351 tau-PET scan in a patient with PSP-RS and a healthy control. The control and PSP-RS patient show uptake in the midbrain, thalamus, and basal ganglia, although the degree of uptake is greater in PSP-RS. Panel F shows group-level THK-5351 findings in 10 patients with PSP-RS compared to healthy controls. Increased uptake in PSP-RS compared to controls is identified in midbrain, thalamus, basal ganglia and posterior lateral and medial frontal lobe. Modified from232.
Some FDG-PET findings have been reported in vPSP. One study found that PSP-P was associated with slightly greater hypometabolism of the putamen than PSP-RS, with less severe involvement of the thalamus, and that a putamen-to-thalamus ratio differentiated PSP-RS from PSP-P and PD with 100% sensitivity and 75% specificity155. The PSP-P patients in that study did not show much frontal hypometabolism155. Frontal hypometabolism has also not been observed in PSP-PGF, with midbrain hypometabolism only observed in 25% of patients156. Patients with PSP-SL have shown frontal, basal ganglia and midbrain hypometabolism9, 157, 158, although only one of these studies had autopsy confirmation9. Taken together, these studies show that neither frontal nor midbrain hypometabolism are present consistently across the vPSP syndromes. The presence of these features could, therefore, be supportive of PSP, but the absence does not preclude underlying PSP.
There is, however, a lack of standardization in the quantitative methods used across FDG-PET studies, particularly in regards to the choice of reference regions used to standardize regional uptake values which vary across studies, including cerebellum, pons, cortical regions or global mean values; each of which may have different limitations in PSP.
Dopamine imaging
Striatal presynaptic dopamine binding, measured using dopamine active transporter (DAT) imaging utilizing [123I]-FP-CIT SPECT or [18F]FP-CIT-PET, is consistently decreased in PSP-RS compared to controls159 (Figure 2B). However, decreased DAT binding is also observed in PD, MSA-P and CBS160-164, without differences in the degree of general striatal binding observed across groups160, 162, 165. However, studies have found that the caudate nucleus is affected to a greater degree in PSP-RS compared to PD161, 163, 166, 167, and that regional patterns of binding, such as ratio of caudate-to-ventral striatum (sensitivity=94%, specificity=92%)163, ratio of caudate-to-putamen166, or ratio of anterior-posterior putamen167, could help differentiate PSP-RS from other parkinsonian disorders; however, diagnostic performance has not always been consistent with these measures164, 167. It has also been shown that PSP-RS shows more symmetric striatal binding than PD168, although the diagnostic value of this finding is unclear. Overall the finding of reduced striatal DAT binding is highly supportive and sensitive for a diagnosis of PSP-RS, but heterogeneity across studies and lack of diagnostic data limits its value in differentiating across parkinsonian disorders (Table 3). Midbrain DAT binding is also decreased in PSP-RS, with lower binding than PD but a similar degree of binding to MSA160, 169. Brainstem DAT levels could differentiate PSP-RS and MSA from PD with 89.7 % sensitivity and 94.1% specificity in one study169. Little is currently known about the diagnostic utility of DAT findings in vPSP, although there is evidence from a few studies that both PSP-PGF and PSP-P are associated with striatal DAT reductions similar to those in PSP-RS156, 170-172, with similar putamen-to-caudate ratios171, 172.
Imaging using D2 receptor ligands, most commonly [123I]-IZBM SPECT, to assess post-synaptic dopaminergic function also appears to be sensitive in PSP-RS, with the majority of patients showing striatal reductions172-176. However, the value of D2 receptor ligand imaging in the differential diagnosis from other parkinsonian disorders is unclear162, 175, 176. In addition, there is some evidence that striatal uptake may not be reduced in PSP-P172.
Tau-PET imaging
The development of PET ligands that can bind to aggregated tau inclusions in the brain has been an exciting recent advance in the field with the potential of becoming a biomarker of tau pathology. A number of tau-PET ligands have been developed177, but the [18F]AV-1451 (previously known as T807) ligand178, 179 has been the most widely utilized to date. Studies have demonstrated relatively consistent patterns of increased [18F]AV-1451 uptake in PSP-RS compared to controls in globus pallidus, putamen, caudate nucleus, thalamus, subthalamic nucleus, midbrain and dentate nucleus of the cerebellum180-184 (Figure 2C). The cortex has typically shown less striking uptake in PSP-RS183 with measures from subcortical structures showing the most promise as potential diagnostic biomarkers180, 182, 183. Quantification of globus pallidus retention provided sensitivity and specificity of 93% in differentiating PSP-RS from controls, and 93% sensitivity and 100% specificity in differentiating PSP-RS and PD in one study180, although the thalamus provided the best separation between PSP-RS and controls in another182. There is also evidence that the pattern of uptake in PSP-RS differs from Alzheimer's disease (AD), with many of the PSP-RS related regions showing greater uptake in PSP-RS than AD despite the fact that AD showed greater cortical [18F]AV-1451 uptake183, 184. There is, therefore, some evidence to support [18F]AV-1451 as a level 2 biomarker of PSP-RS. A caveat is that overlap in [18F]AV-1451 signal is observed between PSP-RS and controls182 with one study failing to observe differences between PSP-RS and controls185, and so more work is needed to confirm these results. Standardization of methods will also be required, including optimizing scan time and quantitative outcomes. Current studies have analyzed SUVR values referenced to cerebellar grey matter180, 182, 183 or binding potentials184.
While early studies are certainly encouraging, several limitations of [18F]AV-1451 need to be considered. One caveat is that regions that show [18F]AV-1451 uptake in PSP, including basal ganglia, thalamus, midbrain and dorsal cerebellum also show some degree of “off-target” binding in normal subjects which increases with age186, 187. The nature of this binding is unclear. While age correction in quantitative studies may go some way to correct for this “off-target” binding, it will likely limit the value of [18F]AV-1451 in differential diagnosis of individual patients. Furthermore, it is unknown whether the “off-target” signal may also be altered by the disease in PSP, confounding any potential true signal of tau. Another caveat comes from an apparent disconnect between in-vivo and ex-vivo studies. While regions that show elevated binding typically show tau deposition at autopsy, autoradiographic studies have found little or no binding of [18F]AV-1451 to tau in autopsied brains of PSP patients182, 187-192 casting doubt on whether the signal identified by [18F]AV-1451 reflects tau pathology and whether it could be considered a level 5 biomarker of tau. This kind of disconnect is not uncommon for PET tracers and the utility of such in-vitro studies has been questioned193. However, a recent paper found that tau pathology found post-mortem in a patient with PSP correlated with antemortem FDG-PET but not with [18F]AV-1451 signal190. Another caveat is that elevated [18F]AV-1451 uptake has also been observed in non-tau diseases187, 194 which again questions the specificity of the ligand to 4R tau. Another chemically distinct tau PET ligand, THK-5351195, was found to have high affinity for PSP tau lesions in an autoradiographic study196, and has shown uptake in the globus pallidus and midbrain196 in patients with PSP-RS (Figure 2D). However, the degree of “off-target” THK-5351 binding in PSP-related regions is at least as high, if not higher, than that observed with [18F]AV-1451197. Overall, much more work needs to be done to evaluate these PET tracers. It is likely that different tau-PET ligands may bind to tau conformers with differing sensitivity and specificity and show different off-target binding and hence head-to-head and indirect comparisons of the currently available tau imaging agents is needed.
Other Biomarkers
There are a number of other neuroimaging biomarkers that have been assessed in PSP-RS with less data available to assess diagnostic value. MR modalities that demonstrate abnormalities in PSP-RS include magnetic resonance spectroscopy and magnetization transfer imaging73, 198,199-205, although the ability of these modalities to differentiate PSP-RS from other parkinsonian disorders is unclear181, 184, 185,205. Resting state (task-free) functional MRI has also been used to demonstrate abnormalities in functional connectivity in PSP-RS across the network of PSP-RS associated regions63, 206, 207, but the loss of cortical connectivity is not specific to PSP-RS vs PD208. Longitudinal MR studies have shown increased rates of whole brain, cortical and midbrain atrophy, and SCP diffusivity, in PSP-RS compared to controls209-218, with some evidence for greater rates than PD, but similar rates of whole brain and midbrain atrophy as MSA-P212, 215. Cortical and whole brain rates of atrophy are, however, greater in CBS than PSP-RS209, 213. Cerebral blood flow single-photon emission computed tomography studies have demonstrated frontal219-225, and less commonly thalamic220 and striatal222, hypoperfusion in PSP-RS221, 226. Findings concerning differential diagnosis from other parkinsonian disorders are lacking here, although PSP-RS may show greater frontal hypoperfusion than PD224, 227. Abnormalities in other neurotransmitter systems, such as the cholinergic228-230 and serotoninergic231 systems, have also been demonstrated in PSP-RS.
Conclusions
Neuroimaging research over the last several decades has improved our understanding of the neurobiology of PSP but has not yielded many confirmed diagnostic biomarkers (Table 3). The most mature research area is the assessment of midbrain measurements which has yielded a number of measures that have good sensitivity and specificity for PSP-RS versus other parkinsonian disorders, such as midbrain-pons area and the MRPI which appear to be the most reliable biomarkers for diagnosis of PSP-RS. The presence of frontal atrophy and hypometabolism are also prominent features of PSP-RS, and may improve diagnosis when considered together with midbrain atrophy. It is clear that PSP-RS is associated with striking damage to the white matter, with DWI measures of the SCP providing good sensitivity and specificity for PSP-RS diagnosis, although data supporting this measure comes from only a couple of studies. DTI measures could prove to be very valuable, although more work is needed to provide and validate standardized measures of the kind that could be used in diagnostic criteria. Measures of dopamine function are highly sensitive to PSP-RS and many of the vPSP syndromes, but specificity is low, and thus they are less useful in ruling out other parkinsonian syndromes. Data so far only supports neuroimaging biomarkers as level 2 biomarkers for PSP-RS. Only a handful of studies have assessed patients early in the disease course to suggest level 3 biomarkers. More work is needed to assess the value of these measures in vPSP, and in autopsy-confirmed cases to determine whether they could be useful level 4 biomarkers. Capturing the disease in its earliest phase will also be critical to develop well validated level 3 biomarkers. Lastly, tau-PET imaging techniques are exciting but more work is needed to truly understand the biological underpinnings of the tau-PET signal in PSP. These are, however, early days in tau-PET imaging and we expect our understanding of these biomarkers to increase exponentially over the coming years.
Supplementary Material
Acknowledgments
JLW and KAJ were supported by NIH grants R01-NS89757 and R01-DC12519. GUH was supported by the Deutsche Forschungsgemeinschaft (DFG, HO2402/6-2). We thank Ina B. Kopp for guidance in the methods of evidence-based medicine, Judith Dams for conducting the database inquiry. The project was supported by the Bischof Dr. Karl Golser Stiftung, CurePSP, Deutsche Forschungsgemeinschaft (DFG, HO 2402/11-1), German Center for Neurodegenerative Diseases e.V. (DZNE), German PSP Gesellschaft, Tau Consortium, UK PSP Association, and the International Parkinson & Movement Disorder Society.
Founding source for study: The project was supported by the Bischof Dr. Karl Golser Stiftung, CurePSP, Deutsche Forschungsgemeinschaft (DFG, HO 2402/11-1), German Center for Neurodegenerative Diseases e.V. (DZNE), German PSP Gesellschaft, Tau Consortium, UK PSP Association, the International Parkinson & Movement Disorder Society and National Institutes of Health grant R01-NS89757.
Jennifer Whitwell is supported by National Institutes of Health grants R01-NS89757, R01-DC12519, R01-AG50603, R01-AG37491 and R21- NS94684.
Günter U. Höglinger has served on the advisory boards for AbbVie, Alzprotect, Asceneuron, Bristol-Myers Squibb, Roche, Sellas Life Sciences Group, UCB; has received honoraria for scientific presentations from Abbvie, Roche, Teva, UCB, has received research support from CurePSP, the German Academic Exchange Service (DAAD), German Research Foundation (DFG) and the German Ministry of Education and Research (BMBF), the Sellas Life Sciences Group; has received institutional support from the German Center for Neurodegenerative Diseases (DZNE).
Angelo Antonini received funding from Horizon2020 Project No 643706. He has also received consultancy fees and honoraria for speaker-related activities from AbbVie, UCB, Zambon, General Electric, Boston Scientific, Mundipharma, Acadia, Medtronic, Angelini Pharmaceuticals, Neuroderm Yvette Bordelon receives research support from AbbVie, C2N diagnostics and Bristol-Myers Squibb and speakers' honoraria from Teva Pharmaceuticals.
Adam Boxer is supported by National Institutes of Health grants U54NS092089, R01AG038791 and P01AG19724 and the Tau Research Consortium.
Carlo Colosimo received consulting fees as an advisory board member and honoraria as a speaker from Ipsen,Merz, Zambon
Thilo van Eimeren is supported by grants of the Deutsche Forschungsgemeinschaft (DFG, EI 892/3-1), the EU Joint Programme – Neurodegenerative Disease Research (JPND, Innofond 6177-00001B) and the Leibniz Association (SAW-2013-IfW-2) and received speaking honoraria and consulting fees from Eli Lily, Shire and the CHDI Foundation.
Lawrence I Golbe is supported by research funding from Bristol-Myers Squibb, AbbVie and the American Parkinson's Disease Association and consults for Bristol-Myers Squibb, AbbVie, SJO Research and the University of California.
Jan Kassubek received consulting fees as an advisory board member and honoraria for scientific presentations from UCB Pharma, Teva Pharmaceuticals, Zambon, Medtronic, Desitin, AbbVie, Boehringer Ingelheim, GlaxoSmithKline, Merz Pharmaceuticals and Hoffmann-La Roche.
Dr. Litvan is supported by the National Institutes of Health grants: 5P50 AG005131-31, 5T35HL007491, 1U01NS086659 and 1U54NS092089-01; Parkinson Study Group, Michael J Fox Foundation, AVID Pharmaceuticals, C2N Diagnostics and Bristol-Myers Squibb. She receives her salary from the University of California San Diego. She has been a member of the Cynapsus, Lundbeck, Biogen and Bristol-Myers Squibb Advisory Boards and is a member of the Biotie/Parkinson Study Group Medical Advisory Board.
Alexander Pantelyat is supported by National Institutes of Health grants P50NS03837701 and U01NS082133-04.
Gil Rabinovici is supported by National Institutes of Health grants R01-AG045611 , P50-AG23501 , U54-NS092089 , 2R01-AG038791 , R01-AG048234, the American College of Radiology, the Association for Frontotemporal Degeneration, Michael J. Fox Foundation, Alzheimer's Association. FINANCIAL DISCLOSURES: Dr. Rabinovici received research support from Avid Radiopharmaceiticals, GE Healthcare and Piramal, and has received speaking honoraria or consulting fees from Eisai, Genentech, Lundbeck, Merck, Puntam, Roche.
James Rowe is in receipt of research grants from AZ-Medimmune and Janssen; with principal funding from the Wellcome Trust, Medical Research Council and the National Institute for Health Research.
Maria Stamelou has served on the editorial board of Movement Disorders Journal and Frontiers in Movement Disorders; has received speaker and travel honoraria from Actelion and Abbvie Pharmaceuticals and the Movement Disorders Society and royalties from Oxform University Press..
Keith Josephs is supported by National Institutes of Health grants R01-NS89757, R01-AG37491, R01-DC12519, R01-AG50603 and R21- NS94684
Appendix
The MDS endorsed PSP study group
Adam L Boxer, Alex Rajput, Alexander Pantelyat, Angelo Antonini, Anthony E Lang, Armin Giese, Brit Mollenhauer, Carlo Colosimo, Caroline Kurz, Christer Nilsson, Claire Troakes, David J Irwin, Dennis W. Dickson, Ellen Gelpi, Florian Krismer, Gerard D Schellenberg, Gesine Respondek, Gil Rabinovici, Gregor K Wenning, Günter U Höglinger, Huw R Morris, Irene Litvan, James B Rowe, Jan Kassubek, Jean-Christophe Corvol, Jennifer L Whitwell, Johannes Levin, John van Swieten, Kailash P Bhatia, Keith A Josephs, Klaus Seppi, Lawrence I Golbe, Maria Stamelou, Murray Grossman, Peter Nestor, Richard Dodel, Stefan Lorenzl, Thilo van Eimeren, Thomas Arzberger, Ulrich Müller, Wassilios G Meissner, Werner Poewe, Wolfgang H Oertel, Yaroslau Compta, Yvette Bordelon.
Footnotes
Financial Disclosure/ Conflict of Interest concerning the research related to the manuscript: none
Author Roles: 1. Research Project: A. Conception, B. Organization, C. Execution; 2. Statistical Analysis: A. Design, B. Execution, C. Review and Critique; 3. Manuscript Preparation: A. Writing the First Draft, B. Review and Critique.
Jennifer L. Whitwell: 1B, 1C, 2C, 3A;
Günter U. Höglinger: 1A, 1B, 1C, 2A, 2B, 3A;
Angelo Antonini: 2C, 3B;
Yvette Bordelon: 2C, 3B;
Adam Boxer: 1A, 1B, 1C, 3B;
Carlo Colosimo: 2C, 3B;
Thilo van Eimeren: 2C, 3B;
Jan Kassubek: 2C, 3B;
Caroline Kurz: 2C, 3B;
Alexander Pantelyat: 2C, 3B;
Gesine Respondek: 2C, 3B;
Axel Rominger: 2C, 3B;
Gil Rabinovici: 2C, 3B;
James Rowe: 2C, 3B;
Maria Stamelou: 1A, 1B, 2C, 3B;
Keith A. Josephs: 1B, 1C, 2C, 3A;
Financial Disclosures of all authors for the preceding 12 months: Carolin Kurz has nothing to disclose.
Gesine Respondek has nothing to disclose.
Axel Rominger has nothing to disclose.
References
- 1.Hauw JJ, Daniel SE, Dickson D, et al. Preliminary NINDS neuropathologic criteria for Steele-Richardson-Olszewski syndrome (progressive supranuclear palsy) Neurology. 1994;44(11):2015–2019. doi: 10.1212/wnl.44.11.2015. [DOI] [PubMed] [Google Scholar]
- 2.Dickson DW, Hauw JJ, Agid Y, Litvan I. Neurodegeneration: The molecular pathology of dementia and movement disorders. In: Dickson D, Weller RO, editors. Progressive Supranuclear Palsy and Corticobasal Degeneration. 2nd. Chichester, UK: Wiley-Blackwell; 2011. [Google Scholar]
- 3.Dickson DW, Ahmed Z, Algom AA, Tsuboi Y, Josephs KA. Neuropathology of variants of progressive supranuclear palsy. Curr Opin Neurol. 2010;23(4):394–400. doi: 10.1097/WCO.0b013e32833be924. [DOI] [PubMed] [Google Scholar]
- 4.Schofield EC, Hodges JR, Macdonald V, Cordato NJ, Kril JJ, Halliday GM. Cortical atrophy differentiates Richardson's syndrome from the parkinsonian form of progressive supranuclear palsy. Mov Disord. 2011;26(2):256–263. doi: 10.1002/mds.23295. [DOI] [PubMed] [Google Scholar]
- 5.Litvan I, Agid Y, Calne D, et al. Clinical research criteria for the diagnosis of progressive supranuclear palsy (Steele-Richardson-Olszewski syndrome): report of the NINDS-SPSP international workshop. Neurology. 1996;47(1):1–9. doi: 10.1212/wnl.47.1.1. [DOI] [PubMed] [Google Scholar]
- 6.Williams DR, de Silva R, Paviour DC, et al. Characteristics of two distinct clinical phenotypes in pathologically proven progressive supranuclear palsy: Richardson's syndrome and PSP-parkinsonism. Brain. 2005;128(Pt 6):1247–1258. doi: 10.1093/brain/awh488. [DOI] [PubMed] [Google Scholar]
- 7.Williams DR, Holton JL, Strand K, Revesz T, Lees AJ. Pure akinesia with gait freezing: a third clinical phenotype of progressive supranuclear palsy. Mov Disord. 2007;22(15):2235–2241. doi: 10.1002/mds.21698. [DOI] [PubMed] [Google Scholar]
- 8.Hassan A, Parisi JE, Josephs KA. Autopsy-proven progressive supranuclear palsy presenting as behavioral variant frontotemporal dementia. Neurocase. 2012;18(6):478–488. doi: 10.1080/13554794.2011.627345. [DOI] [PubMed] [Google Scholar]
- 9.Josephs KA, Duffy JR, Strand EA, et al. Clinicopathological and imaging correlates of progressive aphasia and apraxia of speech. Brain. 2006;129(Pt 6):1385–1398. doi: 10.1093/brain/awl078. [DOI] [PMC free article] [PubMed] [Google Scholar]
- 10.Tsuboi Y, Josephs KA, Boeve BF, et al. Increased tau burden in the cortices of progressive supranuclear palsy presenting with corticobasal syndrome. Mov Disord. 2005;20(8):982–988. doi: 10.1002/mds.20478. [DOI] [PubMed] [Google Scholar]
- 11.Hoglinger GU, Respondek G, Stamelou M, et al. Clinical Diagnostic Criteria for Progressive Supranuclear Palsy of the Movement Disorder Society. Mov Disord. 2017 In Press. [Google Scholar]
- 12.Kato N, Arai K, Hattori T. Study of the rostral midbrain atrophy in progressive supranuclear palsy. J Neurol Sci. 2003;210(1-2):57–60. doi: 10.1016/s0022-510x(03)00014-5. [DOI] [PubMed] [Google Scholar]
- 13.Massey LA, Micallef C, Paviour DC, et al. Conventional magnetic resonance imaging in confirmed progressive supranuclear palsy and multiple system atrophy. Mov Disord. 2012;27(14):1754–1762. doi: 10.1002/mds.24968. [DOI] [PubMed] [Google Scholar]
- 14.Adachi M, Kawanami T, Ohshima H, Sugai Y, Hosoya T. Morning glory sign: a particular MR finding in progressive supranuclear palsy. Magn Reson Med Sci. 2004;3(3):125–132. doi: 10.2463/mrms.3.125. [DOI] [PubMed] [Google Scholar]
- 15.Cosottini M, Ceravolo R, Faggioni L, et al. Assessment of midbrain atrophy in patients with progressive supranuclear palsy with routine magnetic resonance imaging. Acta Neurol Scand. 2007;116(1):37–42. doi: 10.1111/j.1600-0404.2006.00767.x. [DOI] [PubMed] [Google Scholar]
- 16.Oba H, Yagishita A, Terada H, et al. New and reliable MRI diagnosis for progressive supranuclear palsy. Neurology. 2005;64(12):2050–2055. doi: 10.1212/01.WNL.0000165960.04422.D0. [DOI] [PubMed] [Google Scholar]
- 17.Zanigni S, Calandra-Buonaura G, Manners DN, et al. Accuracy of MR markers for differentiating Progressive Supranuclear Palsy from Parkinson's disease. Neuroimage Clin. 2016;11:736–742. doi: 10.1016/j.nicl.2016.05.016. [DOI] [PMC free article] [PubMed] [Google Scholar]
- 18.Asato R, Akiguchi I, Masunaga S, Hashimoto N. Magnetic resonance imaging distinguishes progressive supranuclear palsy from multiple system atrophy. J Neural Transm (Vienna) 2000;107(12):1427–1436. doi: 10.1007/s007020070006. [DOI] [PubMed] [Google Scholar]
- 19.Massey LA, Jager HR, Paviour DC, et al. The midbrain to pons ratio: a simple and specific MRI sign of progressive supranuclear palsy. Neurology. 2013;80(20):1856–1861. doi: 10.1212/WNL.0b013e318292a2d2. [DOI] [PMC free article] [PubMed] [Google Scholar]
- 20.Schrag A, Good CD, Miszkiel K, et al. Differentiation of atypical parkinsonian syndromes with routine MRI. Neurology. 2000;54(3):697–702. doi: 10.1212/wnl.54.3.697. [DOI] [PubMed] [Google Scholar]
- 21.Kim YE, Kang SY, Ma HI, Ju YS, Kim YJ. A Visual Rating Scale for the Hummingbird Sign with Adjustable Diagnostic Validity. J Parkinsons Dis. 2015;5(3):605–612. doi: 10.3233/JPD-150537. [DOI] [PubMed] [Google Scholar]
- 22.Kim YH, Ma HI, Kim YJ. Utility of the Midbrain Tegmentum Diameter in the Differential Diagnosis of Progressive Supranuclear Palsy from Idiopathic Parkinson's Disease. J Clin Neurol. 2015;11(3):268–274. doi: 10.3988/jcn.2015.11.3.268. [DOI] [PMC free article] [PubMed] [Google Scholar]
- 23.Owens E, Krecke K, Ahlskog JE, et al. Highly specific radiographic marker predates clinical diagnosis in progressive supranuclear palsy. Parkinsonism Relat Disord. 2016;28:107–111. doi: 10.1016/j.parkreldis.2016.05.006. [DOI] [PubMed] [Google Scholar]
- 24.Paviour DC, Price SL, Jahanshahi M, Lees AJ, Fox NC. Regional brain volumes distinguish PSP, MSA-P, and PD: MRI-based clinico-radiological correlations. Mov Disord. 2006;21(7):989–996. doi: 10.1002/mds.20877. [DOI] [PubMed] [Google Scholar]
- 25.Righini A, Antonini A, De Notaris R, et al. MR imaging of the superior profile of the midbrain: differential diagnosis between progressive supranuclear palsy and Parkinson disease. AJNR Am J Neuroradiol. 2004;25(6):927–932. [PMC free article] [PubMed] [Google Scholar]
- 26.Barsottini OG, Ferraz HB, Maia AC, Jr, Silva CJ, Rocha AJ. Differentiation of Parkinson's disease and progressive supranuclear palsy with magnetic resonance imaging: the first Brazilian experience. Parkinsonism Relat Disord. 2007;13(7):389–393. doi: 10.1016/j.parkreldis.2006.12.011. [DOI] [PubMed] [Google Scholar]
- 27.Choi SM, Kim BC, Nam TS, et al. Midbrain atrophy in vascular Parkinsonism. Eur Neurol. 2011;65(5):296–301. doi: 10.1159/000326907. [DOI] [PMC free article] [PubMed] [Google Scholar]
- 28.Messina D, Cerasa A, Condino F, et al. Patterns of brain atrophy in Parkinson's disease, progressive supranuclear palsy and multiple system atrophy. Parkinsonism Relat Disord. 2011;17(3):172–176. doi: 10.1016/j.parkreldis.2010.12.010. [DOI] [PubMed] [Google Scholar]
- 29.Slowinski J, Imamura A, Uitti RJ, et al. MR imaging of brainstem atrophy in progressive supranuclear palsy. J Neurol. 2008;255(1):37–44. doi: 10.1007/s00415-007-0656-y. [DOI] [PubMed] [Google Scholar]
- 30.Warmuth-Metz M, Naumann M, Csoti I, Solymosi L. Measurement of the midbrain diameter on routine magnetic resonance imaging: a simple and accurate method of differentiating between Parkinson disease and progressive supranuclear palsy. Arch Neurol. 2001;58(7):1076–1079. doi: 10.1001/archneur.58.7.1076. [DOI] [PubMed] [Google Scholar]
- 31.Yagishita A, Oda M. Progressive supranuclear palsy: MRI and pathological findings. Neuroradiology. 1996;38(Suppl 1):S60–66. doi: 10.1007/BF02278121. [DOI] [PubMed] [Google Scholar]
- 32.Moller L, Kassubek J, Sudmeyer M, et al. Manual MRI morphometry in Parkinsonian syndromes. Mov Disord. 2017 doi: 10.1002/mds.26921. IN PRESS. [DOI] [PubMed] [Google Scholar]
- 33.Price S, Paviour D, Scahill R, et al. Voxel-based morphometry detects patterns of atrophy that help differentiate progressive supranuclear palsy and Parkinson's disease. Neuroimage. 2004;23(2):663–669. doi: 10.1016/j.neuroimage.2004.06.013. [DOI] [PubMed] [Google Scholar]
- 34.Mori H, Aoki S, Ohtomo K. Morning glory sign is not prevalent in progressive supranuclear palsy. Magn Reson Med Sci. 2004;3(4):215. doi: 10.2463/mrms.3.215. author reply 216-217. [DOI] [PubMed] [Google Scholar]
- 35.Adachi M, Kawanami T, Ohshima F. The “morning glory sign” should be evaluated using thinly sliced axial images. Magn Reson Med Sci. 2007;6(1):59–60. doi: 10.2463/mrms.6.59. [DOI] [PubMed] [Google Scholar]
- 36.Mori H, Aoki S, Ohtomo K. The “morning glory sign” may lead to false impression according to slice angle. Magn Reson Med Sci. 2007;6(3):183–184. doi: 10.2463/mrms.6.183. author reply 185. [DOI] [PubMed] [Google Scholar]
- 37.Morelli M, Arabia G, Salsone M, et al. Accuracy of magnetic resonance parkinsonism index for differentiation of progressive supranuclear palsy from probable or possible Parkinson disease. Mov Disord. 2011;26(3):527–533. doi: 10.1002/mds.23529. [DOI] [PubMed] [Google Scholar]
- 38.Quattrone A, Nicoletti G, Messina D, et al. MR imaging index for differentiation of progressive supranuclear palsy from Parkinson disease and the Parkinson variant of multiple system atrophy. Radiology. 2008;246(1):214–221. doi: 10.1148/radiol.2453061703. [DOI] [PubMed] [Google Scholar]
- 39.Longoni G, Agosta F, Kostic VS, et al. MRI measurements of brainstem structures in patients with Richardson's syndrome, progressive supranuclear palsy-parkinsonism, and Parkinson's disease. Mov Disord. 2011;26(2):247–255. doi: 10.1002/mds.23293. [DOI] [PubMed] [Google Scholar]
- 40.Sankhla CS, Patil KB, Sawant N, Gupta S. Diagnostic accuracy of Magnetic Resonance Parkinsonism Index in differentiating progressive supranuclear palsy from Parkinson's disease and controls in Indian patients. Neurol India. 2016;64(2):239–245. doi: 10.4103/0028-3886.177611. [DOI] [PubMed] [Google Scholar]
- 41.Hussl A, Mahlknecht P, Scherfler C, et al. Diagnostic accuracy of the magnetic resonance Parkinsonism index and the midbrain-to-pontine area ratio to differentiate progressive supranuclear palsy from Parkinson's disease and the Parkinson variant of multiple system atrophy. Mov Disord. 2010;25(14):2444–2449. doi: 10.1002/mds.23351. [DOI] [PubMed] [Google Scholar]
- 42.Paviour DC, Price SL, Stevens JM, Lees AJ, Fox NC. Quantitative MRI measurement of superior cerebellar peduncle in progressive supranuclear palsy. Neurology. 2005;64(4):675–679. doi: 10.1212/01.WNL.0000151854.85743.C7. [DOI] [PubMed] [Google Scholar]
- 43.Nigro S, Arabia G, Antonini A, et al. Magnetic Resonance Parkinsonism Index: diagnostic accuracy of a fully automated algorithm in comparison with the manual measurement in a large Italian multicentre study in patients with progressive supranuclear palsy. Eur Radiol. 2016 doi: 10.1007/s00330-016-4622-x. [DOI] [PubMed] [Google Scholar]
- 44.Mostile G, Nicoletti A, Cicero CE, et al. Magnetic resonance parkinsonism index in progressive supranuclear palsy and vascular parkinsonism. Neurol Sci. 2016;37(4):591–595. doi: 10.1007/s10072-016-2489-x. [DOI] [PubMed] [Google Scholar]
- 45.Borroni B, Malinverno M, Gardoni F, et al. A combination of CSF tau ratio and midsaggital midbrain-to-pons atrophy for the early diagnosis of progressive supranuclear palsy. J Alzheimers Dis. 2010;22(1):195–203. doi: 10.3233/JAD-2010-100333. [DOI] [PubMed] [Google Scholar]
- 46.Morelli M, Arabia G, Messina D, et al. Effect of aging on magnetic resonance measures differentiating progressive supranuclear palsy from Parkinson's disease. Mov Disord. 2014;29(4):488–495. doi: 10.1002/mds.25821. [DOI] [PubMed] [Google Scholar]
- 47.Iglesias JE, Van Leemput K, Bhatt P, et al. Bayesian segmentation of brainstem structures in MRI. Neuroimage. 2015;113:184–195. doi: 10.1016/j.neuroimage.2015.02.065. [DOI] [PMC free article] [PubMed] [Google Scholar]
- 48.Morelli M, Arabia G, Novellino F, et al. MRI measurements predict PSP in unclassifiable parkinsonisms: a cohort study. Neurology. 2011;77(11):1042–1047. doi: 10.1212/WNL.0b013e31822e55d0. [DOI] [PubMed] [Google Scholar]
- 49.Josephs KA, Dickson DW. Diagnostic accuracy of progressive supranuclear palsy in the Society for Progressive Supranuclear Palsy brain bank. Mov Disord. 2003;18(9):1018–1026. doi: 10.1002/mds.10488. [DOI] [PubMed] [Google Scholar]
- 50.Respondek G, Roeber S, Kretzschmar H, et al. Accuracy of the National Institute for Neurological Disorders and Stroke/Society for Progressive Supranuclear Palsy and neuroprotection and natural history in Parkinson plus syndromes criteria for the diagnosis of progressive supranuclear palsy. Mov Disord. 2013;28(4):504–509. doi: 10.1002/mds.25327. [DOI] [PubMed] [Google Scholar]
- 51.Whitwell JL, Jack CR, Jr, Parisi JE, et al. Midbrain atrophy is not a biomarker of progressive supranuclear palsy pathology. Eur J Neurol. 2013;20(10):1417–1422. doi: 10.1111/ene.12212. [DOI] [PMC free article] [PubMed] [Google Scholar]
- 52.Whitwell JL, Jack CR, Jr, Boeve BF, et al. Imaging correlates of pathology in corticobasal syndrome. Neurology. 2010;75(21):1879–1887. doi: 10.1212/WNL.0b013e3181feb2e8. [DOI] [PMC free article] [PubMed] [Google Scholar]
- 53.Josephs KA, Duffy JR, Strand EA, et al. Characterizing a neurodegenerative syndrome: primary progressive apraxia of speech. Brain. 2012;135(Pt 5):1522–1536. doi: 10.1093/brain/aws032. [DOI] [PMC free article] [PubMed] [Google Scholar]
- 54.Santos-Santos MA, Mandelli ML, Binney RJ, et al. Features of Patients With Nonfluent/Agrammatic Primary Progressive Aphasia With Underlying Progressive Supranuclear Palsy Pathology or Corticobasal Degeneration. JAMA Neurol. 2016;73(6):733–742. doi: 10.1001/jamaneurol.2016.0412. [DOI] [PMC free article] [PubMed] [Google Scholar]
- 55.Rohrer JD, Paviour D, Bronstein AM, O'Sullivan SS, Lees A, Warren JD. Progressive supranuclear palsy syndrome presenting as progressive nonfluent aphasia: a neuropsychological and neuroimaging analysis. Mov Disord. 2010;25(2):179–188. doi: 10.1002/mds.22946. [DOI] [PMC free article] [PubMed] [Google Scholar]
- 56.Whitwell JL, Duffy JR, Strand EA, et al. Neuroimaging comparison of primary progressive apraxia of speech and progressive supranuclear palsy. Eur J Neurol. 2013;20(4):629–637. doi: 10.1111/ene.12004. [DOI] [PMC free article] [PubMed] [Google Scholar]
- 57.Agosta F, Kostic VS, Galantucci S, et al. The in vivo distribution of brain tissue loss in Richardson's syndrome and PSP-parkinsonism: a VBM-DARTEL study. Eur J Neurosci. 2010;32(4):640–647. doi: 10.1111/j.1460-9568.2010.07304.x. [DOI] [PubMed] [Google Scholar]
- 58.Pasha SA, Yadav R, Ganeshan M, et al. Correlation between qualitative balance indices, dynamic posturography and structural brain imaging in patients with progressive supranuclear palsy and its subtypes. Neurol India. 2016;64(4):633–639. doi: 10.4103/0028-3886.185417. [DOI] [PubMed] [Google Scholar]
- 59.Quattrone A, Morelli M, Williams DR, et al. MR parkinsonism index predicts vertical supranuclear gaze palsy in patients with PSP-parkinsonism. Neurology. 2016;87(12):1266–1273. doi: 10.1212/WNL.0000000000003125. [DOI] [PMC free article] [PubMed] [Google Scholar]
- 60.Boxer AL, Geschwind MD, Belfor N, et al. Patterns of brain atrophy that differentiate corticobasal degeneration syndrome from progressive supranuclear palsy. Arch Neurol. 2006;63(1):81–86. doi: 10.1001/archneur.63.1.81. [DOI] [PubMed] [Google Scholar]
- 61.Brenneis C, Seppi K, Schocke M, Benke T, Wenning GK, Poewe W. Voxel based morphometry reveals a distinct pattern of frontal atrophy in progressive supranuclear palsy. J Neurol Neurosurg Psychiatry. 2004;75(2):246–249. [PMC free article] [PubMed] [Google Scholar]
- 62.Josephs KA, Whitwell JL, Dickson DW, et al. Voxel-based morphometry in autopsy proven PSP and CBD. Neurobiol Aging. 2008;29(2):280–289. doi: 10.1016/j.neurobiolaging.2006.09.019. [DOI] [PMC free article] [PubMed] [Google Scholar]
- 63.Whitwell JL, Avula R, Master A, et al. Disrupted thalamocortical connectivity in PSP: a resting state fMRI, DTI, and VBM study. Parkinsonism Relat Disord. 2011;17(8):599–605. doi: 10.1016/j.parkreldis.2011.05.013. [DOI] [PMC free article] [PubMed] [Google Scholar]
- 64.Cordato NJ, Pantelis C, Halliday GM, et al. Frontal atrophy correlates with behavioural changes in progressive supranuclear palsy. Brain. 2002;125(Pt 4):789–800. doi: 10.1093/brain/awf082. [DOI] [PubMed] [Google Scholar]
- 65.Josephs KA, Whitwell JL, Eggers SD, Senjem ML, Jack CR., Jr Gray matter correlates of behavioral severity in progressive supranuclear palsy. Mov Disord. 2011;26(3):493–498. doi: 10.1002/mds.23471. [DOI] [PubMed] [Google Scholar]
- 66.Ghosh BC, Calder AJ, Peers PV, et al. Social cognitive deficits and their neural correlates in progressive supranuclear palsy. Brain. 2012;135(Pt 7):2089–2102. doi: 10.1093/brain/aws128. [DOI] [PMC free article] [PubMed] [Google Scholar]
- 67.Giordano A, Tessitore A, Corbo D, et al. Clinical and cognitive correlations of regional gray matter atrophy in progressive supranuclear palsy. Parkinsonism Relat Disord. 2013;19(6):590–594. doi: 10.1016/j.parkreldis.2013.02.005. [DOI] [PubMed] [Google Scholar]
- 68.Taki M, Ishii K, Fukuda T, Kojima Y, Mori E. Evaluation of cortical atrophy between progressive supranuclear palsy and corticobasal degeneration by hemispheric surface display of MR images. AJNR Am J Neuroradiol. 2004;25(10):1709–1714. [PMC free article] [PubMed] [Google Scholar]
- 69.Lagarde J, Valabregue R, Corvol JC, et al. Are frontal cognitive and atrophy patterns different in PSP and bvFTD? A comparative neuropsychological and VBM study. PLoS One. 2013;8(11):e80353. doi: 10.1371/journal.pone.0080353. [DOI] [PMC free article] [PubMed] [Google Scholar]
- 70.Padovani A, Borroni B, Brambati SM, et al. Diffusion tensor imaging and voxel based morphometry study in early progressive supranuclear palsy. J Neurol Neurosurg Psychiatry. 2006;77(4):457–463. doi: 10.1136/jnnp.2005.075713. [DOI] [PMC free article] [PubMed] [Google Scholar]
- 71.Wang G, Wang J, Zhan J, et al. Quantitative assessment of cerebral gray matter density change in progressive supranuclear palsy using voxel based morphometry analysis and cerebral MR T1-weighted FLAIR imaging. J Neurol Sci. 2015;359(1-2):367–372. doi: 10.1016/j.jns.2015.11.007. [DOI] [PubMed] [Google Scholar]
- 72.Worker A, Blain C, Jarosz J, et al. Cortical thickness, surface area and volume measures in Parkinson's disease, multiple system atrophy and progressive supranuclear palsy. PLoS One. 2014;9(12):e114167. doi: 10.1371/journal.pone.0114167. [DOI] [PMC free article] [PubMed] [Google Scholar]
- 73.Sandhya M, Saini J, Pasha SA, Yadav R, Pal PK. A voxel based comparative analysis using magnetization transfer imaging and T1-weighted magnetic resonance imaging in progressive supranuclear palsy. Ann Indian Acad Neurol. 2014;17(2):193–198. doi: 10.4103/0972-2327.132626. [DOI] [PMC free article] [PubMed] [Google Scholar]
- 74.Cordato NJ, Duggins AJ, Halliday GM, Morris JG, Pantelis C. Clinical deficits correlate with regional cerebral atrophy in progressive supranuclear palsy. Brain. 2005;128(Pt 6):1259–1266. doi: 10.1093/brain/awh508. [DOI] [PubMed] [Google Scholar]
- 75.Guevara C, Bulatova K, Barker GJ, Gonzalez G, Crossley NA, Kempton MJ. Whole-Brain Atrophy Differences between Progressive Supranuclear Palsy and Idiopathic Parkinson's Disease. Front Aging Neurosci. 2016;8:218. doi: 10.3389/fnagi.2016.00218. [DOI] [PMC free article] [PubMed] [Google Scholar]
- 76.Josephs KA, Eggers SD, Jack CR, Jr, Whitwell JL. Neuroanatomical correlates of the progressive supranuclear palsy corticobasal syndrome hybrid. Eur J Neurol. 2012;19(11):1440–1446. doi: 10.1111/j.1468-1331.2012.03726.x. [DOI] [PubMed] [Google Scholar]
- 77.Lee SE, Rabinovici GD, Mayo MC, et al. Clinicopathological correlations in corticobasal degeneration. Ann Neurol. 2011;70(2):327–340. doi: 10.1002/ana.22424. [DOI] [PMC free article] [PubMed] [Google Scholar]
- 78.Josephs KA, Boeve BF, Duffy JR, et al. Atypical progressive supranuclear palsy underlying progressive apraxia of speech and nonfluent aphasia. Neurocase. 2005;11(4):283–296. doi: 10.1080/13554790590963004. [DOI] [PubMed] [Google Scholar]
- 79.Hong JY, Yun HJ, Sunwoo MK, et al. Comparison of regional brain atrophy and cognitive impairment between pure akinesia with gait freezing and Richardson's syndrome. Front Aging Neurosci. 2015;7:180. doi: 10.3389/fnagi.2015.00180. [DOI] [PMC free article] [PubMed] [Google Scholar]
- 80.Looi JC, Macfarlane MD, Walterfang M, et al. Morphometric analysis of subcortical structures in progressive supranuclear palsy: In vivo evidence of neostriatal and mesencephalic atrophy. Psychiatry Res. 2011;194(2):163–175. doi: 10.1016/j.pscychresns.2011.07.013. [DOI] [PMC free article] [PubMed] [Google Scholar]
- 81.Saini J, Bagepally BS, Sandhya M, et al. Subcortical structures in progressive supranuclear palsy: vertex-based analysis. Eur J Neurol. 2013;20(3):493–501. doi: 10.1111/j.1468-1331.2012.03884.x. [DOI] [PubMed] [Google Scholar]
- 82.Schulz JB, Skalej M, Wedekind D, et al. Magnetic resonance imaging-based volumetry differentiates idiopathic Parkinson's syndrome from multiple system atrophy and progressive supranuclear palsy. Ann Neurol. 1999;45(1):65–74. [PubMed] [Google Scholar]
- 83.Huey ED, Pardini M, Cavanagh A, et al. Association of ideomotor apraxia with frontal gray matter volume loss in corticobasal syndrome. Arch Neurol. 2009;66(10):1274–1280. doi: 10.1001/archneurol.2009.218. [DOI] [PMC free article] [PubMed] [Google Scholar]
- 84.Han YH, Lee JH, Kang BM, et al. Topographical differences of brain iron deposition between progressive supranuclear palsy and parkinsonian variant multiple system atrophy. J Neurol Sci. 2013;325(1-2):29–35. doi: 10.1016/j.jns.2012.11.009. [DOI] [PubMed] [Google Scholar]
- 85.Gupta D, Saini J, Kesavadas C, Sarma PS, Kishore A. Utility of susceptibility-weighted MRI in differentiating Parkinson's disease and atypical parkinsonism. Neuroradiology. 2010;52(12):1087–1094. doi: 10.1007/s00234-010-0677-6. [DOI] [PubMed] [Google Scholar]
- 86.Boelmans K, Holst B, Hackius M, et al. Brain iron deposition fingerprints in Parkinson's disease and progressive supranuclear palsy. Mov Disord. 2012;27(3):421–427. doi: 10.1002/mds.24926. [DOI] [PubMed] [Google Scholar]
- 87.Lee JH, Han YH, Kang BM, Mun CW, Lee SJ, Baik SK. Quantitative assessment of subcortical atrophy and iron content in progressive supranuclear palsy and parkinsonian variant of multiple system atrophy. J Neurol. 2013;260(8):2094–2101. doi: 10.1007/s00415-013-6951-x. [DOI] [PubMed] [Google Scholar]
- 88.Kraft E, Schwarz J, Trenkwalder C, Vogl T, Pfluger T, Oertel WH. The combination of hypointense and hyperintense signal changes on T2-weighted magnetic resonance imaging sequences: a specific marker of multiple system atrophy? Arch Neurol. 1999;56(2):225–228. doi: 10.1001/archneur.56.2.225. [DOI] [PubMed] [Google Scholar]
- 89.Jesse S, Kassubek J, Muller HP, Ludolph AC, Unrath A. Signal alterations of the basal ganglia in the differential diagnosis of Parkinson's disease: a retrospective case-controlled MRI data bank analysis. BMC Neurol. 2012;12:163. doi: 10.1186/1471-2377-12-163. [DOI] [PMC free article] [PubMed] [Google Scholar]
- 90.Arabia G, Morelli M, Paglionico S, et al. An magnetic resonance imaging T2*-weighted sequence at short echo time to detect putaminal hypointensity in Parkinsonisms. Mov Disord. 2010;25(16):2728–2734. doi: 10.1002/mds.23173. [DOI] [PubMed] [Google Scholar]
- 91.Kataoka H, Tonomura Y, Taoka T, Ueno S. Signal changes of superior cerebellar peduncle on fluid-attenuated inversion recovery in progressive supranuclear palsy. Parkinsonism Relat Disord. 2008;14(1):63–65. doi: 10.1016/j.parkreldis.2007.03.001. [DOI] [PubMed] [Google Scholar]
- 92.Oka M, Katayama S, Imon Y, Ohshita T, Mimori Y, Nakamura S. Abnormal signals on proton density-weighted MRI of the superior cerebellar peduncle in progressive supranuclear palsy. Acta Neurol Scand. 2001;104(1):1–5. doi: 10.1034/j.1600-0404.2001.00262.x. [DOI] [PubMed] [Google Scholar]
- 93.Groschel K, Hauser TK, Luft A, et al. Magnetic resonance imaging-based volumetry differentiates progressive supranuclear palsy from corticobasal degeneration. Neuroimage. 2004;21(2):714–724. doi: 10.1016/j.neuroimage.2003.09.070. [DOI] [PubMed] [Google Scholar]
- 94.Cherubini A, Morelli M, Nistico R, et al. Magnetic resonance support vector machine discriminates between Parkinson disease and progressive supranuclear palsy. Mov Disord. 2014;29(2):266–269. doi: 10.1002/mds.25737. [DOI] [PubMed] [Google Scholar]
- 95.Duchesne S, Rolland Y, Verin M. Automated computer differential classification in Parkinsonian Syndromes via pattern analysis on MRI. Acad Radiol. 2009;16(1):61–70. doi: 10.1016/j.acra.2008.05.024. [DOI] [PubMed] [Google Scholar]
- 96.Focke NK, Helms G, Scheewe S, et al. Individual voxel-based subtype prediction can differentiate progressive supranuclear palsy from idiopathic Parkinson syndrome and healthy controls. Hum Brain Mapp. 2011;32(11):1905–1915. doi: 10.1002/hbm.21161. [DOI] [PMC free article] [PubMed] [Google Scholar]
- 97.Huppertz HJ, Moller L, Sudmeyer M, et al. Differentiation of neurodegenerative parkinsonian syndromes by volumetric magnetic resonance imaging analysis and support vector machine classification. Mov Disord. 2016;31(10):1506–1517. doi: 10.1002/mds.26715. [DOI] [PubMed] [Google Scholar]
- 98.Marquand AF, Filippone M, Ashburner J, et al. Automated, high accuracy classification of Parkinsonian disorders: a pattern recognition approach. PLoS One. 2013;8(7):e69237. doi: 10.1371/journal.pone.0069237. [DOI] [PMC free article] [PubMed] [Google Scholar]
- 99.Salvatore C, Cerasa A, Castiglioni I, et al. Machine learning on brain MRI data for differential diagnosis of Parkinson's disease and Progressive Supranuclear Palsy. J Neurosci Methods. 2014;222:230–237. doi: 10.1016/j.jneumeth.2013.11.016. [DOI] [PubMed] [Google Scholar]
- 100.Scherfler C, Gobel G, Muller C, et al. Diagnostic potential of automated subcortical volume segmentation in atypical parkinsonism. Neurology. 2016;86(13):1242–1249. doi: 10.1212/WNL.0000000000002518. [DOI] [PubMed] [Google Scholar]
- 101.Baudrexel S, Seifried C, Penndorf B, et al. The value of putaminal diffusion imaging versus 18-fluorodeoxyglucose positron emission tomography for the differential diagnosis of the Parkinson variant of multiple system atrophy. Mov Disord. 2014;29(3):380–387. doi: 10.1002/mds.25749. [DOI] [PubMed] [Google Scholar]
- 102.Nicoletti G, Lodi R, Condino F, et al. Apparent diffusion coefficient measurements of the middle cerebellar peduncle differentiate the Parkinson variant of MSA from Parkinson's disease and progressive supranuclear palsy. Brain. 2006;129(Pt 10):2679–2687. doi: 10.1093/brain/awl166. [DOI] [PubMed] [Google Scholar]
- 103.Nicoletti G, Tonon C, Lodi R, et al. Apparent diffusion coefficient of the superior cerebellar peduncle differentiates progressive supranuclear palsy from Parkinson's disease. Mov Disord. 2008;23(16):2370–2376. doi: 10.1002/mds.22279. [DOI] [PubMed] [Google Scholar]
- 104.Ohshita T, Oka M, Imon Y, Yamaguchi S, Mimori Y, Nakamura S. Apparent diffusion coefficient measurements in progressive supranuclear palsy. Neuroradiology. 2000;42(9):643–647. doi: 10.1007/s002340000372. [DOI] [PubMed] [Google Scholar]
- 105.Paviour DC, Thornton JS, Lees AJ, Jager HR. Diffusion-weighted magnetic resonance imaging differentiates Parkinsonian variant of multiple-system atrophy from progressive supranuclear palsy. Mov Disord. 2007;22(1):68–74. doi: 10.1002/mds.21204. [DOI] [PubMed] [Google Scholar]
- 106.Tsukamoto K, Matsusue E, Kanasaki Y, et al. Significance of apparent diffusion coefficient measurement for the differential diagnosis of multiple system atrophy, progressive supranuclear palsy, and Parkinson's disease: evaluation by 3.0-T MR imaging. Neuroradiology. 2012 doi: 10.1007/s00234-012-1009-9. [DOI] [PubMed] [Google Scholar]
- 107.Seppi K, Schocke MF, Esterhammer R, et al. Diffusion-weighted imaging discriminates progressive supranuclear palsy from PD, but not from the parkinson variant of multiple system atrophy. Neurology. 2003;60(6):922–927. doi: 10.1212/01.wnl.0000049911.91657.9d. [DOI] [PubMed] [Google Scholar]
- 108.Prodoehl J, Li H, Planetta PJ, et al. Diffusion tensor imaging of Parkinson's disease, atypical parkinsonism, and essential tremor. Mov Disord. 2013;28(13):1816–1822. doi: 10.1002/mds.25491. [DOI] [PMC free article] [PubMed] [Google Scholar]
- 109.Wadia PM, Howard P, Ribeirro MQ, et al. The value of GRE, ADC and routine MRI in distinguishing Parkinsonian disorders. Can J Neurol Sci. 2013;40(3):389–402. doi: 10.1017/s0317167100014360. [DOI] [PubMed] [Google Scholar]
- 110.Nicoletti G, Rizzo G, Barbagallo G, et al. Diffusivity of cerebellar hemispheres enables discrimination of cerebellar or parkinsonian multiple system atrophy from progressive supranuclear palsy-Richardson syndrome and Parkinson disease. Radiology. 2013;267(3):843–850. doi: 10.1148/radiol.12120364. [DOI] [PubMed] [Google Scholar]
- 111.Canu E, Agosta F, Baglio F, Galantucci S, Nemni R, Filippi M. Diffusion tensor magnetic resonance imaging tractography in progressive supranuclear palsy. Mov Disord. 2011;26(9):1752–1755. doi: 10.1002/mds.23739. [DOI] [PubMed] [Google Scholar]
- 112.Erbetta A, Mandelli ML, Savoiardo M, et al. Diffusion tensor imaging shows different topographic involvement of the thalamus in progressive supranuclear palsy and corticobasal degeneration. AJNR Am J Neuroradiol. 2009;30(8):1482–1487. doi: 10.3174/ajnr.A1615. [DOI] [PMC free article] [PubMed] [Google Scholar]
- 113.Ito S, Makino T, Shirai W, Hattori T. Diffusion tensor analysis of corpus callosum in progressive supranuclear palsy. Neuroradiology. 2008;50(11):981–985. doi: 10.1007/s00234-008-0447-x. [DOI] [PubMed] [Google Scholar]
- 114.Knake S, Belke M, Menzler K, et al. In vivo demonstration of microstructural brain pathology in progressive supranuclear palsy: a DTI study using TBSS. Mov Disord. 2010;25(9):1232–1238. doi: 10.1002/mds.23054. [DOI] [PubMed] [Google Scholar]
- 115.Meijer FJ, van Rumund A, Tuladhar AM, et al. Conventional 3T brain MRI and diffusion tensor imaging in the diagnostic workup of early stage parkinsonism. Neuroradiology. 2015;57(7):655–669. doi: 10.1007/s00234-015-1515-7. [DOI] [PMC free article] [PubMed] [Google Scholar]
- 116.Piattella MC, Upadhyay N, Bologna M, et al. Neuroimaging evidence of gray and white matter damage and clinical correlates in progressive supranuclear palsy. J Neurol. 2015;262(8):1850–1858. doi: 10.1007/s00415-015-7779-3. [DOI] [PubMed] [Google Scholar]
- 117.Saini J, Bagepally BS, Sandhya M, Pasha SA, Yadav R, Pal PK. In vivo evaluation of white matter pathology in patients of progressive supranuclear palsy using TBSS. Neuroradiology. 2012;54(7):771–780. doi: 10.1007/s00234-011-0983-7. [DOI] [PubMed] [Google Scholar]
- 118.Surova Y, Nilsson M, Latt J, et al. Disease-specific structural changes in thalamus and dentatorubrothalamic tract in progressive supranuclear palsy. Neuroradiology. 2015;57(11):1079–1091. doi: 10.1007/s00234-015-1563-z. [DOI] [PMC free article] [PubMed] [Google Scholar]
- 119.Tessitore A, Giordano A, Caiazzo G, et al. Clinical correlations of microstructural changes in progressive supranuclear palsy. Neurobiol Aging. 2014;35(10):2404–2410. doi: 10.1016/j.neurobiolaging.2014.03.028. [DOI] [PubMed] [Google Scholar]
- 120.Wang J, Wai Y, Lin WY, et al. Microstructural changes in patients with progressive supranuclear palsy: a diffusion tensor imaging study. J Magn Reson Imaging. 2010;32(1):69–75. doi: 10.1002/jmri.22229. [DOI] [PubMed] [Google Scholar]
- 121.Whitwell JL, Master AV, Avula R, et al. Clinical correlates of white matter tract degeneration in progressive supranuclear palsy. Arch Neurol. 2011;68(6):753–760. doi: 10.1001/archneurol.2011.107. [DOI] [PMC free article] [PubMed] [Google Scholar]
- 122.Worker A, Blain C, Jarosz J, et al. Diffusion tensor imaging of Parkinson's disease, multiple system atrophy and progressive supranuclear palsy: a tract-based spatial statistics study. PLoS One. 2014;9(11):e112638. doi: 10.1371/journal.pone.0112638. [DOI] [PMC free article] [PubMed] [Google Scholar]
- 123.Coon EA, Whitwell JL, Jack CR, Jr, Josephs KA. Primary lateral sclerosis as progressive supranuclear palsy: diagnosis by diffusion tensor imaging. Mov Disord. 2012;27(7):903–906. doi: 10.1002/mds.24990. [DOI] [PMC free article] [PubMed] [Google Scholar]
- 124.Whitwell JL, Xu J, Mandrekar J, Gunter JL, Jack CR, Jr, Josephs KA. Imaging measures predict progression in progressive supranuclear palsy. Mov Disord. 2012;27(14):1801–1804. doi: 10.1002/mds.24970. [DOI] [PubMed] [Google Scholar]
- 125.Agosta F, Galantucci S, Svetel M, et al. Clinical, cognitive, and behavioural correlates of white matter damage in progressive supranuclear palsy. J Neurol. 2014;261(5):913–924. doi: 10.1007/s00415-014-7301-3. [DOI] [PubMed] [Google Scholar]
- 126.Blain CR, Barker GJ, Jarosz JM, et al. Measuring brain stem and cerebellar damage in parkinsonian syndromes using diffusion tensor MRI. Neurology. 2006;67(12):2199–2205. doi: 10.1212/01.wnl.0000249307.59950.f8. [DOI] [PubMed] [Google Scholar]
- 127.Rosskopf J, Muller HP, Huppertz HJ, Ludolph AC, Pinkhardt EH, Kassubek J. Frontal corpus callosum alterations in progressive supranuclear palsy but not in Parkinson's disease. Neurodegener Dis. 2014;14(4):184–193. doi: 10.1159/000367693. [DOI] [PubMed] [Google Scholar]
- 128.Agosta F, Pievani M, Svetel M, et al. Diffusion tensor MRI contributes to differentiate Richardson's syndrome from PSP-parkinsonism. Neurobiol Aging. 2012;33(12):2817–2826. doi: 10.1016/j.neurobiolaging.2012.02.002. [DOI] [PubMed] [Google Scholar]
- 129.Sajjadi SA, Acosta-Cabronero J, Patterson K, Diaz-de-Grenu LZ, Williams GB, Nestor PJ. Diffusion tensor magnetic resonance imaging for single subject diagnosis in neurodegenerative diseases. Brain. 2013;136(Pt 7):2253–2261. doi: 10.1093/brain/awt118. [DOI] [PubMed] [Google Scholar]
- 130.Upadhyay N, Suppa A, Piattella MC, et al. MRI gray and white matter measures in progressive supranuclear palsy and corticobasal syndrome. J Neurol. 2016;263(10):2022–2031. doi: 10.1007/s00415-016-8224-y. [DOI] [PubMed] [Google Scholar]
- 131.Whitwell JL, Schwarz CG, Reid RI, Kantarci K, Jack CR, Jr, Josephs KA. Diffusion tensor imaging comparison of progressive supranuclear palsy and corticobasal syndromes. Parkinsonism Relat Disord. 2014;20(5):493–498. doi: 10.1016/j.parkreldis.2014.01.023. [DOI] [PubMed] [Google Scholar]
- 132.Akdemir UO, Tokcaer AB, Karakus A, Kapucu LO. Brain 18F-FDG PET imaging in the differential diagnosis of parkinsonism. Clin Nucl Med. 2014;39(3):e220–226. doi: 10.1097/RLU.0000000000000315. [DOI] [PubMed] [Google Scholar]
- 133.Eckert T, Tang C, Ma Y, et al. Abnormal metabolic networks in atypical parkinsonism. Mov Disord. 2008;23(5):727–733. doi: 10.1002/mds.21933. [DOI] [PubMed] [Google Scholar]
- 134.Garraux G, Salmon E, Degueldre C, Lemaire C, Laureys S, Franck G. Comparison of impaired subcortico-frontal metabolic networks in normal aging, subcortico-frontal dementia, and cortical frontal dementia. Neuroimage. 1999;10(2):149–162. doi: 10.1006/nimg.1999.0463. [DOI] [PubMed] [Google Scholar]
- 135.Hosaka K, Ishii K, Sakamoto S, et al. Voxel-based comparison of regional cerebral glucose metabolism between PSP and corticobasal degeneration. J Neurol Sci. 2002;199(1-2):67–71. doi: 10.1016/s0022-510x(02)00102-8. [DOI] [PubMed] [Google Scholar]
- 136.Juh R, Pae CU, Kim TS, Lee CU, Choe B, Suh T. Cerebral glucose metabolism in corticobasal degeneration comparison with progressive supranuclear palsy using statistical mapping analysis. Neurosci Lett. 2005;383(1-2):22–27. doi: 10.1016/j.neulet.2005.03.057. [DOI] [PubMed] [Google Scholar]
- 137.Mishina M, Ishii K, Mitani K, et al. Midbrain hypometabolism as early diagnostic sign for progressive supranuclear palsy. Acta Neurol Scand. 2004;110(2):128–135. doi: 10.1111/j.1600-0404.2004.00293.x. [DOI] [PubMed] [Google Scholar]
- 138.Nagahama Y, Fukuyama H, Turjanski N, et al. Cerebral glucose metabolism in corticobasal degeneration: comparison with progressive supranuclear palsy and normal controls. Mov Disord. 1997;12(5):691–696. doi: 10.1002/mds.870120510. [DOI] [PubMed] [Google Scholar]
- 139.Salmon E, Van der Linden MV, Franck G. Anterior cingulate and motor network metabolic impairment in progressive supranuclear palsy. Neuroimage. 1997;5(3):173–178. doi: 10.1006/nimg.1997.0262. [DOI] [PubMed] [Google Scholar]
- 140.Takahashi R, Ishii K, Kakigi T, Yokoyama K, Mori E, Murakami T. Brain alterations and mini-mental state examination in patients with progressive supranuclear palsy: voxel-based investigations using f-fluorodeoxyglucose positron emission tomography and magnetic resonance imaging. Dement Geriatr Cogn Dis Extra. 2011;1(1):381–392. doi: 10.1159/000333368. [DOI] [PMC free article] [PubMed] [Google Scholar]
- 141.Teune LK, Bartels AL, de Jong BM, et al. Typical cerebral metabolic patterns in neurodegenerative brain diseases. Mov Disord. 2010;25(14):2395–2404. doi: 10.1002/mds.23291. [DOI] [PubMed] [Google Scholar]
- 142.Yamauchi H, Fukuyama H, Nagahama Y, et al. Atrophy of the corpus callosum, cognitive impairment, and cortical hypometabolism in progressive supranuclear palsy. Ann Neurol. 1997;41(5):606–614. doi: 10.1002/ana.410410509. [DOI] [PubMed] [Google Scholar]
- 143.Zwergal A, la Fougere C, Lorenzl S, et al. Postural imbalance and falls in PSP correlate with functional pathology of the thalamus. Neurology. 2011;77(2):101–109. doi: 10.1212/WNL.0b013e318223c79d. [DOI] [PubMed] [Google Scholar]
- 144.Botha H, Whitwell JL, Madhaven A, Senjem ML, Lowe V, Josephs KA. The pimple sign of progressive supranuclear palsy syndrome. Parkinsonism Relat Disord. 2014;20(2):180–185. doi: 10.1016/j.parkreldis.2013.10.023. [DOI] [PubMed] [Google Scholar]
- 145.Zalewski N, Botha H, Whitwell JL, Lowe V, Dickson DW, Josephs KA. FDG-PET in pathologically confirmed spontaneous 4R-tauopathy variants. J Neurol. 2014;261(4):710–716. doi: 10.1007/s00415-014-7256-4. [DOI] [PubMed] [Google Scholar]
- 146.Klein RC, de Jong BM, de Vries JJ, Leenders KL. Direct comparison between regional cerebral metabolism in progressive supranuclear palsy and Parkinson's disease. Mov Disord. 2005;20(8):1021–1030. doi: 10.1002/mds.20493. [DOI] [PubMed] [Google Scholar]
- 147.Tripathi M, Dhawan V, Peng S, et al. Differential diagnosis of parkinsonian syndromes using F-18 fluorodeoxyglucose positron emission tomography. Neuroradiology. 2013;55(4):483–492. doi: 10.1007/s00234-012-1132-7. [DOI] [PubMed] [Google Scholar]
- 148.Tang CC, Poston KL, Eckert T, et al. Differential diagnosis of parkinsonism: a metabolic imaging study using pattern analysis. Lancet Neurol. 2010;9(2):149–158. doi: 10.1016/S1474-4422(10)70002-8. [DOI] [PMC free article] [PubMed] [Google Scholar]
- 149.Teune LK, Renken RJ, Mudali D, et al. Validation of parkinsonian disease-related metabolic brain patterns. Mov Disord. 2013;28(4):547–551. doi: 10.1002/mds.25361. [DOI] [PubMed] [Google Scholar]
- 150.Garraux G, Phillips C, Schrouff J, et al. Multiclass classification of FDG PET scans for the distinction between Parkinson's disease and atypical parkinsonian syndromes. Neuroimage Clin. 2013;2:883–893. doi: 10.1016/j.nicl.2013.06.004. [DOI] [PMC free article] [PubMed] [Google Scholar]
- 151.Mudali D, Teune LK, Renken RJ, Leenders KL, Roerdink JB. Classification of Parkinsonian syndromes from FDG-PET brain data using decision trees with SSM/PCA features. Comput Math Methods Med. 2015;2015:136921. doi: 10.1155/2015/136921. [DOI] [PMC free article] [PubMed] [Google Scholar]
- 152.Niethammer M, Tang CC, Feigin A, et al. A disease-specific metabolic brain network associated with corticobasal degeneration. Brain. 2014;137(Pt 11):3036–3046. doi: 10.1093/brain/awu256. [DOI] [PMC free article] [PubMed] [Google Scholar]
- 153.Garraux G, Salmon E, Peigneux P, et al. Voxel-based distribution of metabolic impairment in corticobasal degeneration. Mov Disord. 2000;15(5):894–904. doi: 10.1002/1531-8257(200009)15:5<894::aid-mds1021>3.0.co;2-s. [DOI] [PubMed] [Google Scholar]
- 154.Piccini P, de Yebenez J, Lees AJ, et al. Familial progressive supranuclear palsy: detection of subclinical cases using 18F-dopa and 18fluorodeoxyglucose positron emission tomography. Arch Neurol. 2001;58(11):1846–1851. doi: 10.1001/archneur.58.11.1846. [DOI] [PubMed] [Google Scholar]
- 155.Srulijes K, Reimold M, Liscic RM, et al. Fluorodeoxyglucose positron emission tomography in Richardson's syndrome and progressive supranuclear palsy-parkinsonism. Mov Disord. 2012;27(1):151–155. doi: 10.1002/mds.23975. [DOI] [PubMed] [Google Scholar]
- 156.Park HK, Kim JS, Im KC, et al. Functional brain imaging in pure akinesia with gait freezing: [18F] FDG PET and [18F] FP-CIT PET analyses. Mov Disord. 2009;24(2):237–245. doi: 10.1002/mds.22347. [DOI] [PubMed] [Google Scholar]
- 157.Cerami C, Dodich A, Greco L, et al. The Role of Single-Subject Brain Metabolic Patterns in the Early Differential Diagnosis of Primary Progressive Aphasias and in Prediction of Progression to Dementia. J Alzheimers Dis. 2016 doi: 10.3233/JAD-160682. [DOI] [PMC free article] [PubMed] [Google Scholar]
- 158.Roh JH, Suh MK, Kim EJ, Go SM, Na DL, Seo SW. Glucose metabolism in progressive nonfluent aphasia with and without parkinsonism. Neurology. 2010;75(11):1022–1024. doi: 10.1212/WNL.0b013e3181f25ebb. [DOI] [PubMed] [Google Scholar]
- 159.Jin S, Oh M, Oh SJ, et al. Differential Diagnosis of Parkinsonism Using Dual-Phase F-18 FP-CIT PET Imaging. Nucl Med Mol Imaging. 2013;47(1):44–51. doi: 10.1007/s13139-012-0182-4. [DOI] [PMC free article] [PubMed] [Google Scholar]
- 160.Goebel G, Seppi K, Donnemiller E, et al. A novel computer-assisted image analysis of [123I]beta-CIT SPECT images improves the diagnostic accuracy of parkinsonian disorders. Eur J Nucl Med Mol Imaging. 2011;38(4):702–710. doi: 10.1007/s00259-010-1681-0. [DOI] [PubMed] [Google Scholar]
- 161.Im JH, Chung SJ, Kim JS, Lee MC. Differential patterns of dopamine transporter loss in the basal ganglia of progressive supranuclear palsy and Parkinson's disease: analysis with [(123)I]IPT single photon emission computed tomography. J Neurol Sci. 2006;244(1-2):103–109. doi: 10.1016/j.jns.2006.01.006. [DOI] [PubMed] [Google Scholar]
- 162.Kim YJ, Ichise M, Ballinger JR, et al. Combination of dopamine transporter and D2 receptor SPECT in the diagnostic evaluation of PD, MSA, and PSP. Mov Disord. 2002;17(2):303–312. doi: 10.1002/mds.10042. [DOI] [PubMed] [Google Scholar]
- 163.Oh M, Kim JS, Kim JY, et al. Subregional patterns of preferential striatal dopamine transporter loss differ in Parkinson disease, progressive supranuclear palsy, and multiple-system atrophy. J Nucl Med. 2012;53(3):399–406. doi: 10.2967/jnumed.111.095224. [DOI] [PubMed] [Google Scholar]
- 164.Pirker W, Asenbaum S, Bencsits G, et al. [123I]beta-CIT SPECT in multiple system atrophy, progressive supranuclear palsy, and corticobasal degeneration. Mov Disord. 2000;15(6):1158–1167. doi: 10.1002/1531-8257(200011)15:6<1158::aid-mds1015>3.0.co;2-0. [DOI] [PubMed] [Google Scholar]
- 165.A multicenter assessment of dopamine transporter imaging with DOPASCAN/SPECT in parkinsonism. Parkinson Study Group. Neurology. 2000;55(10):1540–1547. doi: 10.1212/wnl.55.10.1540. [DOI] [PubMed] [Google Scholar]
- 166.Messa C, Volonte MA, Fazio F, et al. Differential distribution of striatal [123I]beta-CIT in Parkinson's disease and progressive supranuclear palsy, evaluated with single-photon emission tomography. Eur J Nucl Med. 1998;25(9):1270–1276. doi: 10.1007/s002590050295. [DOI] [PubMed] [Google Scholar]
- 167.Van Laere K, Casteels C, De Ceuninck L, et al. Dual-tracer dopamine transporter and perfusion SPECT in differential diagnosis of parkinsonism using template-based discriminant analysis. J Nucl Med. 2006;47(3):384–392. [PubMed] [Google Scholar]
- 168.Filippi L, Manni C, Pierantozzi M, et al. 123I-FP-CIT in progressive supranuclear palsy and in Parkinson's disease: a SPECT semiquantitative study. Nucl Med Commun. 2006;27(4):381–386. doi: 10.1097/01.mnm.0000202858.45522.df. [DOI] [PubMed] [Google Scholar]
- 169.Seppi K, Scherfler C, Donnemiller E, et al. Topography of dopamine transporter availability in progressive supranuclear palsy: a voxelwise [123I]beta-CIT SPECT analysis. Arch Neurol. 2006;63(8):1154–1160. doi: 10.1001/archneur.63.8.1154. [DOI] [PubMed] [Google Scholar]
- 170.Fasano A, Baldari S, Di Giuda D, et al. Nigro-striatal involvement in primary progressive freezing gait: insights into a heterogeneous pathogenesis. Parkinsonism Relat Disord. 2012;18(5):578–584. doi: 10.1016/j.parkreldis.2012.03.002. [DOI] [PubMed] [Google Scholar]
- 171.Han S, Oh M, Oh JS, et al. Subregional Pattern of Striatal Dopamine Transporter Loss on 18F FP-CIT Positron Emission Tomography in Patients With Pure Akinesia With Gait Freezing. JAMA Neurol. 2016 doi: 10.1001/jamaneurol.2016.3243. [DOI] [PubMed] [Google Scholar]
- 172.Lin WY, Lin KJ, Weng YH, et al. Preliminary studies of differential impairments of the dopaminergic system in subtypes of progressive supranuclear palsy. Nucl Med Commun. 2010;31(11):974–980. doi: 10.1097/MNM.0b013e32833e5f90. [DOI] [PubMed] [Google Scholar]
- 173.Arnold G, Schwarz J, Tatsch K, et al. Steele-Richardson-Olszewski-syndrome: the relation of dopamine D2 receptor binding and subcortical lesions in MRI. J Neural Transm (Vienna) 2002;109(4):503–512. doi: 10.1007/s007020200041. [DOI] [PubMed] [Google Scholar]
- 174.Arnold G, Tatsch K, Kraft E, Oertel WH, Schwarz J. Steele-Richardson-Olszewski-syndrome: reduction of dopamine D2 receptor binding relates to the severity of midbrain atrophy in vivo: (123)IBZM SPECT and MRI study. Mov Disord. 2002;17(3):557–562. doi: 10.1002/mds.10106. [DOI] [PubMed] [Google Scholar]
- 175.Oyanagi C, Katsumi Y, Hanakawa T, et al. Comparison of striatal dopamine D2 receptors in Parkinson's disease and progressive supranuclear palsy patients using [123I] iodobenzofuran single-photon emission computed tomography. J Neuroimaging. 2002;12(4):316–324. doi: 10.1111/j.1552-6569.2002.tb00139.x. [DOI] [PubMed] [Google Scholar]
- 176.Plotkin M, Amthauer H, Klaffke S, et al. Combined 123I-FP-CIT and 123I-IBZM SPECT for the diagnosis of parkinsonian syndromes: study on 72 patients. J Neural Transm (Vienna) 2005;112(5):677–692. doi: 10.1007/s00702-004-0208-x. [DOI] [PubMed] [Google Scholar]
- 177.Dani M, Brooks DJ, Edison P. Tau imaging in neurodegenerative diseases. Eur J Nucl Med Mol Imaging. 2016;43(6):1139–1150. doi: 10.1007/s00259-015-3231-2. [DOI] [PMC free article] [PubMed] [Google Scholar]
- 178.Chien DT, Bahri S, Szardenings AK, et al. Early clinical PET imaging results with the novel PHF-tau radioligand [F-18]-T807. J Alzheimers Dis. 2013;34(2):457–468. doi: 10.3233/JAD-122059. [DOI] [PubMed] [Google Scholar]
- 179.Xia CF, Arteaga J, Chen G, et al. [(18)F]T807, a novel tau positron emission tomography imaging agent for Alzheimer's disease. Alzheimers Dement. 2013;9(6):666–676. doi: 10.1016/j.jalz.2012.11.008. [DOI] [PubMed] [Google Scholar]
- 180.Cho H, Choi JY, Hwang MS, et al. Subcortical 18 F-AV-1451 binding patterns in progressive supranuclear palsy. Mov Disord. 2017;32(1):134–140. doi: 10.1002/mds.26844. [DOI] [PubMed] [Google Scholar]
- 181.Hammes J, Bischof GN, Giehl K, et al. Elevated in vivo [18F]-AV-1451 uptake in a patient with progressive supranuclear palsy. Mov Disord. 2017;32(1):170–171. doi: 10.1002/mds.26727. [DOI] [PubMed] [Google Scholar]
- 182.Smith R, Schain M, Nilsson C, et al. Increased basal ganglia binding of 18 F-AV-1451 in patients with progressive supranuclear palsy. Mov Disord. 2017;32(1):108–114. doi: 10.1002/mds.26813. [DOI] [PMC free article] [PubMed] [Google Scholar]
- 183.Whitwell JL, Lowe VJ, Tosakulwong N, et al. [18 F]AV-1451 tau positron emission tomography in progressive supranuclear palsy. Mov Disord. 2017;32(1):124–133. doi: 10.1002/mds.26834. [DOI] [PMC free article] [PubMed] [Google Scholar]
- 184.Passamonti L, Vasquez Rodriguez P, Hong JT, et al. [18F]AV-1451 positron emission tomography in Alzheimer's disease and progressive supranuclear palsy. Brain. 2017:aww340. doi: 10.1093/brain/aww340. [Epub ahead of print] [DOI] [PMC free article] [PubMed] [Google Scholar]
- 185.Coakeley S, Cho SS, Koshimori Y, et al. Positron emission tomography imaging of tau pathology in progressive supranuclear palsy. J Cereb Blood Flow Metab. 2016:271678X16683695. doi: 10.1177/0271678X16683695. [DOI] [PMC free article] [PubMed] [Google Scholar]
- 186.Scholl M, Lockhart SN, Schonhaut DR, et al. PET Imaging of Tau Deposition in the Aging Human Brain. Neuron. 2016;89(5):971–982. doi: 10.1016/j.neuron.2016.01.028. [DOI] [PMC free article] [PubMed] [Google Scholar]
- 187.Lowe VJ, Curran G, Fang P, et al. An autoradiographic evaluation of AV-1451 Tau PET in dementia. Acta Neuropathol Commun. 2016;4(1):58. doi: 10.1186/s40478-016-0315-6. [DOI] [PMC free article] [PubMed] [Google Scholar]
- 188.Marquie M, Normandin MD, Vanderburg CR, et al. Validating novel tau positron emission tomography tracer [F-18]-AV-1451 (T807) on postmortem brain tissue. Ann Neurol. 2015;78(5):787–800. doi: 10.1002/ana.24517. [DOI] [PMC free article] [PubMed] [Google Scholar]
- 189.Sander K, Lashley T, Gami P, et al. Characterization of tau positron emission tomography tracer [F]AV-1451 binding to postmortem tissue in Alzheimer's disease, primary tauopathies, and other dementias. Alzheimers Dement. 2016 doi: 10.1016/j.jalz.2016.01.003. [DOI] [PubMed] [Google Scholar]
- 190.Smith R, Scholl M, Honer M, Nilsson CF, Englund E, Hansson O. Tau neuropathology correlates with FDG-PET, but not AV-1451-PET, in progressive supranuclear palsy. Acta Neuropathol. 2017;133(1):149–151. doi: 10.1007/s00401-016-1650-1. [DOI] [PMC free article] [PubMed] [Google Scholar]
- 191.Marquie M, Normandin MD, Meltzer AC, et al. Pathologic correlations of [F-18]-AV-1451 imaging in non-Alzheimer tauopathies. Ann Neurol. 2017;133(1):149–151. doi: 10.1002/ana.24844. [DOI] [PMC free article] [PubMed] [Google Scholar]
- 192.Ono M, Sahara N, Kumata K, et al. Distinct binding of PET ligands PBB3 and AV-1451 to tau fibril strains in neurodegenerative tauopathies. Brain. 2017 doi: 10.1093/brain/aww339. [DOI] [PMC free article] [PubMed] [Google Scholar]
- 193.Ikawa M, Lohith TG, Shrestha S, et al. 11C-ER176, a radioligand for 18-kDa translocator protein (TSPO), has adequate sensitivity to robustly image all three affinity genotypes in human brain. J Nucl Med. 2016;58(2):320–325. doi: 10.2967/jnumed.116.178996. [DOI] [PMC free article] [PubMed] [Google Scholar]
- 194.Lockhart SN, Ayakta N, Winer J, La Joie R, Rabinovici G, Jagust WJ. Elevated 18F-AV-1451 PET tracer uptake detected in incidental imaging findings. Neurology. 2017 doi: 10.1212/WNL.0000000000003724. IN PRESS. [DOI] [PMC free article] [PubMed] [Google Scholar]
- 195.Okamura N, Furumoto S, Harada R, et al. Novel 18F-labeled arylquinoline derivatives for noninvasive imaging of tau pathology in Alzheimer disease. J Nucl Med. 2013;54(8):1420–1427. doi: 10.2967/jnumed.112.117341. [DOI] [PubMed] [Google Scholar]
- 196.Ishiki A, Harada R, Okamura N, et al. Tau imaging with [18 F]THK-5351 in progressive supranuclear palsy. Eur J Neurol. 2017;24(1):130–136. doi: 10.1111/ene.13164. [DOI] [PubMed] [Google Scholar]
- 197.Lockhart SN, Baker SL, Okamura N, et al. Dynamic PET Measures of Tau Accumulation in Cognitively Normal Older Adults and Alzheimer's Disease Patients Measured Using [18F] THK-5351. PLoS One. 2016;11(6):e0158460. doi: 10.1371/journal.pone.0158460. [DOI] [PMC free article] [PubMed] [Google Scholar]
- 198.Eckert T, Sailer M, Kaufmann J, et al. Differentiation of idiopathic Parkinson's disease, multiple system atrophy, progressive supranuclear palsy, and healthy controls using magnetization transfer imaging. Neuroimage. 2004;21(1):229–235. doi: 10.1016/j.neuroimage.2003.08.028. [DOI] [PubMed] [Google Scholar]
- 199.Abe K, Terakawa H, Takanashi M, et al. Proton magnetic resonance spectroscopy of patients with parkinsonism. Brain Res Bull. 2000;52(6):589–595. doi: 10.1016/s0361-9230(00)00321-x. [DOI] [PubMed] [Google Scholar]
- 200.Davie CA, Barker GJ, Machado C, Miller DH, Lees AJ. Proton magnetic resonance spectroscopy in Steele-Richardson-Olszewski syndrome. Mov Disord. 1997;12(5):767–771. doi: 10.1002/mds.870120525. [DOI] [PubMed] [Google Scholar]
- 201.Federico F, Simone IL, Lucivero V, et al. Proton magnetic resonance spectroscopy in Parkinson's disease and progressive supranuclear palsy. J Neurol Neurosurg Psychiatry. 1997;62(3):239–242. doi: 10.1136/jnnp.62.3.239. [DOI] [PMC free article] [PubMed] [Google Scholar]
- 202.Guevara CA, Blain CR, Stahl D, Lythgoe DJ, Leigh PN, Barker GJ. Quantitative magnetic resonance spectroscopic imaging in Parkinson's disease, progressive supranuclear palsy and multiple system atrophy. Eur J Neurol. 2010;17(9):1193–1202. doi: 10.1111/j.1468-1331.2010.03010.x. [DOI] [PubMed] [Google Scholar]
- 203.Zanigni S, Testa C, Calandra-Buonaura G, et al. The contribution of cerebellar proton magnetic resonance spectroscopy in the differential diagnosis among parkinsonian syndromes. Parkinsonism Relat Disord. 2015;21(8):929–937. doi: 10.1016/j.parkreldis.2015.05.025. [DOI] [PubMed] [Google Scholar]
- 204.Stamelou M, Pilatus U, Reuss A, et al. In vivo evidence for cerebral depletion in high-energy phosphates in progressive supranuclear palsy. J Cereb Blood Flow Metab. 2009;29(4):861–870. doi: 10.1038/jcbfm.2009.2. [DOI] [PubMed] [Google Scholar]
- 205.Tedeschi G, Litvan I, Bonavita S, et al. Proton magnetic resonance spectroscopic imaging in progressive supranuclear palsy, Parkinson's disease and corticobasal degeneration. Brain. 1997;120(Pt 9):1541–1552. doi: 10.1093/brain/120.9.1541. [DOI] [PubMed] [Google Scholar]
- 206.Gardner RC, Boxer AL, Trujillo A, et al. Intrinsic connectivity network disruption in progressive supranuclear palsy. Ann Neurol. 2013;73(5):603–616. doi: 10.1002/ana.23844. [DOI] [PMC free article] [PubMed] [Google Scholar]
- 207.Piattella MC, Tona F, Bologna M, et al. Disrupted resting-state functional connectivity in progressive supranuclear palsy. AJNR Am J Neuroradiol. 2015;36(5):915–921. doi: 10.3174/ajnr.A4229. [DOI] [PMC free article] [PubMed] [Google Scholar]
- 208.Rittman T, Rubinov M, Vertes PE, et al. Regional expression of the MAPT gene is associated with loss of hubs in brain networks and cognitive impairment in Parkinson disease and progressive supranuclear palsy. Neurobiol Aging. 2016;48:153–160. doi: 10.1016/j.neurobiolaging.2016.09.001. [DOI] [PMC free article] [PubMed] [Google Scholar]
- 209.Dutt S, Binney RJ, Heuer HW, et al. Progression of brain atrophy in PSP and CBS over 6 months and 1 year. Neurology. 2016;87(19):2016–2025. doi: 10.1212/WNL.0000000000003305. [DOI] [PMC free article] [PubMed] [Google Scholar]
- 210.Josephs KA, Whitwell JL, Boeve BF, et al. Rates of cerebral atrophy in autopsy-confirmed progressive supranuclear palsy. Ann Neurol. 2006;59(1):200–203. doi: 10.1002/ana.20707. [DOI] [PubMed] [Google Scholar]
- 211.Josephs KA, Xia R, Mandrekar J, et al. Modeling trajectories of regional volume loss in progressive supranuclear palsy. Mov Disord. 2013;28(8):1117–1124. doi: 10.1002/mds.25437. [DOI] [PubMed] [Google Scholar]
- 212.Paviour DC, Price SL, Jahanshahi M, Lees AJ, Fox NC. Longitudinal MRI in progressive supranuclear palsy and multiple system atrophy: rates and regions of atrophy. Brain. 2006;129(Pt 4):1040–1049. doi: 10.1093/brain/awl021. [DOI] [PubMed] [Google Scholar]
- 213.Whitwell JL, Jack CR, Jr, Parisi JE, et al. Rates of cerebral atrophy differ in different degenerative pathologies. Brain. 2007;130(Pt 4):1148–1158. doi: 10.1093/brain/awm021. [DOI] [PMC free article] [PubMed] [Google Scholar]
- 214.Whitwell JL, Xu J, Mandrekar JN, Gunter JL, Jack CR, Jr, Josephs KA. Rates of brain atrophy and clinical decline over 6 and 12-month intervals in PSP: determining sample size for treatment trials. Parkinsonism Relat Disord. 2012;18(3):252–256. doi: 10.1016/j.parkreldis.2011.10.013. [DOI] [PMC free article] [PubMed] [Google Scholar]
- 215.Guevara C, Bulatova K, Barker GJ, Gonzalez G, Crossley N, Kempton MJ. Whole-Brain Atrophy Rate in Idiopathic Parkinson's Disease, Multiple System Atrophy, and Progressive Supranuclear Palsy. Parkinsons Dis. 2016;2016:9631041. doi: 10.1155/2016/9631041. [DOI] [PMC free article] [PubMed] [Google Scholar]
- 216.Zhang Y, Walter R, Ng P, et al. Progression of Microstructural Degeneration in Progressive Supranuclear Palsy and Corticobasal Syndrome: A Longitudinal Diffusion Tensor Imaging Study. PLoS One. 2016;11(6):e0157218. doi: 10.1371/journal.pone.0157218. [DOI] [PMC free article] [PubMed] [Google Scholar]
- 217.Paviour DC, Price SL, Lees AJ, Fox NC. MRI derived brain atrophy in PSP and MSA-P. Determining sample size to detect treatment effects. J Neurol. 2007;254(4):478–481. doi: 10.1007/s00415-006-0396-4. [DOI] [PubMed] [Google Scholar]
- 218.Paviour DC, Schott JM, Stevens JM, et al. Pathological substrate for regional distribution of increased atrophy rates in progressive supranuclear palsy. J Neurol Neurosurg Psychiatry. 2004;75(12):1772–1775. doi: 10.1136/jnnp.2003.033472. [DOI] [PMC free article] [PubMed] [Google Scholar]
- 219.Daniele A, Barbier A, Di Giuda D, et al. Selective impairment of action-verb naming and comprehension in progressive supranuclear palsy. Cortex. 2013;49(4):948–960. doi: 10.1016/j.cortex.2012.03.024. [DOI] [PubMed] [Google Scholar]
- 220.Kobayashi Z, Akaza M, Ishihara S, et al. Thalamic hypoperfusion in early stage of progressive supranuclear palsy (Richardson's syndrome): report of an autopsy-confirmed case. J Neurol Sci. 2013;335(1-2):224–227. doi: 10.1016/j.jns.2013.09.005. [DOI] [PubMed] [Google Scholar]
- 221.Kurata T, Hayashi T, Murakami T, et al. Differentiation of PA from early PSP with different patterns of symptoms and CBF reduction. Neurol Res. 2008;30(8):860–867. doi: 10.1179/174313208X310278. [DOI] [PubMed] [Google Scholar]
- 222.Slawek J, Lass P, Derejko M, Dubaniewicz M. Cerebral blood flow SPECT may be helpful in establishing the diagnosis of progressive supranuclear palsy and corticobasal degeneration. Nucl Med Rev Cent East Eur. 2001;4(2):73–76. [PubMed] [Google Scholar]
- 223.Chiu WZ, Papma JM, de Koning I, et al. Midcingulate involvement in progressive supranuclear palsy and tau positive frontotemporal dementia. J Neurol Neurosurg Psychiatry. 2012;83(9):910–915. doi: 10.1136/jnnp-2011-302035. [DOI] [PubMed] [Google Scholar]
- 224.Varrone A, Pagani M, Salvatore E, et al. Identification by [99mTc]ECD SPECT of anterior cingulate hypoperfusion in progressive supranuclear palsy, in comparison with Parkinson's disease. Eur J Nucl Med Mol Imaging. 2007;34(7):1071–1081. doi: 10.1007/s00259-006-0344-7. [DOI] [PubMed] [Google Scholar]
- 225.Valotassiou V, Papatriantafyllou J, Sifakis N, et al. Perfusion SPECT studies with mapping of Brodmann areas in differentiating Alzheimer's disease from frontotemporal degeneration syndromes. Nucl Med Commun. 2012;33(12):1267–1276. doi: 10.1097/MNM.0b013e3283599983. [DOI] [PubMed] [Google Scholar]
- 226.Fukui T, Lee E, Hosoda H, Okita K. Obsessive-compulsive behavior as a symptom of dementia in progressive supranuclear palsy. Dement Geriatr Cogn Disord. 2010;30(2):179–188. doi: 10.1159/000310351. [DOI] [PubMed] [Google Scholar]
- 227.Kurata T, Kametaka S, Ohta Y, et al. PSP as distinguished from CBD, MSA-P and PD by clinical and imaging differences at an early stage. Intern Med. 2011;50(22):2775–2781. doi: 10.2169/internalmedicine.50.5954. [DOI] [PubMed] [Google Scholar]
- 228.Hirano S, Shinotoh H, Shimada H, et al. Cholinergic imaging in corticobasal syndrome, progressive supranuclear palsy and frontotemporal dementia. Brain. 2010;133(Pt 7):2058–2068. doi: 10.1093/brain/awq120. [DOI] [PubMed] [Google Scholar]
- 229.Mazere J, Meissner WG, Mayo W, et al. Progressive supranuclear palsy: in vivo SPECT imaging of presynaptic vesicular acetylcholine transporter with [123I]-iodobenzovesamicol. Radiology. 2012;265(2):537–543. doi: 10.1148/radiol.12112650. [DOI] [PubMed] [Google Scholar]
- 230.Shinotoh H, Namba H, Yamaguchi M, et al. Positron emission tomographic measurement of acetylcholinesterase activity reveals differential loss of ascending cholinergic systems in Parkinson's disease and progressive supranuclear palsy. Ann Neurol. 1999;46(1):62–69. [PubMed] [Google Scholar]
- 231.Stamelou M, Matusch A, Elmenhorst D, et al. Nigrostriatal upregulation of 5-HT2A receptors correlates with motor dysfunction in progressive supranuclear palsy. Mov Disord. 2009;24(8):1170–1175. doi: 10.1002/mds.22533. [DOI] [PubMed] [Google Scholar]
- 232.Schonecker S, Brendel M, Havla J, et al. Tau-PET imaging with THK-5351 in patients with clinically diagnosed progressive suprnauclear palsy (PSP). Journal of Neurochemistry.10th International Conference on Frontotemporal Dementias; Munich, Germany. 2016. [Google Scholar]
Associated Data
This section collects any data citations, data availability statements, or supplementary materials included in this article.