

Neuronal rhythmic activity is generated by either network-based or cell-autonomous mechanisms. In the pyloric network of decapod crustaceans, the activation of a neuromodulator-gated pacemaker current is crucial for the generation of rhythmic activity. This current is activated by several neuromodulators, including peptides and acetylcholine, presumably via metabotropic receptors. We have previously demonstrated a novel extracellular calcium-sensitive voltage-dependence mechanism of this current. We presently report that the activation mechanism depends on intracellular and extracellular calcium-sensitive components.
Keywords: G proteins, signaling, calcium, calmodulin, pacemaker
Abstract
The neuromodulator-gated current (IMI) found in the crab stomatogastric ganglion is activated by neuromodulators that are essential to induce the rhythmic activity of the pyloric network in this system. One of these neuromodulators is also known to control the correlated expression of voltage-gated ionic currents in pyloric neurons, as well as synaptic plasticity and strength. Thus understanding the mechanism by which neuromodulator receptors activate IMI should provide insights not only into how oscillations are initiated but also into how other processes, and currents not directly activated by them, are regulated. To determine what specific signaling molecules are implicated in this process, we used a battery of agonists and antagonists of common signal transduction pathways. We found that the G protein inhibitor GDPβS and the G protein activator GTPγS significantly affect IMI amplitude, suggesting that its activation is mediated by G proteins. Interestingly, when using the more specific G protein blocker pertussis toxin, we observed the expected inhibition of IMI amplitude but, unexpectedly, in a calcium-dependent fashion. We also found that antagonists of calcium- and calmodulin-associated signaling significantly reduce IMI amplitude. In contrast, we found little evidence for the role of cyclic nucleotide signaling, phospholipase C (PLC), or kinases and phosphatases, except two calmodulin-dependent kinases. In sum, these results suggest that proctolin-induced IMI is mediated by a G protein whose pertussis toxin sensitivity is altered by external calcium concentration and appears to depend on intracellular calcium, calmodulin, and calmodulin-activated kinases. In contrast, we found no support for IMI being mediated by PLC signaling or cyclic nucleotides.
NEW & NOTEWORTHY Neuronal rhythmic activity is generated by either network-based or cell-autonomous mechanisms. In the pyloric network of decapod crustaceans, the activation of a neuromodulator-gated pacemaker current is crucial for the generation of rhythmic activity. This current is activated by several neuromodulators, including peptides and acetylcholine, presumably via metabotropic receptors. We have previously demonstrated a novel extracellular calcium-sensitive voltage-dependence mechanism of this current. We presently report that the activation mechanism depends on intracellular and extracellular calcium-sensitive components.
many neuromodulators act through G protein-coupled receptors (Clark et al. 2008; Doi and Ramirez 2008; Jaber et al. 1996; Olson et al. 2005; Wei and Wang 1990). They also regulate various parameters of specific ionic currents (Harris-Warrick et al. 1998; Marder 2012; Marder et al. 2014). In so doing, they impact cellular and network function in multiple important ways. For example, rhythmic activity can be activated (Bose et al. 2014; Golowasch and Marder 1992b; Marder 2012; Zhao et al. 2010) or modified (LeBeau et al. 2005; Marder 2012; Miles and Sillar 2011; Vilim et al. 2010; Wu et al. 2010; Xi et al. 2015), entire networks can be reconfigured to serve a new function (Fénelon et al. 1998; Hooper and Moulins 1989, 1990; Koch et al. 2011; Lieske et al. 2000; Ramirez 1998), synaptic function can be altered (Böhm et al. 2015; Johnson et al. 1993a, 1993b, 1995; Mackey et al. 1989; Small et al. 1992; Zhao et al. 2011), and plasticity itself can be regulated by neuromodulators (Lawrence et al. 2015; Pawlak et al. 2010; Zhou et al. 2007). Given the profusion of neuromodulators and their effects on so many signaling pathways and ion channels (Dickinson 2006; Doi and Ramirez 2008; Marder 2012), understanding how neuromodulator receptors activate their effectors is important, and is still incompletely understood for many peptide receptors. This is crucial in many cases, especially for neuronal networks in which neuromodulator effects may be particularly important to ensure stability of activity, due to the convergence of neuromodulator actions at the cellular level. Such convergence might provide resistance to overmodulation. It can also promote network stability due to occlusion of the effects of additional modulators acting on a common effector (Marder 2012; Swensen and Marder 2000) and due to neuromodulator-dependent conductance homeostasis mechanisms (Khorkova and Golowasch 2007; O’Leary and Marder 2016). Nevertheless, within the same network, these different neuromodulators can still express divergent effects in their patterns of activation if different subsets of modulators specifically target distinct cell types (e.g. Doi and Ramirez 2008; Marder 2012; Swensen and Marder 2001).
In this study we used a system that has been widely studied to understand the effects of neuromodulation, the pyloric network of the stomatogastric ganglion (STG) of the crab Cancer borealis. This system displays neuromodulator-specific patterns of activity (Hooper and Marder 1984; Marder 2012; Swensen and Marder 2001) and allows for experimental control of the release of endogenous neuromodulators. Furthermore, this network is known to be a target of a large number of peptidergic, aminergic, cholinergic and gaseous modulators (Marder 2012; Marder and Bucher 2007) through a variety of receptors. Yet, only very few receptors have been identified (Clark et al. 2008; Garcia et al. 2015; Spitzer et al. 2008). Neuromodulator receptors that activate the pyloric rhythm include five peptide receptors and the metabotropic ACh receptor, all of which ultimately activate the neuromodulator-dependent inward current (IMI) (Golowasch and Marder 1992b; Swensen and Marder 2001, 2000) that acts as a pacemaker current for the network (Bose et al. 2014; Zhao et al. 2010). The lateral pyloric (LP) neuron, which is the focus of this study, is known to respond to all these neuromodulators (Golowasch and Marder 1992b; Swensen and Marder 2001; 2000), and a transcript of a close homolog of the crustacean cardioactive peptide (CCAP) receptor has been shown to be expressed by LP and other pyloric neurons (Garcia et al. 2015). At least one of these peptides (proctolin) is also known to control the coordinated expression of ionic currents, which is thought to participate in the homeostatic regulation of the stability of the pyloric activity (Golowasch 2015; Khorkova and Golowasch 2007). In addition, proctolin also regulates short-term synaptic dynamics in the network, and consequently synaptic strength and the short-term stability of network activity (Zhao et al. 2011). Finally, endogenous neuromodulators appear to suppress alternative pacemaking mechanisms in the system. This is revealed by the spontaneous but slow recovery of the pyloric activity after endogenous neuromodulation is persistently suppressed (decentralization) (Luther et al. 2003; Thoby-Brisson and Simmers 1998, 2000, 2002). This recovery is correlated with the up- and downregulation of a number of voltage-gated and synaptic ionic currents (Khorkova and Golowasch 2007; Thoby-Brisson and Simmers 2002) in a transcription-dependent manner (Thoby-Brisson and Simmers 2000). Given that this process is activity independent (Thoby-Brisson and Simmers 1998), it is assumed that deprivation of a subset of neuromodulators contained in the stomatogastric nerve initiates this process of recovery of activity.
Furthermore, we recently showed that the mechanism of voltage dependence of IMI appears to be a particularly interesting one, because it seems to involve the active sensing of extracellular calcium levels via activation of a metabotropic calcium-sensing receptor (Gray and Golowasch 2016). Yet, despite the evident importance of the role of IMI in pyloric network function, and the interesting properties of this current in general, nothing is known about the signaling mechanisms underlying its activation, or to what extent the voltage-dependence mechanism interacts with, or is independent from, the IMI current-gating mechanism. Thus the focus of this study is to attempt to pharmacologically identify and characterize the signaling pathway(s) activated by two peptidergic neuromodulators, proctolin and CCAP, that activate IMI in the LP neuron (Swensen and Marder 2000) This current is characterized by its strong voltage dependence, extracellular calcium dependence of its voltage dependence, divalent cation sensitivity, and monovalent cation permeability (Garcia et al. 2015; Golowasch and Marder 1992b; Gray and Golowasch 2016; Swensen and Marder 2000).
In this study, assuming that proctolin and CCAP converge on a common intermediate, and ultimately on IMI in the LP neuron (Garcia et al. 2015), we employed a battery of agonists and antagonists of second messenger pathways targeting G proteins, cyclic nucleotides, phospholipase C, and general inhibitors of kinases and phosphatases. We found that proctolin-induced IMI amplitude requires a pertussis-sensitive G protein but is insensitive to cyclic nucleotides, phospholipase C, and general kinase and phosphatase inhibitors. On the other hand, we found evidence for the involvement of intracellular calcium signaling pathways and calmodulin-activated proteins, as well as an intriguing dependence of pertussis toxin action on extracellular calcium levels.
METHODS
Animals.
Crabs of the species C. borealis were purchased from local fisheries and housed in saltwater aquaria at 8–12°C. Crabs were anesthetized on ice at least 30 min before dissection. The stomatogastric nervous system (STNS) was dissected out and pinned on Sylgard-lined dishes as previously described (Gutierrez and Grashow 2009; Maynard and Dando 1974). The isolated STNS was continuously perfused with chilled saline (12–14°C) composed of (in mM) 440 NaCl, 11 KCl, 13 CaCl2, 26 MgCl2, 5 maleic acid, and 11 Trizma base, pH 7.4–7.5. In low-calcium solutions, MgCl2 was added in equimolar amounts to compensate for the reduced calcium. In all experiments, the somata of the STG neurons were exposed by desheathing and pinning down the surrounding connective tissue onto a Sylgard-lined petri dish to expose the neuropile. All data reported were obtained from LP neurons.
Electrophysiology.
Extracellular recordings were made by building Vaseline wells around a section of the lateral ventricular (lvn) or dorsal ventricular nerves (dvn) and placing stainless steel wires, connected to an A-M Systems 1700 differential AC amplifier (Carlsberg, WA), into the Sylgard lining the bottom of the recording dishes. Ground electrodes were either AgCl pellets (Molecular Devices, Sunnydale, CA) or chloride-coated silver wires (coated by submerging metallic silver wires in straight Clorox bleach-sodium hypochlorite solution for at least 10 min). All intracellular recordings, unless otherwise stated, were obtained with an Axoclamp 2B amplifier (Molecular Devices) and digitized with either a Digidata 1322A or 1440 (Molecular Devices) and recorded onto a computer using the pClamp 9 or 10.4 software suite (Molecular Devices). Currents were recorded in two-electrode voltage clamp (TEVC) and were passively filtered using an RC filter at 4-kHz cutoff frequency. A circuit diagram of this filter is available upon request. LP neurons were identified by both hyperpolarization at the soma and observation of their disappearance from extracellular recordings in the lvn and by matching intracellular recordings of the neuron’s action potentials to those recorded extracellularly on the lvn.
Electrodes were pulled on a Sutter P-97 puller (Navato, CA) with resistances of 15–25 MΩ for the voltage-recording microelectrode (ME1) and 10–20 MΩ for the current-passing microelectrode (ME2). All recording electrode solutions consisted of 20 mM KCl plus 0.6 M K2SO4. The same was used for current injection solutions except for pressure injection experiments, in which case we used a vehicle solution of 500 mM KCl with or without 20 mM tetraethylammonium (TEA). For pertussis toxin protomer A (PTx-A) injection experiments and their controls, solutions buffered with 10 mM HEPES at pH 7.2 were used.
Membrane-permeable drug experiments.
Membrane permeable drugs were applied for 30–40 min before measurement of IMI. To build dose-response curves, we started at the lowest concentration and progressed to higher concentrations.
Pressure injection experiments.
To test membrane impermeable modulators of G protein function (GDPβS, GTPγS, and PTx-A), we used the same electrode (ME2) to pressure inject modulators and to inject current. We found that the higher resistance electrodes used for recording were prone to clogging. Therefore, pressure injection electrodes were made with much lower resistance (8–15 MΩ measured in standard intracellular K2SO4 recording solution). TEA (20 mM) was included in the electrode to monitor the efficacy of the pressure injection experiments by monitoring the inhibition by TEA of the high-threshold potassium current (IHTK) (Golowasch and Marder 1992a; Zhao and Golowasch 2012). All experiments began in normal saline plus 0.1 μM tetrodotoxin (TTX) and were maintained in this saline throughout the experiments (note that external TEA was not added until pressure injection was completed and shortly before measurement of IMI began). To assess whether pressure injection was working, we measured IHTK once every hour during the pressure injection procedure. Pressure injections were applied for 20- to 30-min intervals; they began at 10 psi, with pressure gradually increased until IHTK reduction was observed. Typical final pressure injection levels were between 20 and 30 psi, but this was highly variable because it depended on pipette characteristics and quality of impalement. When transient IHTK was reduced by at least 50% of its original value, the final solution in which IMI was measured was added and IMI measurements were started (described below).
Neuromodulators.
Proctolin was purchased from American Peptide or Bachem. CCAP was initially purchased from American Peptide, but in winter 2013–spring 2014, this peptide did not produce IMI comparable to that reported in the literature (Swensen and Marder 2000) and our own previous experiments. Therefore, all CCAP data from 2013 to 2014 were omitted. and all later experiments requiring CCAP were performed using CCAP obtained from Bachem. All other neuromodulators were obtained from Sigma Co.
Solutions and drugs.
The following were obtained from Sigma-Aldrich: N-(6-aminohexyl)-5-chloro-1-naphthalenesulfonamide hydrochloride (W7; all experiments except dynasore experiments), TEA, PTX, forskolin, pilocarpine, guanosine 5′-[γ-thio]triphosphate tetralithium salt (GTPγS), guanosine 5′-[β-thio]diphosphate tri-lithium salt (GDPβS), 8-bromo-adenosine-3′,5′-cyclic monophosphate sodium salt (8-Br-cAMP), 8-bromo-guanosine cyclic 3′,5′-monophosphate sodium salt (8-Br-cGMP), dynasore, N-[2-(p-bromocinnamylamino)ethyl]-5-isoquinolinesulfonamide dihydrochloride (H89), 1-(5-iodonaphthalene-1-sulfonyl)-1H-hexahydro-1,4-diazepine hydrochloride (ML-7), okadaic acid, genistein, gallein, and neomycin. The following were obtained from Tocris Bioscience: W7 (dynasore experiments), 1,2-bis(2-aminophenoxy)ethane-N,N,N′,N′-tetraacetic acid tetrakis(acetoxymethyl ester) (BAPTA-AM), cyclosporin A, and edelfosine (Et-18-OCH3). Calmidazolium (CDZ), dantrolene, ryanodine, PTx-A, and staurosporine were purchased from Enzo Life Sciences. CCAP was purchased from Bachem. TTX was purchased from Calbiotech or Tocris Bioscience. BSA was purchased from Fisher Scientific. N-[2-[[[3-(4-chlorophenyl)-2-propenyl]methylamino]methyl]phenyl]-N-(2-hydroxyethyl)-4-methoxybenzenesulphonamide (KN-93) was obtained from EMD Bioscience. Dasatinib was purchased from Selleck Chemical.
Measurement of IMI.
All IMI recordings were generated in TEVC exactly as described in Gray and Golowasch (2016): the current was obtained by subtracting control currents, elicited with voltage ramps from +20 to −80 mV at 75 mV/s in the absence of the modulator that activates IMI, from currents elicited with an identical voltage ramp in the presence of the activating neuromodulator, in this study either proctolin or CCAP. Unless otherwise stated, all recordings of IMI were made in standard “IMI recording saline,” which contained normal Cancer saline plus 0.1 μM TTX to block sodium currents, 20 mM TEA to block potassium currents, 10 μM PTX to block synaptic currents, 5 mM CsCl to block the H-current, and 200 μM CdCl2 to block calcium currents. In some cells, spontaneous voltage oscillations were observed under these conditions; when this happened, TTX and PTX concentrations were transiently raised to 1 and 30 μM, respectively, until oscillations stopped or were attenuated. Standard IMI recording saline was then resumed for at least 20 min before IMI was measured. Both proctolin and CCAP were bath-applied at 1 μM for 1–3.5 min (perfusion rate of 3–4.5 ml/s).
In a previous study, we reported that IMI amplitude was sensitive to application number and calcium concentration (Gray and Golowasch 2016). Therefore, in normal extracellular calcium, only applications 2–5 were included in data analysis. In experiments conducted with low extracellular calcium concentration, analysis was adjusted for covariate application number as described previously (Gray and Golowasch 2016).
We defined two properties of IMI: slope conductance and amplitude. The slope conductance is the slope of the current-voltage relationship (I-V curve) between −20 and −75 mV; this value is used as our quantification of the voltage dependence of IMI reported in Gray and Golowasch (2016). This quantification was robust and detected the previously reported reduction of voltage dependence of IMI induced by lowering extracellular calcium concentration (Golowasch and Marder 1992b; Gray and Golowasch 2016; Swensen and Marder 2000). To quantify IMI amplitude, we used the current level at −15 mV. We base this criterion on our previous results showing that extracellular calcium tends not to affect IMI when quantified at this voltage (see Fig. 1 in Gray and Golowasch 2016). To distinguish whether a drug affected either IMI activation or voltage dependence, we performed statistical analyses on these two properties of IMI.
Measurement of potassium currents IHTK and IA.
To assess the efficacy of our pressure injection treatment, we measured the mean current during the 10 ms surrounding the peak of IHTK at +20 mV. This current was measured in response to a current pulse from a holding voltage of −40 mV in the presence of 0.1 µM TTX (Golowasch and Marder 1992a; Zhao and Golowasch 2012). The transient (inactivating) potassium current IA was measured by subtraction of currents elicited with depolarizing pulses from a holding voltage of −40 mV from those elicited from a holding potential of −80 mV.
Statistics and data analysis.
All calculations for IMI, difference currents, and leak subtractions were performed as described in Gray and Golowasch (2016). All graphs making comparisons between conditions show mean ± SE unless noted otherwise. Statistical analysis was performed as described previously in Gray and Golowasch (2016). In brief, analysis of variance with post hoc Tukey tests were used for normal homoscedastic data. Data that did not pass these tests were ranked, and the same statistical procedures were performed on these rank scores. Two-tailed paired and unpaired Student t-tests were used for normal two-group comparisons. Mann-Whitney U-tests were used for non-normal two-group comparisons. Analysis of covariance was used for data in Table 2 that were obtained in low calcium concentration to account for previously observed IMI desensitization in low calcium (Gray and Golowasch 2016). All ANOVAs and Student t-tests were performed with SigmaPlot 11.0. Analysis of covariance was carried out with IBM SPSS Statistics v22. Data differences were considered significant at P < 0.05.
Table 2.
Effects of signal transduction modulators on proctolin-induced IMI
| Target | Drug | Concentration | n | IMI(−15 mV), nA | Statistical Test | P Value |
|---|---|---|---|---|---|---|
| PLC | Edelfosine (normal calcium) | 0 μM | 6 | −1.287 ± 0.294 | One-way ANOVA | 0.370 |
| 10 μM | 4 | −0.912 ± 0.336 | ||||
| 20 μM | 2 | −0.515 ± 0.098 | ||||
| Neomycin (low calcium) | 0 μM | 14 | −0.892 ± 0.155 | One-way ANOVA + covariate application no.a | 0.093 | |
| 0.10 μM | 3 | −1.428 ± 0.310 | ||||
| 0.33 μM | 5 | −1.583 ± 0.259 | ||||
| 1.00 μM | 3 | −0.826 ± 0.333 | ||||
| Ser/Thr kinases (also Tyr) | Staurosporine (low calcium) | 0.00 μM | 17 | −0.886 ± 0.108 | One-way ANOVA + covariate application no.b | 0.083 |
| 0.10 μM | 3 | −0.217 ± 0.258 | ||||
| 0.33 μM | 3 | −0.754 ± 0.258 | ||||
| cAMP | 8-Br-cAMP (normal calcium) | 0 μM | 4 | −1.579 ± 0.486 | t-Test | 0.721 |
| 500 μM | 3 | −1.839 ± 0.446 | ||||
| Adenylyl cyclase (cAMP) | Forskolin (normal calcium) | 0 μM | 4 | −1.586 ± 0.491 | t-Test | 0.389 |
| 10 μM | 4 | −0.922 ± 0.521 | ||||
| PKA | H89 (Normal calcium) | 0 μM | 6 | −1.311 ± 0.360 | t-Test | 0.886 |
| 20 μM | 4 | −1.224 ± 0.472 | ||||
| cGMP | 8-Br-cGMP (normal calcium) | 0 μM | 7 | −1.363 ± 0.352 | One-way ANOVA | 0.714 |
| 500 μM | 2 | −0.942 ± 0.076 | ||||
| 1,000 μM | 3 | −1.683 ± 0.742 | ||||
| Phosphatases (general) | Okadaic acid (normal calcium) | 0 nM | 4 | −0.530 ± 0.106 | Paired t-test; IMI = okadaic acid | 0.056 |
| 10 nM | 4 | −0.223 ± 0.157 | ||||
| Okadaic acid (low calcium) | 0 nM | 16 | −0.672 ± 0.118 | One-way ANOVA + covariate application no.c | 0.319 | |
| 3.33 nM | 4 | −0.706 ± 0.259 | ||||
| 10 nM | 4 | −1.168 ± 0.235 | ||||
| 33 nM | 3 | −0.676 ± 0.292 | ||||
| Phosphatases (calcineurin) | Cyclosporin A (normal calcium) | 0 μM | 5 | −1.603 ± 0.393 | One-way ANOVA | 0.459 |
| 5 μM | 2 | −1.171 ± 0.457 | ||||
| 13.3 μMe | 3 | −1.041 ± 0.295 | ||||
| Tyrosine kinases (general; see also staurosporine) | Genistein (low calcium) | 0 μM | 8 | −0.703 ± 0.173 | One-way ANOVA + covariate application no.d | 0.783 |
| 100 μM | 5 | −0.783 ± 0.220 | ||||
| SRC kinases | Dasatinib (low calcium) | 0 μM | 4 | −1.493 ± 0.378 | t-Test | 0.523 |
| 100 μM | 4 | −1.194 ± 0.229 |
Values are means ± SE. In experiments conducted with low extracellular calcium, analyses was adjusted for covariate application number.
Corrected mean reported with covariate application no. = 3.08.
Corrected mean reported with covariate application no. = 3.83.
Corrected mean reported with covariate application no. = 4.30.
Corrected mean reported with covariate application no. = 3.31.
The 13.3 μM cyclosporin A group consisted of 2 preparations at 10 μM and 1 preparation at 20 μM.
Low-calcium-induced depolarization of resting membrane potential is prevented by BSA.
As described previously (Gray and Golowasch 2016), we found that application of saline with calcium concentrations ≤2 mM significantly depolarized membrane potential and reduced input resistance at −50 mV, unless we included 0.5% BSA. Importantly, as illustrated in Table 1, no effect of BSA was observed on IA at +20 mV [1-way ANOVA: F(4,20) = 2.22, P = 0.09], IHTK at +20 mV [1-way ANOVA: F(4,20) = 1.45, P = 0.25], or proctolin-induced IMI amplitude at −15 mV [1-way ANOVA: F(3,32) = 0.255, P = 0.857]. Therefore, experiments conducted with low calcium concentration, unless otherwise noted, were always supplemented with 0.5% BSA.
Table 1.
Effects of BSA on IHTK, IA, and IMI
| BSA, % | IHTK (+20 mV), nA | IA (+20 mV), nA | IMI (−15 mV), nA |
|---|---|---|---|
| 0 | 132.7 ± 23.0 (5) | 29.9 ± 3.3 (5) | −0.98 ± 0.22 (8) |
| 0.01 | 124.9 ± 24.6 (5) | 33.4 ± 5.0 (5) | −1.09 ± 0.15 (4) |
| 0.1 | 131.5 ± 27.3 (5) | 36.2 ± 4.2 (5) | −1.13 ± 0.13 (19) |
| 0.5 | 137.0 ± 25.8 (5) | 36.7 ± 3.4 (5) | −0.93 ± 0.24 (5) |
| 1.0 | 128.1 ± 23.1 (5) | 36.2 ± 2.8 (5) | −1.11 ± 0.23 (2)* |
| 2.0 | 123.6 ± 22.9 (5) | 40.7 ± 5.0 (5) | −1.19 ± 0.03 (2)* |
Values are means ± SE; n is indicated parentheses. BSA does not affect IHTK (at +20 mV), IA (at +20 mV), or IMI (at −15 mV) (IHTK and IA were measured in normal saline and 1 µM TTX).
Data were omitted from statistical analysis.
RESULTS
Following Swensen and Marder (2000), we hypothesize that some peptidergic neuromodulator receptors converge on a common intermediate that, in turn, activates IMI. Expression of the putative G protein-coupled CCAP receptor in this system has been shown to correlate with CCAP-induced IMI (Garcia et al. 2015). It is also well known that muscarinic agonists, such as pilocarpine, which activate IMI in the crab STG (Swensen and Marder 2000), act via G protein-coupled receptors (GPCR) in other systems (Wei and Wang 1990). Proctolin, pilocarpine, and other peptides also activate IMI in this system (Golowasch and Marder 1992b; Swensen and Marder 2000). Recently, a proctolin receptor that has the structural features of a GPCR was predicted from the related Homarus americanus transcriptome (Christie et al. 2015). In light of this, we hypothesize that the receptor to the peptide proctolin is a GPCR, and in this study we attempt to identify and characterize the putative G protein-coupled signaling pathway(s) that mediate(s) the activation of IMI.
IMI depends on a G protein with calcium-dependent pertussis toxin sensitivity.
Garcia et al. (2015) provided indirect evidence that CCAP-induced IMI may be mediated by G proteins by showing that CCAP receptor mRNA cloned for C. borealis correlates well with a cell’s ability to produce CCAP-induced IMI (Garcia et al. 2015). However, even if a GPCR exists, it does not necessarily imply that it signals through G proteins, as has been shown, for instance, for the activation of the sodium leak current (NaLCN) through the NKR1 receptor (Lu et al. 2009) in ventral tegmental area and hippocampal cells, and cholinergic agonists in substantia nigra neurons (Lutas et al. 2016). In these cases, NaLCN channels are activated by a non-G protein pathway dependent on a serine family kinase (SFK)-based mechanism, even though the NKR1 and muscarinic receptors are known GPCRs. Therefore, in the present study we attempted to establish whether proctolin-induced IMI was dependent on G proteins, and if so, the particular G protein’s identity.
GDPβS inhibits IMI.
To test the hypothesis that proctolin-induced IMI is mediated by activation of a G protein, we pressure injected either 20 mM TEA plus 500 mM KCl, or the same with the addition of 10 mM GDPβS, a nonphosphorylatable broad-spectrum inhibitor of G proteins (Eckstein et al. 1979), in either normal (13 mM) or low (2 mM)-calcium saline. Consistent with IMI being mediated by a G protein, as shown in Fig. 1, GDPβs significantly altered proctolin-induced IMI amplitude at −15 mV in both high- and low-calcium saline [2-way ANOVA, calcium: F(1,30) = 5.99, P = 0.02; GDPβS: F(1,30) = 15.034, P = 5.3 × 10⁻⁴; interaction: F(1,30) = 0.376, P = 0.544]. A post hoc Tukey test showed that, in both normal calcium (P = 0.003) and low calcium (P = 0.035), GDPβS significantly attenuated IMI amplitude relative to pressure injection alone (Fig. 1C). Similar results were obtained for proctolin-induced IMI amplitude with pressure injection of 10 mM GDPβS with only 500 mM KCl in the pipette (no TEA): normal calcium control (n = 3), −0.81 ± 0.4 nA; normal calcium GDPβS (n = 2), −0.11 ± 0.5 nA; low-calcium control (n = 3), −1.74 ± 0.4 nA; and low-calcium GDPβS (n = 2), −0.14 ± 0.5 nA [2-way ANOVA, calcium: F(1,6) = 1.102, P = 0.334; GDPβS: F(1,6) = 6.263, P = 0.046; interaction: F(1,6) = 0.929, P = 0.372]. These results suggest that proctolin-induced IMI signaling requires G proteins.
Fig. 1.
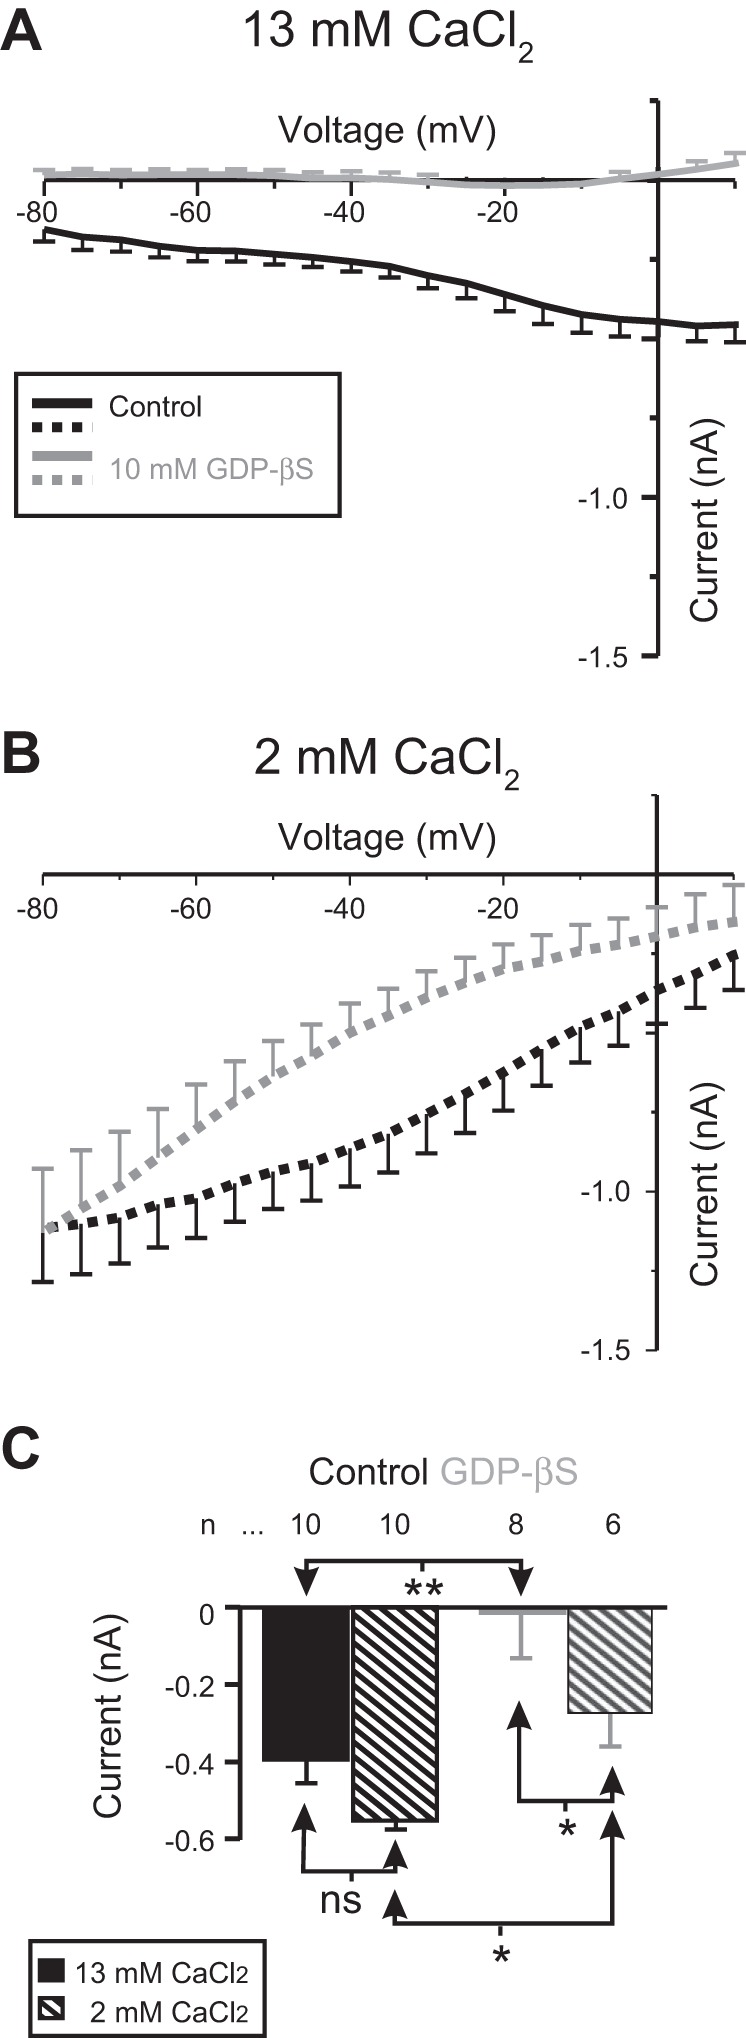
Proctolin-induced IMI activation requires G proteins: effect of GDPβS. GDPβS (gray) or control solutions (black) were pressure injected in normal (13 mM CaCl2; solid curves) or low extracellular (2 mM CaCl2) calcium levels (dotted curves). A: averaged I-V curves of proctolin-induced IMI in normal calcium. B: averaged I-V curves of proctolin-induced IMI in 2 mM (low) extracellular calcium. C: quantification of the effect of GDPβS on IMI: both GDPβs and calcium significantly altered IMI amplitude at −15 mV [2-way ANOVA, calcium: F(1,30) = 5.99, P = 0.02; GDPβS: F(1,30) = 15.034, P = 5.3 × 10⁻⁴; interaction: F(1,30) = 0.376, P = 0.544]. Tukey comparisons: *P < 0.05; **P < 0.01; ns, not significant. Error bars are SE. Solid bars indicate normal extracellular Ca2+ (control); hatched bars indicate low calcium level.
GTPγS occludes IMI.
One approach to study the putative role of G proteins in proctolin-induced IMI is to perform occlusion experiments, in which an activator of G protein, such as GTPγS, is applied before activation of the receptor with the natural ligand (i.e., proctolin). It has previously been shown that proctolin can occlude the response to CCAP in crab LP neurons (Garcia et al. 2015; Swensen and Marder 2000). Therefore, we predicted that if proctolin-induced IMI is G protein dependent, then pressure injection of G protein activators should occlude proctolin-induced IMI. As shown in Fig. 2, GTPγS, but not calcium, was capable of occluding IMI amplitude at −15 mV [2-way ANOVA; calcium: F(1,22) = 2.136, P = 0.158; GTPγS: F(1,22) = 13.562, P = 0.001; interaction: F(1,22) = 0.0817, P = 0.778]. A post hoc Tukey test showed that proctolin-induced IMI was significantly occluded in both normal (P = 0.02) and low calcium (P = 0.014). Consistent with the effects of GDPβS reported above, these findings suggest that proctolin-induced IMI requires G protein signaling.
Fig. 2.
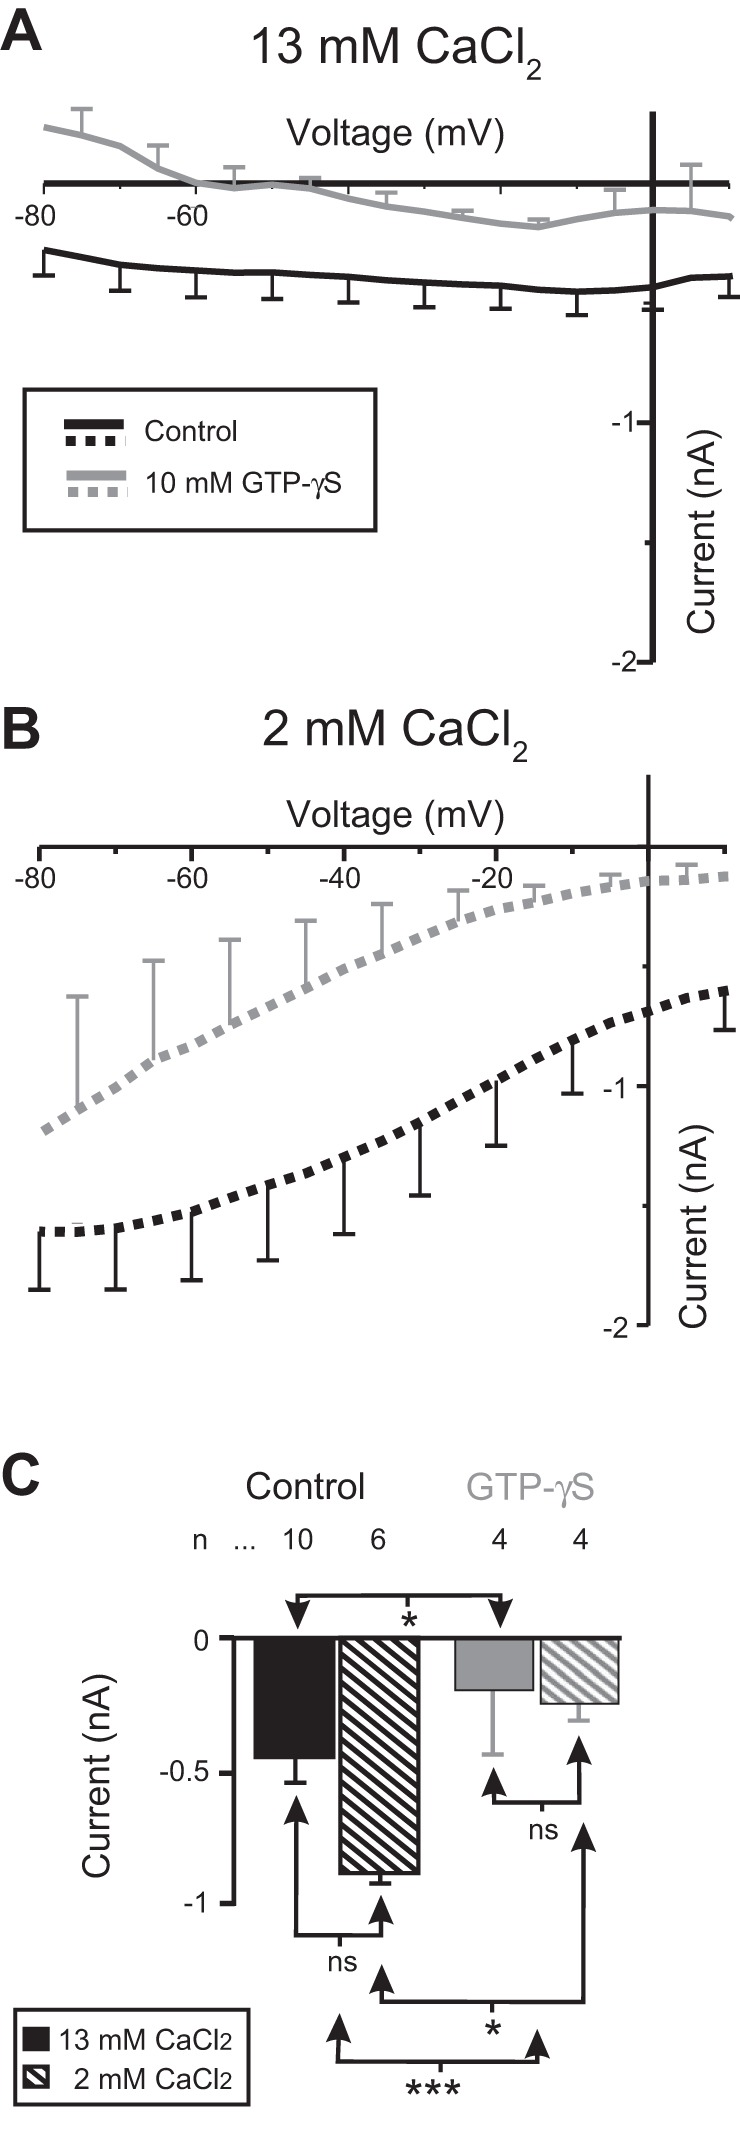
Proctolin-induced IMI activation requires G proteins: effect of GTPγS. GTPγS was pressure injected in a vehicle solution of 500 mM KCl + 20 mM TEA. Control pressure injections used the vehicle solution only. A: averaged I-V curves of proctolin-induced IMI after pressure injection with either control (black) or 10 mM GTPγS (gray) solution in normal (13 mM) calcium. B: same as A but in saline containing low (2 mM) calcium. C: quantification of the effect of GTPγS on IMI amplitude at −15 mV. A 2-way ANOVA showed that GTPγS, but not calcium, was capable of occluding IMI amplitude [calcium: F(1,22) = 2.136, P = 0.158; GTPγS: F(1,22) = 13.562, P = 0.001; interaction: F(1,22) = 0.0817, P = 0.778]. Tukey post hoc test: *P < 0.05; ***P < 0.001; ns, not significant. Error bars are SE. Solid bars indicate normal extracellular Ca2+ (control); hatched bars indicate low calcium level.
We attempted to directly measure the activation of IMI by G protein activators, but that proved unsuccessful. This is most likely due to the fact that the point of injection (the soma) is very far away from the area where neuromodulator receptors are expressed (the neuropile; cf. Golowasch and Marder 1992b). The consequence of this is that it took more than an hour for the pressure-injected activators to become effective, and in that amount of time, small amplitude changes of any of the background currents can obfuscate the recordings of the very small IMI. In addition, during the injections, we needed to avoid exposing the cells to the various blockers we normally used to measure IMI, which were applied only shortly before those measurements (see methods). Given that IMI can only be detected by subtraction, this denies us the opportunity to directly measure the effects of GTPγS.
Pertussis toxin (PTx-A) inhibits IMI in a calcium-dependent manner.
To identify the particular G protein that could be mediating proctolin-induced IMI, we pressure-injected the specific G protein inhibitor PTx-A together with 20 mM TEA + 500 KCl + 10 mM HEPES (pH 7.2), or the vehicle (no PTx-A) as control. PTx-A is known to inhibit only trimeric G proteins that contain an ADP-ribosylation site, i.e., G proteins whose α-subunit is of either the αi, αo, or αt types (Katada 2012). As illustrated in Fig. 3, PTx-A significantly reduced IMI amplitude at −15 mV [2-way-ANOVA, calcium: F(1,22) = 20.630, P = 1.6 × 10⁻⁴; PTx-A: F(1,22) = 11.735, P = 0.002; interaction: F(1,22) = 3.541, P = 0.073], even though, surprisingly, low calcium levels also augmented IMI amplitude in the absence of PTx-A (P < 0.001). A post hoc Tukey test showed that PTx-A inhibited IMI only at low calcium levels (P = 0.002; in normal calcium P = 0.268), which is supported by the high F value for the interaction between these factors. These results were unexpected, because it was assumed that PTx-A sensitivity should not depend on extracellular calcium, but are consistent with the results observed with GDPβS (including the calcium sensitivity) and GTPγS. These results thus indicate that IMI is mediated by a PTx-A-sensitive G protein, with higher sensitivity to PTx-A at lower than at normal extracellular calcium levels.
Fig. 3.
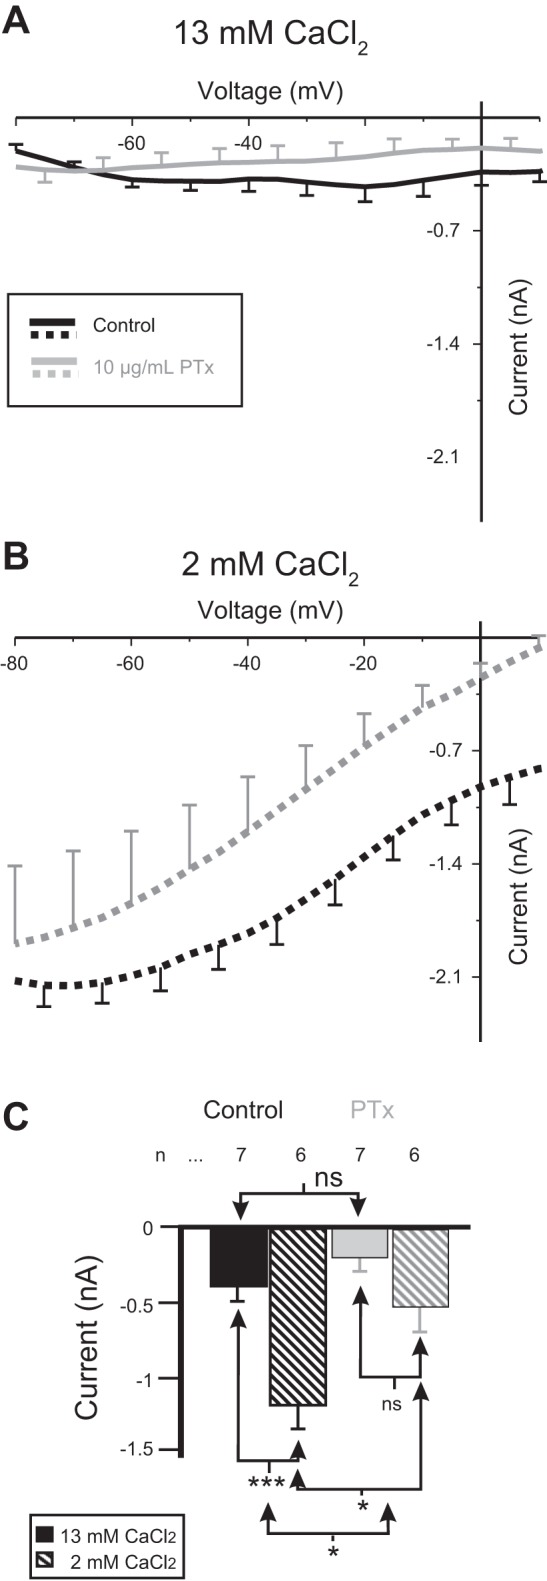
The specific G protein inhibitor pertussis toxin (PTx-A) inhibits proctolin-induced IMI. Control pressure injection solutions of 500 mM KCl + 20 mM TEA (black) or the same solution plus 10 μg/ml PTx-A (gray) were pressure injected in either normal (13 mM) or low (2 mM) extracellular calcium. All recording electrodes used 20 mM KCl + 0.6 M K2SO4. A: averaged I-V curves of proctolin-induced IMI after pressure injection of control solution (black) or 10 μg/ml PTx-A solution (gray). B: same as A but in saline containing low (2 mM) calcium. C: quantification of effect of PTx-A on proctolin-induced IMI amplitude. A 2-way ANOVA showed that both calcium and PTx-A were capable of altering IMI amplitude at −15 mV [calcium: F(1,22) = 20.630, P = 1.61 × 10⁻⁴; PTx-A: F(1,22) = 11.735, P = 0.002; interaction: F(1,22) = 3.541, P = 0.073]. Post hoc Tukey test: *P < 0.05; ***P < 0.001; ns, not significant. Error bars are SE. Solid bars indicate normal extracellular Ca2+ (control); hatched bars indicate low calcium level.
Calmodulin-dependent signaling.
Swensen and Marder (2000) showed that the calmodulin inhibitor W7 increased IMI amplitude at both −40 and −80 mV. In a previous paper, we showed that this observed augmentation was due to loss of voltage dependence, rather than enhancement of the current (Gray and Golowasch 2016). In the present study we found that when quantifying proctolin-induced IMI amplitude at −15 mV, W7 produces a decrease of IMI amplitude.
We applied varying concentrations of the calmodulin inhibitor W7 while measuring proctolin-induced IMI amplitude. As shown in Fig. 4A, W7 reduced proctolin-induced IMI amplitude in a concentration-dependent manner [1-way repeated-measures ANOVA, F(4,19) = 3.24, P = 0.035], although a post hoc Tukey test showed that this inhibition was only significant at 10 μM W7 (P = 0.026). This result supports an activating role (albeit small and perhaps nonlinear) for calmodulin in proctolin-induced IMI amplitude. This result is consistent with previous observations of an increase in slope conductance by W7 (Gray and Golowasch 2016; Swensen and Marder 2000) and suggests that both voltage dependence and activation of IMI involve a calmodulin-dependent pathway.
Fig. 4.
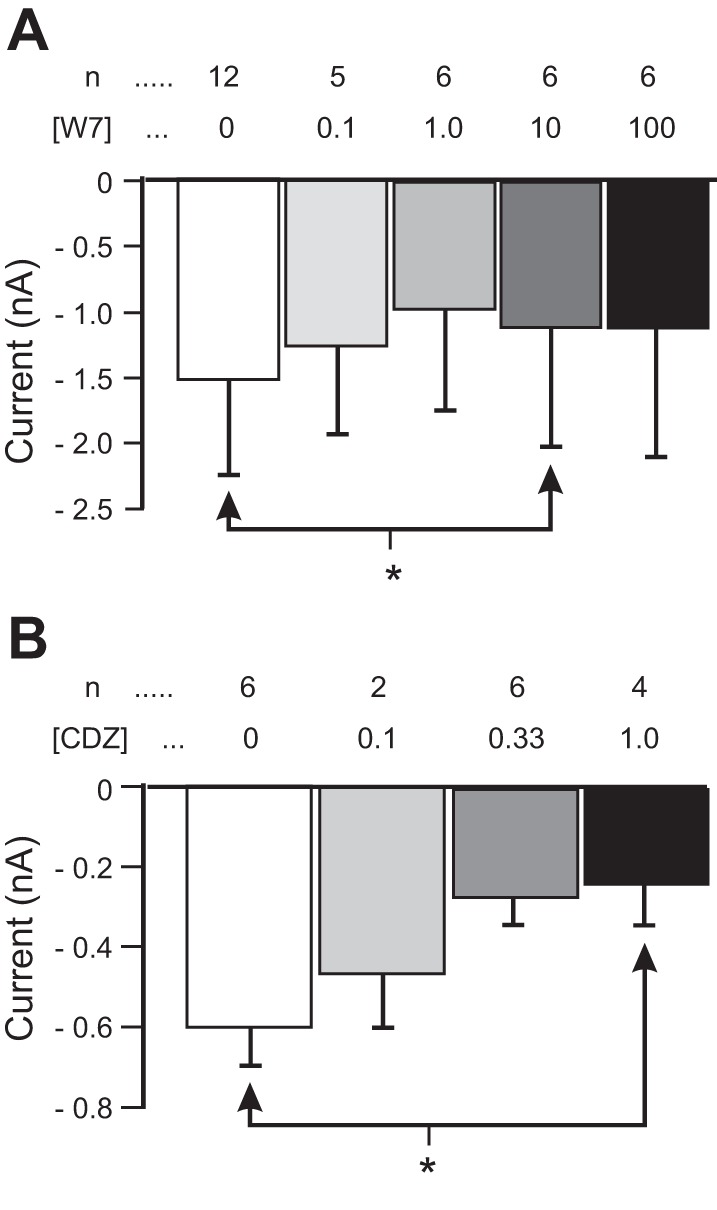
Role of calmodulin in proctolin-induced IMI amplitude. Proctolin-induced IMI is shown at different concentrations of calmodulin inhibitors W7 (A) and calmidazolium (CDZ; B). A: quantification of W7 data. A 1-way repeated-measures ANOVA showed a small but significant reduction of proctolin-induced IMI amplitude by W7 [F(4,19) = 3.24, P = 0.035]. B: proctolin-induced IMI at different concentrations of CDZ. A 1-way repeated-measures ANOVA showed that CDZ reduced proctolin-induced IMI amplitude [F(3,9) = 6.38, P = 0.013]. Error bars are SE. Tukey test: *P < 0.05.
To confirm that the effects of W7 on IMI were due to calmodulin, we used a non-napthalenesulfonamide calmodulin inhibitor, calmidazolium (CDZ), an inhibitor that is effective in crustacean systems (Goudeau and Goudeau 2001; Obukhov et al. 1998). As shown in Fig. 4B, CDZ also reduced proctolin-induced IMI amplitude in a concentration-dependent manner [1-way repeated-measures ANOVA, F(3, 9) = 6.38, P = 0.013], with a post hoc Tukey test showing that this inhibition was significant at 1 μM CDZ (P = 0.015) (and perhaps higher) but not at lower concentrations (Fig. 4B). This result, along with the results using W7 presented above, suggests that proctolin-induced IMI is dependent on calmodulin signaling. However, although all calmodulin inhibitors had an effect on IMI slope (Gray and Golowasch 2016), the nonlinear relation of W7 on proctolin-induced IMI amplitude (maximum effect at 10 μM) suggests that this may not be a simple relationship.
Upstream of calmodulin: calcium signaling.
If activated calmodulin mediates IMI signaling, it follows that a source of calcium is needed for IMI signaling. A possible source is intracellularly sequestered calcium. Previously, we tested BAPTA-AM to attempt to reduce intracellular calcium levels and discovered that it is not effective in modifying either IMI amplitude or the high-threshold potassium current (IHTK), which is dominated by a calcium-dependent potassium current (Gray and Golowasch 2016). The lack of effect on IHTK is also consistent with the previously reported lack of effect of BAPTA-AM on the same current in the cardiac ganglion in the same species (Ransdell et al. 2012). It is not clear at this point why BAPTA-AM is not effective, but we think that it may either be the result of tight compartmentalization of intracellular BAPTA after deesterification or that STG neurons lack the necessary esterases to convert BAPTA-AM to BAPTA. To overcome this problem, direct iontophoretic injection of BAPTA into the cells was attempted. However, this resulted in a confounding activity-dependent reduction of background potassium currents (see Golowasch et al. 1999) that complicated the interpretation of the results. Pressure injection of BAPTA was also not without significant problems, because the cells sustained too much damage during the long injections needed to obtain an effect. With no good direct way of confirming whether calcium activator was working at the desired level, we used other pharmacological manipulations of intracellular calcium.
Dantrolene, first characterized in crustacean muscle fibers (Hainaut and Desmedt 1974), is an antagonist of ryanodine receptors, which reduces calcium-induced calcium release (Zhao et al. 2001). As shown in Fig. 5, 3.33 μM dantrolene significantly decreased proctolin-induced IMI amplitude at −15 mV [paired t-test: t(5) = −3.502, P = 0.017]. This is consistent with the hypothesis that IMI activation requires calcium-induced calcium release.
Fig. 5.
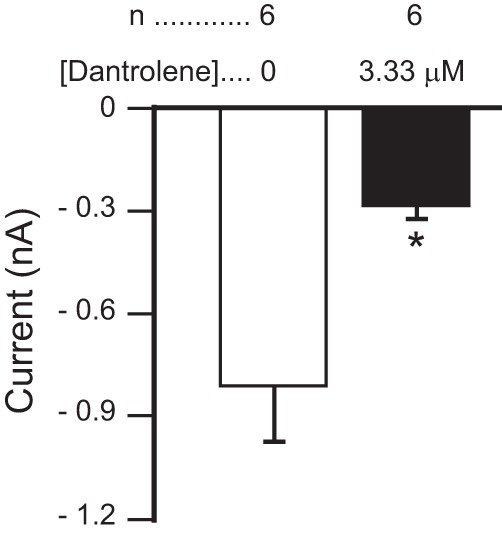
The ryanodine receptor antagonist dantrolene inhibits proctolin-induced IMI. Proctolin-induced IMI is shown before (open bar) and after (filled bar) application of 3.33 μM dantrolene. A paired t-test showed that dantrolene significantly decreased proctolin-induced IMI amplitude at −15 mV [t(5) = −3.502, P = 0.017]. Error bars are SE. *P < 0.05.
Downstream of calmodulin: calmodulin kinase signaling.
As our results suggest that intracellular calcium and calmodulin play a role in IMI activation, we examined whether calmodulin-dependent kinases may be involved. We have reported previously that the CaMKII inhibitor KN-93, an inhibitor that has been successfully used in crustacean neurons (Uzdensky et al. 2007; Withers et al. 1998), significantly altered proctolin-induced IMI voltage dependence (Gray and Golowasch 2016). We now report that KN-93 reduces proctolin-induced IMI amplitude. Because we had difficulty in obtaining large sample numbers for a large range of antagonist concentrations, for statistical analysis we pooled our data into a low-dose condition consisting of an average KN-93 concentration of 4.2 μM (2 μM, n = 1; 4 μM, n = 1; 5 μM, n = 3) and a high-dose condition with an average concentration of 15 μM KN-93 (10 μM, n = 1; 20 μM, n = 1). As illustrated in Fig. 6A, KN-93 significantly decreased proctolin-induced IMI amplitude at −15 mV [1-way repeated-measures ANOVA, F(2,5) = 34.09, P = 0.001]. A post hoc Tukey test shows that both the low dose (P = 0.013) and high dose (P = 0.003) were significantly different from control, and from one another (P = 0.034). Similar results were obtained with overnight incubations in 20 μM KN-93 (KN-93, n = 3; control, n = 4; data not shown). These results, combined with the finding that an isoform of CaMKII has been identified in the STNS of the related lobster species Panulirus interruptus (Withers et al. 1998), suggests that CaMKII may play a role in proctolin-induced IMI activation.
Fig. 6.
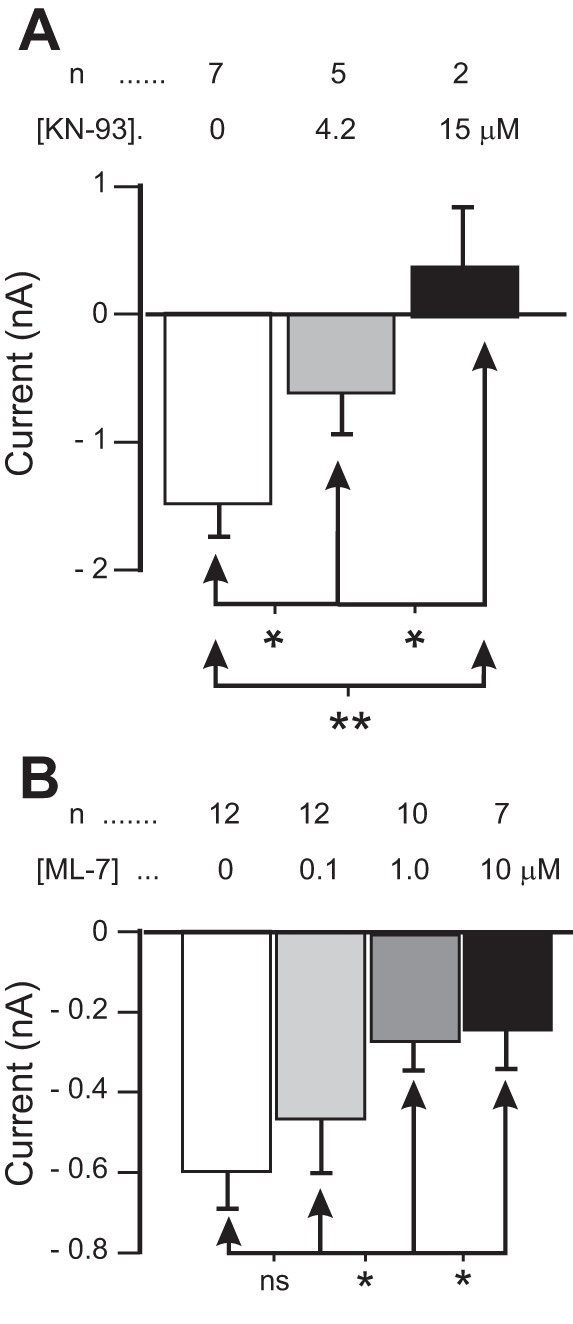
Kinase inhibitors reduce IMI amplitude. A: proctolin-induced IMI in different concentrations of KN-93. For statistical analysis, KN-93 was grouped into “low-dose” (2–5 μM range, average concentration 4.2 μM), and “high-dose” groups (10–20 μM range, average concentration 15 μM). A 1-way repeated-measures ANOVA showed that KN-93 significantly decreased proctolin-induced IMI amplitude at −15 mV [KN-93: F(2,5) = 34.09, P = 0.001]. B: proctolin-induced IMI at different concentrations of the MLCK inhibitor ML-7. A 1-way repeated-measures ANOVA showed that ML-7 decreased proctolin-induced IMI amplitude at −15 mV [ML-7: F(3,26) = 4.468, P = 0.012]. Post hoc Tukey test: *P < 0.05; **P < 0.01; ns, not significant. Error bars are SE.
We also tested the specific myosin light chain kinase (MLCK) inhibitor ML-7 to examine the hypothesis that MLCK, also a calmodulin-sensitive kinase, may mediate the activation of IMI. As shown in Fig. 6B, ML-7 decreased proctolin-induced IMI amplitude at −15 mV in a concentration-dependent manner [1-way repeated-measures ANOVA; ML-7: F(3,26) = 4.468, P = 0.012], with a post hoc Tukey test indicating that this effect is significant at concentration 1 µM and above. These results suggests that both calmodulin-dependent kinases CaMKII and MLCK, and thus, putatively, phosphorylation of IMI channels or other components of their activation pathway, may play a role in the activation of IMI.
Role of calcium-sensing receptor.
In a previous paper, we claimed that the calcium-sensing receptor (CaSR), a GPCR, plays a key role in mediating IMI voltage dependence (Gray and Golowasch 2016). In the present study we tested the effects of the specific CaSR antagonist NPS-2143 and the CaSR agonist R568 on IMI amplitude. Whereas the CaSR antagonist did not affect proctolin-induced IMI amplitude at concentrations up to 1 mM [1-way repeated-measures ANOVA, NPS-2143: F(4,22) = 1.085, P = 0.388; data not shown], the agonist R568 induced a significant increase in proctolin-induced IMI (Fig. 7). A two-way ANOVA for factors R568 and calcium showed significant changes in proctolin-induced IMI amplitude at −15 mV [calcium: F(1,20) = 18.301, P = 3.7 × 10⁻⁴; R568: F(1,20) = 23.447, P = 9.9 × 10⁻⁵; interaction: F(1,20) = 5.962, P = 0.024). A post hoc Tukey test showed that R568 did not significantly increase IMI amplitude in normal calcium (P = 0.09), but it significantly increased it in low calcium (P < 0.001). Consistent with our previous findings, when R568 was not present, calcium did not significantly modulate IMI amplitude (P = 0.135), but when R568 was present, calcium significantly increased IMI amplitude (P < 0.001). These results suggest that R568 increases IMI amplitude, but the effect is stronger in low calcium than in normal calcium concentrations. This is consistent with what would be expected if the receptor was receiving saturating concentrations of calcium in the normal calcium condition, and thus having its maximal effect on the current’s voltage dependence (see discussion).
Fig. 7.
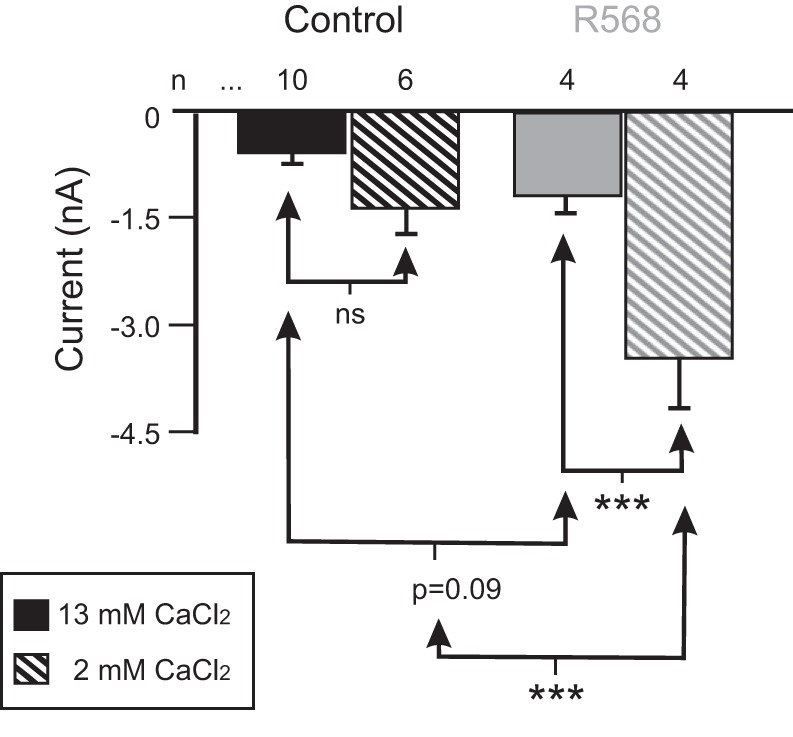
Role of the calcium sensing receptor (CaSR) in IMI amplitude. Proctolin-induced IMI in control (black) or in the presence of the CaSR agonist R568 (gray) was measured in either 13 mM (solid bars) or 2 mM CaCl2 saline (hatched bars). A two-way ANOVA for factors R568 and calcium showed significant changes in proctolin-induced IMI amplitude at −15 mV [calcium: F(1,20) = 18.301, P = 3.67 × 10⁻⁴; R568: F(1,20) = 23.447, P = 9.9 × 10⁻⁵; interaction: F(1,20) = 5.962, P = 0.024]. Post hoc Tukey test: ***P < 0.001; ns, not significant. Error bars are SE.
Negative results.
This work originally sought to identify an intermediate signaling molecule or pathway that enables neuromodulator receptors of the STG pyloric network to converge onto a common pathway that in turn activates IMI. Although a large amount of evidence appears to implicate calmodulin- and calcium-dependent paths in IMI activation, other pathways showed no evidence for being involved in IMI signaling. For the sake of completion, we describe briefly our negative findings below.
IMI activation is not sensitive to PLC or general serine-threonine kinase signaling.
Because phospholipase C (PLC) signaling often involves intracellular calcium concentration changes and some of the neuromodulators examined in this study are involved in PLC-mediated signaling elsewhere, we examined PLC signaling involvement in proctolin-induced IMI activation. As summarized in Table 2, neither the PLC inhibitor edelfosine nor neomycin, both of which have been shown to be effective in crustacean systems (edelfosine on crustacean proteins in an expression system: Clark et al. 2004; neomycin in adult STG cells: Levi and Selverston 2006) were capable of altering proctolin-induced IMI amplitude. Interestingly, the PKC and general kinase inhibitor staurosporine (Meggio et al. 1995) did not significantly alter IMI amplitude either (Table 2). These results suggest that the proctolin receptor does not activate IMI directly through PLC or a number of serine/threonine kinases given the known promiscuous effects of staurosporine on these kinases at the concentrations used (Meggio et al. 1995). This is also consistent with the findings of Swensen and Marder (2000), who reported that the PLC inhibitor U-73122 did not alter IMI activation (Swensen and Marder 2000).
We further examined several specific and nonspecific inhibitors of phosphatases and kinases to determine whether they play a role in proctolin-induced IMI activation. As summarized in Table 2, the general phosphatase inhibitor, okadaic acid did not significantly alter proctolin-induced IMI amplitude. Although the inhibitory effect of okadaic acid in normal calcium saline was not strictly significant at our criterion for significance (P < 0.05), it was close to statistical significance (P = 0.056), and furthermore, it was quite large (63%). Interestingly also, there was no effect of okadaic acid in low-calcium saline (P = 0.319; discussed below). Consistent with the inefficacy of okadaic acid, cyclosporin A, an inhibitor of the phosphatase calcineurin, did not alter IMI amplitude. Because both okadaic acid and cyclosporin A previously have been shown to be effective in this (Ransdell et al. 2012) and other crustacean species (Lin and Fu 2005; Nery et al. 1997), we interpret this as proctolin-induced IMI having little or no dependence on phosphatase activity, although the effect of okadaic acid in normal calcium saline may reflect a complex participation of phosphatases in this process.
Consistent with our staurosporine findings, neither the general tyrosine kinase inhibitor genistein nor the SRC kinase inhibitor dasatinib was capable of altering IMI amplitude (Table 2). Whereas genistein has been used previously in other crustacean systems (Chuo et al. 2005; Thiyagarajan et al. 2009), the use of dasatinib is, to our knowledge, unprecedented in crustacean systems. However, the findings that none of these three agents were capable of altering IMI activation suggests that tyrosine kinase signaling is not involved in IMI activation.
IMI amplitude is not sensitive to cyclic nucleotides.
We tested many drugs that are presumed to alter cyclic AMP (cAMP) signaling or downstream kinases, but they had no effect on IMI amplitude. As summarized in Table 2, neither the cAMP analog 8-Br-cAMP, the adenylyl cyclase agonist forskolin, nor the PKA inhibitor H89 produced significant changes in proctolin-induced IMI, although they all have been used effectively at lower concentrations in crustacean systems (forskolin and 8-Br-cAMP: Ballo et al. 2010; Flamm et al. 1987; Spruston and Nusbaum 1991; Zhang et al. 2010; H89: Zhang et al. 2010). These results do not fully rule out the possibility that cAMP could be involved in long-term regulation of IMI, but the lack of any effect during the application of these drugs suggests that cAMP signaling is not necessary for proctolin-induced IMI.
Similar to results found for 8-Br-cAMP, we found no effect for the cyclic GMP analog 8-Br-cGMP, another drug that has been successfully utilized in crustacean systems (Michel and Ache 1992; Spruston and Nusbaum 1991). These results are consistent with those reported by Swensen and Marder (2000) and suggest that IMI activation does not involve or require cyclic nucleotide signaling.
Does modifying IMI signaling pathways affect neuronal activity?
IMI modifies the activity of its target neurons. Because IMI is thought to be the pacemaker current of the pyloric network, via its effects on the pacemaker neurons of the network (Bose et al. 2014; Zhao et al. 2010), it would be expected that modifying IMI would affect the activity of the entire pyloric network. W7 and CDZ reduce both the amplitude of the current (Fig. 4) and its voltage dependence (Gray and Golowasch 2016; Swensen and Marder 2000). Therefore, modifying IMI amplitude and voltage dependence would be expected to change the frequency of the pyloric rhythm. We applied 1 μM CDZ in preparations with their full complement of neuromodulators intact (n = 3) or in decentralized preparations bathed in 0.1 μM proctolin (n = 4) to activate IMI enough to elicit rhythmic pyloric activity. Surprisingly, in neither case did we observe a statistically significant difference in pyloric rhythm frequency after ~60 min of application of CDZ compared with the control immediately before the application [non-decentralized/control: 1.26 ± 0.08 Hz; non-decentralized + CDZ: 1.26 ± 0.14 Hz; t(2) = 0.182, P = 0.972; decentralized + 0.1 μM proctolin/control: 0.40 ± 0.13 Hz; decentralized + 0.1 μM proctolin + CDZ: 0.36 ± 0.12 Hz; t(3) = 2.019, P = 0.137; paired Student t-tests]. A similar result was observed on two occasions with W7. Although these results were not what we initially expected, recent independent results (Golowasch et al. 2017) suggest an interesting mechanism by which this could occur (see discussion).
DISCUSSION
In this study we set out to dissect the mechanism by which the proctolin receptor activates its effector, the pacemaker current IMI. Proctolin is known not only as an activator of the pacemaker current of the system (Bose et al. 2014; Zhao et al. 2010) but also as a regulator of the correlated expression of a number of voltage-gated currents other than IMI (Khorkova and Golowasch 2007). Such correlated expression of multiple ionic currents in neurons is thought to be to be key to the generation of stable neuronal activity features (Bergquist et al. 2010; Golowasch 2015; Hudson and Prinz 2010; MacLean et al. 2005; Norris et al. 2011; O’Leary and Marder 2016; Zhao and Golowasch 2012). Thus a complete characterization of the proctolin signaling pathway is an important step in understanding the homeostatic regulation of activity in a central pattern generator such as the pyloric network, or neuronal networks in general.
We have shown that proctolin-induced IMI does indeed appear to be mediated by a G protein and is, therefore, most likely a G protein-coupled receptor (GPCR). This is consistent with recent findings that a proctolin receptor with the structural hallmarks of a GPCR in the lobster H. americanus (predicted from its transcriptome; Christie et al. 2015) and of a CCAP receptor with similar structural properties in C. borealis (predicted from its transcriptome; Garcia et al. 2015). However, unexpectedly, and in contrast with most known GPCR-mediated effects, extracellular calcium appeared to affect the G protein utilized by the proctolin receptor, as demonstrated by the finding that the sensitivity of proctolin-induced IMI amplitude to pertussis toxin appears to be modulated by extracellular calcium. Additionally, we have shown that IMI activation is sensitive to agents that modulate intracellular calcium, calmodulin, and calmodulin-activated proteins. Furthermore, the dual action of ryanodine receptor antagonists, calmodulin inhibitors, and calmodulin-activated kinase inhibitors on IMI suggests that the relationship between IMI activation and its voltage dependence is not as clearly separable as we initially hypothesized.
IMI activation does not depend on PLC, cyclic nucleotides or tyrosine kinases.
Despite the apparent involvement of intracellular calcium and calmodulin (presumably activated by intracellular calcium), we find little evidence to support any role on IMI activation for phospholipase C (PLC), normally an enzyme regulated by GPCRs and involved in the regulation of intracellular calcium levels (Kadamur and Ross 2013). Similarly, no evidence was found for involvement of cyclic nucleotides or tyrosine kinases.
In this study, we found a large role for calmodulin and intracellular calcium that is consistent with previous studies (Gray and Golowasch 2016; Swensen and Marder 2000). These results set up the expectation that PLC, which typically increases intracellular calcium release through inositol 3,4,5-trisphosphate (IP3) receptors (Portilla and Morrison 1986), could provide a likely mechanism by which the proctolin receptor is activated. Additionally, both proctolin (Baines et al. 1996; Groome and Watson 1989; Johnson et al. 2003b; Lange 1988; Mazzocco-Manneval et al. 1998; Philipp et al. 2006; Vezenkov and Danalev 2009) and muscarinic agonists (Heinrich et al. 2001; Trimmer 1995) have been associated with PLC signaling. Another reason we examined PLC signaling was the prevalence in vertebrates with similar voltage-dependent neuromodulator-activated cation currents being mediated by PLC signaling (Helliwell and Large 1997; Oh et al. 2003; Strübing et al. 2001). Additionally, many of the same neuromodulators that elicit IMI have been shown to activate PLC pathways in other invertebrate preparations (proctolin: Baines et al. 1996; Groome and Watson 1989; Lange 1988; Mazzocco-Manneval et al. 1998; Philipp et al. 2006; Vezenkov and Danalev 2009; muscarinic: Heinrich et al. 2001; Trimmer 1995). Despite these expectations, neither neomycin nor edelfosine was capable of altering IMI amplitude (Table 2). These results are consistent with the findings reported by Swensen and Marder (2000), who found that the potent PLC inhibitor U-73122 was also ineffective at modulating IMI. Similarly, and also consistent with Swensen and Marder (2000), we found no evidence of cyclic nucleotides, phosphatases, or tyrosine kinases (Table 2) being involved in IMI activation. The role for serine/threonine kinases, however, is somewhat less certain, and is discussed below.
IMI activation is modulated by intracellular calcium and targets of calmodulin: a tentative mechanism of IMI activation and amplification by calcium signaling.
We found that IMI amplitude was significantly altered by the calmodulin inhibitors W7 and CDZ, the ryanodine receptor antagonist dantrolene, the CaMKII inhibitor KN-93, and the MLCK inhibitor ML-7. Because MLCK and KN-93 are both calmodulin-activated kinases, and these other compounds target either pathways upstream or downstream of calmodulin, a central role is suggested for calmodulin and calcium signaling in IMI activation (Fig. 8). These results suggest that, at the very least, calcium-dependent proteins, likely including calmodulin-activated proteins, play a role in proctolin-induced IMI activation. As reported previously, extended periods in low extracellular calcium tend to reduce IMI amplitude (Gray and Golowasch 2016). This slow reduction in IMI amplitude is consistent with the involvement of intracellular calcium in IMI signaling. Interestingly, in “on” bipolar cells of the dogfish retina, intracellular calcium chelation or application of a CaMKII inhibitor reduces the voltage dependence of a cGMP/light-activated current (Shiells and Falk 2001).
Fig. 8.
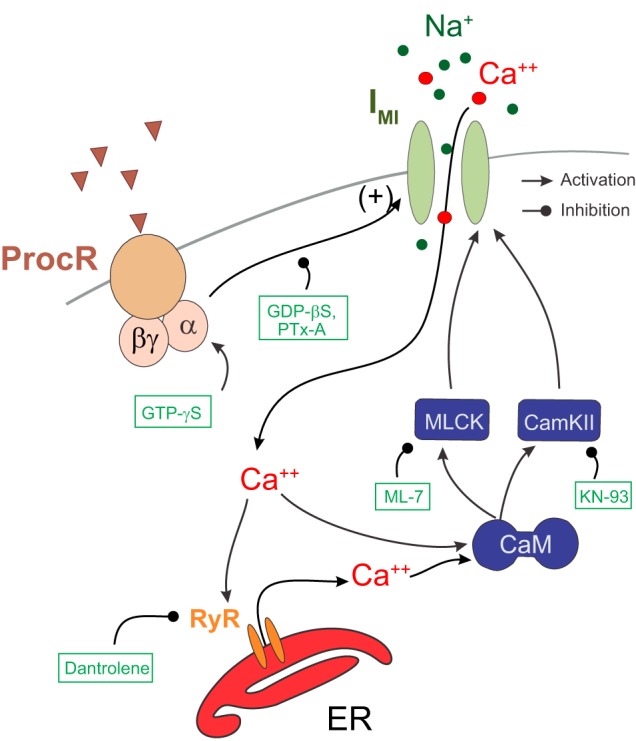
Proposed mechanism of activation for proctolin-induced IMI. According to this model, IMI channels are activated by a neuropeptide GPCR using a pertussis toxin-sensitive pathway that is independent from a different GPCR-mediated voltage-dependence pathway (not shown; cf. Gray and Golowasch 2016). Calmodulin (CaM) via calmodulin-dependent kinases CamKII and MLCK, activated by exogenous calcium entering the cell via either the IMI channels themselves (shown) or voltage-dependent calcium channels (not shown), amplifies the activation. This is aided by a further increase in intracellular calcium level due to calcium-induced calcium release mediated by RyRs. Blunt-ended lines show agents that inhibit the indicated paths; arrows indicate activating agents and pathways. ER, endoplasmic reticulum; ProcR, proctolin receptor; RyR ryanodine receptor.
Specifically, we propose the following working model: proctolin-induced IMI is activated by a pertussis toxin-sensitive G protein, in turn coupled to peptide and likely also muscarinic Ach receptors (Swensen and Marder 2000). It appears that, in addition to monovalent cations (Golowasch and Marder 1992b), the IMI channel may be partially permeable to calcium (see below). These calcium ions, and perhaps also additional calcium ions released from intracellular stores via calcium-induced calcium release, act on calcium-binding proteins such as calmodulin and calmodulin-binding proteins to amplify the proctolin-induced IMI response (Fig. 8). In this model, the proctolin receptor (and likely other receptors such as CCAP and muscarinic ACh receptors) are GPCRs that activate IMI via an unidentified G protein whose pertussis toxin sensitivity is modulated by external calcium concentration (see below).
Our suggestion that an elevated intracellular calcium level activates calmodulin, perhaps aided by calcium-induced calcium release, is supported by the finding that the calmodulin inhibitors W7 and CDZ both inhibit IMI amplitude. Calmodulin, in turn, activates MLCK and CaMKII. These calmodulin-activated kinases may amplify IMI activation, which is supported by our findings that ML-7 and KN-93 both reduce IMI amplitude. We also suggest that calcium-sensing receptor (CaSR; not shown in Fig. 8) may play an enabling role in IMI activation because 1) proctolin-induced IMI amplitude decreases faster in low extracellular calcium than in normal calcium (Gray and Golowasch 2016), and 2) whereas CaSR agonists augment IMI amplitude, CaSR antagonists do not reduce IMI amplitude (Gray and Golowasch 2016), as would be expected if CaSR played a direct role in IMI activation. This suggests that CaSR signaling may enhance IMI but is not necessary to activate it.
Our analysis is based on manipulations of the extracellular calcium concentration under the assumption that when the extracellular concentration is low (i.e., 2 mM), no significant changes in intracellular calcium concentration occur. We think that intracellular calcium is significantly affected only in the long term for two reasons. First, at 2 mM extracellular calcium, synaptic input to the LP neuron from the pyloric dilator and anterior burster (pacemaker) neurons is not abolished (data not shown), suggesting that calcium influx of some type is occurring via either Cd2+-insensitive calcium channels (cf. Johnson et al. 2003a) or by release from intracellular stores. Second, in Gray and Golowasch (2016), we reported that extended periods in low calcium reduce IMI amplitude. However, significant IMI reduction is not observed until ~4 h in low-calcium solution. Because our measurements were never performed after 4 h in low-calcium solutions, we believe that no significant intracellular calcium changes occur in our low-calcium saline solution.
Is IMI permeable to calcium?
Our model requires intracellular calcium-induced calcium release, which requires an initial source of calcium that could come from intracellular or extracellular sources. Zhao et al. (2011) have suggested that IMI could be permeable to calcium itself. This would provide a plausible source for the initial calcium required for activating dantrolene-sensitive ryanodine receptors. It seems more likely that the initial calcium originates from an external rather than canonical internal source, such as PLC-induced intracellular calcium release, because we saw no modulation of proctolin-induced IMI by PLC inhibitors (Table 2).
Another possible path for extracellular calcium influx is voltage-gated calcium channels. However, our experiments were conducted in the presence of 200 µM Cd2+, a concentration previously reported to block the majority of “observable” voltage-gated calcium currents in LP cells (Golowasch and Marder 1992a). Nevertheless, a calcium-imaging study in lobster STG neurons showed that 100 μM Cd2+ only reduces calcium peak activity by ~30% (Levi et al. 2003). Therefore, we cannot at this point discard the alternative hypothesis that influx through incompletely blocked voltage-gated calcium channels may trigger intracellular calcium-induced calcium release.
Proctolin-induced IMI activation is modulated by G proteins whose pertussis toxin sensitivity is modulated by extracellular calcium.
We found that proctolin-induced IMI is modulated by a G protein whose sensitivity to pertussis toxin appears to be modulated by extracellular calcium, with stronger inhibition at low than at normal (high) extracellular calcium levels (Fig. 3). Although unexpected, these calcium-dependent effects are not entirely unprecedented. Parathyroid hormone 1 receptors, for example, appear to use calcium as a weak agonist that can be switched to inverse agonist depending on extracellular calcium levels (Mitra et al. 2013). In addition, a large number of calcium-binding proteins regulate G protein receptor kinases (Sallese et al. 2000). Interestingly, our finding that okadaic acid may modulate IMI in normal calcium, but not low calcium, may suggest that IMI signaling is fundamentally altered in low vs. normal concentrations of extracellular calcium.
A possible explanation for the extracellular calcium modulation of pertussis toxin sensitivity derives from the findings that GPCR coupling to G proteins is more promiscuous than once thought (Gilman 1987; Knollman and Conn 2008; Lane et al. 2007; Wong and Ross 1994) and from the relatively recent finding that many regulators of G protein signaling (RGS) are inhibited by activated calmodulin (Popov et al. 2000). However, although the promiscuity of some Gα subunits, particularly of the Gαi and Gαo types, is not uncommon (Gilman 1987; Knollman and Conn 2008; Lane et al. 2007; Wong and Ross 1994), there are comparatively fewer available examples of this effect across pertussis toxin-sensitive (i.e., Gαs and Gαt) or pertussis-insensitive (i.e., Gαq) types (Katada 2012; Knollman and Conn 2008; Lane et al. 2007; Offermanns and Simon 1995; Wong and Ross 1994). This important aspect of IMI regulation deserves further in depth examination. A speculative model that may explain our observations of calcium-dependence of G protein signaling in IMI activation could become the basis of this exploration: according to this model, two simultaneous IMI activation pathways would exist. One pathway, which is pertussis toxin insensitive, would be active in normal calcium and would be amplified by calcium and calmodulin. A second, pertussis toxin-sensitive pathway, would dominate at low extracellular calcium levels. In normal calcium, a protein such as RGS10 (Popov et al. 2000), which undergoes inhibition by activated calmodulin and shows affinity for pertussis toxin-sensitive G protein (cf. Hepler 1999), would keep the second IMI pathway relatively inactive. When extracellular calcium is decreased, activated calmodulin inhibition of the second pathway is relieved due to lower calcium influx, increasing the relative contribution of the second pathway to activation of IMI. This would be consistent with our observation that the time course of IMI peak after washout of the neuromodulator seems slower in normal calcium (IMI is activated long after neuromodulator wash) relative to low calcium (IMI fades very quickly after the neuromodulator is washed out; data not shown), which could be due to CaMKII activation in normal calcium, for example.
Separation of voltage dependence and activation mechanisms.
In this and our previous study (Gray and Golowasch 2016), we targeted a number of signal transduction processes associated with IMI voltage dependence, and unexpected effects on IMI activation were observed. One example of this was the apparent enabling role for the CaSR on IMI activation. Although we propose that CaSR signaling enhances IMI, it is not necessary for it. This was due to the apparent incongruence between the findings of the CaSR agonist R568 and the antagonist NPS-2143. Although NPS-2143 modulates IMI voltage dependence (Gray and Golowasch 2016), it does so without altering IMI amplitude. R568 increases both IMI voltage dependence and IMI amplitude in an extracellular calcium-dependent way (more so in low calcium than in normal calcium). This suggests that there could be more cross talk between these pathways than we had originally predicted. Another example of this was the finding that the MLCK inhibitor ML-7 and the ryanodine antagonist dantrolene both reduced IMI voltage dependence (Gray and Golowasch 2016) and reduced IMI amplitude. Although any inhibitor would be expected to significantly increase IMI slope up to a slope of zero, an inhibitor would stop there and not increase slope further (e.g., GDPβS in normal calcium did exactly this; see Fig. 3). However, all three of these agents increased slope above zero, and the increase in IMI slope observed with R568 is the opposite of the predicted direction of pure augmentation, because slope should become more negative with increasing current size when voltage dependence is held constant. These findings for ML-7, CDZ, dantrolene, and R568 are, therefore, suggestive that a relation between IMI voltage dependence and activation exists. In light of these findings and the similar finding that the CaMKII inhibitor KN-93 has an effect on both IMI activation and voltage dependence, it appears that IMI activation and voltage dependence cannot be fully separated in these cases.
Why does modifying IMI signaling pathways not affect neuronal activity?
We were initially surprised to observe no significant effect of CDZ or W7 on the frequency of the pyloric rhythm. Related work performed as part of a separate project (Golowasch et al. 2017), however, may provide an explanation. When injection of IMI into the pacemaker neurons (PD neurons) in a decentralized (and thus not oscillating) pyloric network using the dynamic-clamp technique activates the pyloric rhythm (cf. Bose et al. 2014; Zhao et al. 2010) but very little dependence of the pyloric rhythm frequency on the amplitude of IMI is observed (Fig. 2B in Golowasch et al. 2017), the rhythm appears to be either fully activated or not at all. In our present experiments we attempted to modify IMI in all cells in the network with CDZ, either in pyloric networks activated by the full complement of naturally released neuromodulators (not decentralized) or in decentralized preparations with a 0.1 μM concentration of exogenously applied proctolin. In both cases, it is likely that the system is strongly activated and that IMI is not depressed enough by CDZ (see Fig. 4) to turn the rhythmic activity off. Thus no change in pyloric frequency is precisely what one would expect to observe. It is also possible that CDZ affects IMI differently in the pacemaker PD neurons than in the LP neurons studied in this work, thus explaining our observations. Therefore, we conclude that until a proper blocker of the ion channels that carry IMI is discovered, this test is unlikely to be successful.
In conclusion, we find that the IMI current, which acts as the pacemaker current in the pyloric network (Bose et al. 2014; Zhao et al. 2010), appears to be activated by a GPCR via a putatively calcium-dependent, pertussis toxin-sensitive G protein and is enhanced by intracellular calmodulin-dependent kinases such as CaMKII and MLCK. A full characterization of the entire signaling pathway requires a more in-depth examination, using more targeted and more specific molecular tools to manipulate individual pathway components that are not yet available. It will then be interesting to ask if the same pathway that activates IMI is involved in the neuromodulator-dependent regulation of the correlated expression of other voltage-gated ionic currents in these cells (Khorkova and Golowasch 2007). Because the regulation of the correlated expression of ionic currents in neurons appears to be key to the maintenance of overall stable features of cellular and network activity (Bergquist et al. 2010; Golowasch 2015; Hudson and Prinz 2010; MacLean et al. 2005; Norris et al. 2011; O’Leary and Marder 2016; Zhao and Golowasch 2012), understanding the signaling pathways involved is important.
GRANTS
This work was supported by National Institutes of Health Grants R01 MH64711 and R56 NS085330 (to J. Golowasch) and by a Fellowship from the Behavioral and Neural Science Graduate Program, Rutgers University-Newark (to M. Gray).
DISCLOSURES
No conflicts of interest, financial or otherwise, are declared by the authors.
AUTHOR CONTRIBUTIONS
M.G. and J.G. conceived and designed research; M.G. and D.H.D. performed experiments; M.G. and D.H.D. analyzed data; M.G. and J.G. interpreted results of experiments; M.G. and J.G. prepared figures; M.G. and J.G. drafted manuscript; M.G. and J.G. edited and revised manuscript; M.G., D.H.D., and J.G. approved final version of manuscript.
ACKNOWLEDGMENTS
We thank Drs. Farzan Nadim and Deborah Baro for comments and suggestions.
REFERENCES
- Baines RA, Walther C, Hinton JM, Osborne RH, Konopińska D. Selective activity of a proctolin analogue reveals the existence of two receptor subtypes. J Neurophysiol 75: 2647–2650, 1996. [DOI] [PubMed] [Google Scholar]
- Ballo AW, Keene JC, Troy PJ, Goeritz ML, Nadim F, Bucher D. Dopamine modulates Ih in a motor axon. J Neurosci 30: 8425–8434, 2010. doi: 10.1523/JNEUROSCI.0405-10.2010. [DOI] [PMC free article] [PubMed] [Google Scholar]
- Bergquist S, Dickman DK, Davis GW. A hierarchy of cell intrinsic and target-derived homeostatic signaling. Neuron 66: 220–234, 2010. doi: 10.1016/j.neuron.2010.03.023. [DOI] [PMC free article] [PubMed] [Google Scholar]
- Böhm C, Pangalos M, Schmitz D, Winterer J. Serotonin attenuates feedback excitation onto O-LM interneurons. Cereb Cortex 25: 4572–4583, 2015. doi: 10.1093/cercor/bhv098. [DOI] [PMC free article] [PubMed] [Google Scholar]
- Bose A, Golowasch J, Guan Y, Nadim F. The role of linear and voltage-dependent ionic currents in the generation of slow wave oscillations. J Comput Neurosci 37: 229–242, 2014. doi: 10.1007/s10827-014-0498-4. [DOI] [PMC free article] [PubMed] [Google Scholar]
- Christie AE, Chi M, Lameyer TJ, Pascual MG, Shea DN, Stanhope ME, Schulz DJ, Dickinson PS. Neuropeptidergic signaling in the American lobster Homarus americanus: new insights from high-throughput nucleotide sequencing. PLoS One 10: e0145964, 2015. doi: 10.1371/journal.pone.0145964. [DOI] [PMC free article] [PubMed] [Google Scholar]
- Chuo CP, Liang SM, Sung HH. Signal transduction of the prophenoloxidase activating system of prawn haemocytes triggered by CpG oligodeoxynucleotides. Fish Shellfish Immunol 18: 149–162, 2005. doi: 10.1016/j.fsi.2004.06.009. [DOI] [PubMed] [Google Scholar]
- Clark MC, Dever TE, Dever JJ, Xu P, Rehder V, Sosa MA, Baro DJ. Arthropod 5-HT2 receptors: a neurohormonal receptor in decapod crustaceans that displays agonist independent activity resulting from an evolutionary alteration to the DRY motif. J Neurosci 24: 3421–3435, 2004. doi: 10.1523/JNEUROSCI.0062-04.2004. [DOI] [PMC free article] [PubMed] [Google Scholar]
- Clark MC, Khan R, Baro DJ. Crustacean dopamine receptors: localization and G protein coupling in the stomatogastric ganglion. J Neurochem 104: 1006–1019, 2008. doi: 10.1111/j.1471-4159.2007.05029.x. [DOI] [PMC free article] [PubMed] [Google Scholar]
- Dickinson PS. Neuromodulation of central pattern generators in invertebrates and vertebrates. Curr Opin Neurobiol 16: 604–614, 2006. doi: 10.1016/j.conb.2006.10.007. [DOI] [PubMed] [Google Scholar]
- Doi A, Ramirez JM. Neuromodulation and the orchestration of the respiratory rhythm. Respir Physiol Neurobiol 164: 96–104, 2008. doi: 10.1016/j.resp.2008.06.007. [DOI] [PMC free article] [PubMed] [Google Scholar]
- Eckstein F, Cassel D, Levkovitz H, Lowe M, Selinger Z. Guanosine 5′-O-(2-thiodiphosphate). An inhibitor of adenylate cyclase stimulation by guanine nucleotides and fluoride ions. J Biol Chem 254: 9829–9834, 1979. [PubMed] [Google Scholar]
- Fénelon VS, Casasnovas B, Simmers J, Meyrand P. Development of rhythmic pattern generators. Curr Opin Neurobiol 8: 705–709, 1998. doi: 10.1016/S0959-4388(98)80111-6. [DOI] [PubMed] [Google Scholar]
- Flamm RE, Fickbohm D, Harris-Warrick RM. cAMP elevation modulates physiological activity of pyloric neurons in the lobster stomatogastric ganglion. J Neurophysiol 58: 1370–1386, 1987. [DOI] [PubMed] [Google Scholar]
- Garcia VJ, Daur N, Temporal S, Schulz DJ, Bucher D. Neuropeptide receptor transcript expression levels and magnitude of ionic current responses show cell type-specific differences in a small motor circuit. J Neurosci 35: 6786–6800, 2015. doi: 10.1523/JNEUROSCI.0171-15.2015. [DOI] [PMC free article] [PubMed] [Google Scholar]
- Gilman AG. G proteins: transducers of receptor-generated signals. Annu Rev Biochem 56: 615–649, 1987. doi: 10.1146/annurev.bi.56.070187.003151. [DOI] [PubMed] [Google Scholar]
- Golowasch J. Stability and homeostasis in small network central pattern generators. In: Encyclopedia of Computational Neuroscience, edited by Jaeger D and Jung R. New York: Springer, 2015, p. 2858–2864. doi: 10.1007/978-1-4614-6675-8_466. [DOI] [Google Scholar]
- Golowasch J, Abbott LF, Marder E. Activity-dependent regulation of potassium currents in an identified neuron of the stomatogastric ganglion of the crab Cancer borealis. J Neurosci 19: RC33, 1999. [DOI] [PMC free article] [PubMed] [Google Scholar]
- Golowasch J, Bose A, Guan Y, Salloum D, Roeser A, Nadim F. A balance of outward and linear inward ionic currents is required for generation of slow-wave oscillations. J Neurophysiol. doi: 10.1152/jn.00240.2017 [Epub ahead of print]. [DOI] [PMC free article] [PubMed] [Google Scholar]
- Golowasch J, Marder E. Ionic currents of the lateral pyloric neuron of the stomatogastric ganglion of the crab. J Neurophysiol 67: 318–331, 1992a. [DOI] [PubMed] [Google Scholar]
- Golowasch J, Marder E. Proctolin activates an inward current whose voltage dependence is modified by extracellular Ca2+. J Neurosci 12: 810–817, 1992b. [DOI] [PMC free article] [PubMed] [Google Scholar]
- Goudeau H, Goudeau M. Voltage dependence of the [Ca2+]i oscillations system, in the Mg2+-stimulated oocyte of the prawn Palaemon serratus. Cell Calcium 29: 97–109, 2001. doi: 10.1054/ceca.2000.0174. [DOI] [PubMed] [Google Scholar]
- Gray M, Golowasch J. Voltage dependence of a neuromodulator-activated ionic current. eNeuro 3: 1–19, 2016. doi: 10.1523/ENEURO.0038-16.2016. [DOI] [PMC free article] [PubMed] [Google Scholar]
- Groome JR, Watson WH 3rd. Second-messenger systems underlying amine and peptide actions on cardiac muscle in the horseshoe crab Limulus polyphemus. J Exp Biol 145: 419–437, 1989. [DOI] [PubMed] [Google Scholar]
- Gutierrez GJ, Grashow RG. Cancer borealis stomatogastric nervous system dissection. J Vis Exp 25: e1207, 2009. doi: 10.3791/1207. [DOI] [PMC free article] [PubMed] [Google Scholar]
- Hainaut K, Desmedt JE. Effect of dantrolene sodium on calcium movements in single muscle fibres. Nature 252: 728–730, 1974. doi: 10.1038/252728a0. [DOI] [PubMed] [Google Scholar]
- Harris-Warrick RM, Johnson BR, Peck JH, Kloppenburg P, Ayali A, Skarbinski J. Distributed effects of dopamine modulation in the crustacean pyloric network. Ann N Y Acad Sci 860: 155–167, 1998. doi: 10.1111/j.1749-6632.1998.tb09046.x. [DOI] [PubMed] [Google Scholar]
- Heinrich R, Wenzel B, Elsner N. Pharmacological brain stimulation releases elaborate stridulatory behaviour in gomphocerine grasshoppers—conclusions for the organization of the central nervous control. J Comp Physiol A Neuroethol Sens Neural Behav Physiol 187: 155–169, 2001. doi: 10.1007/s003590100188. [DOI] [PubMed] [Google Scholar]
- Helliwell RM, Large WA. α1-Adrenoceptor activation of a non-selective cation current in rabbit portal vein by 1,2-diacyl-sn-glycerol. J Physiol 499: 417–428, 1997. doi: 10.1113/jphysiol.1997.sp021938. [DOI] [PMC free article] [PubMed] [Google Scholar]
- Hepler JR. Emerging roles for RGS proteins in cell signalling. Trends Pharmacol Sci 20: 376–382, 1999. doi: 10.1016/S0165-6147(99)01369-3. [DOI] [PubMed] [Google Scholar]
- Hooper SL, Marder E. Modulation of a central pattern generator by two neuropeptides, proctolin and FMRFamide. Brain Res 305: 186–191, 1984. doi: 10.1016/0006-8993(84)91138-7. [DOI] [PubMed] [Google Scholar]
- Hooper SL, Moulins M. Switching of a neuron from one network to another by sensory-induced changes in membrane properties. Science 244: 1587–1589, 1989. doi: 10.1126/science.2740903. [DOI] [PubMed] [Google Scholar]
- Hooper SL, Moulins M. Cellular and synaptic mechanisms responsible for a long-lasting restructuring of the lobster pyloric network. J Neurophysiol 64: 1574–1589, 1990. [DOI] [PubMed] [Google Scholar]
- Hudson AE, Prinz AA. Conductance ratios and cellular identity. PLOS Comput Biol 6: e1000838, 2010. doi: 10.1371/journal.pcbi.1000838. [DOI] [PMC free article] [PubMed] [Google Scholar]
- Jaber M, Robinson SW, Missale C, Caron MG. Dopamine receptors and brain function. Neuropharmacology 35: 1503–1519, 1996. doi: 10.1016/S0028-3908(96)00100-1. [DOI] [PubMed] [Google Scholar]
- Johnson BR, Kloppenburg P, Harris-Warrick RM. Dopamine modulation of calcium currents in pyloric neurons of the lobster stomatogastric ganglion. J Neurophysiol 90: 631–643, 2003a. doi: 10.1152/jn.00037.2003. [DOI] [PubMed] [Google Scholar]
- Johnson BR, Peck JH, Harris-Warrick RM. Amine modulation of electrical coupling in the pyloric network of the lobster stomatogastric ganglion. J Comp Physiol A Neuroethol Sens Neural Behav Physiol 172: 715–732, 1993a. doi: 10.1007/BF00195397. [DOI] [PubMed] [Google Scholar]
- Johnson BR, Peck JH, Harris-Warrick RM. Dopamine induces sign reversal at mixed chemical-electrical synapses. Brain Res 625: 159–164, 1993b. doi: 10.1016/0006-8993(93)90149-H. [DOI] [PubMed] [Google Scholar]
- Johnson BR, Peck JH, Harris-Warrick RM. Distributed amine modulation of graded chemical transmission in the pyloric network of the lobster stomatogastric ganglion. J Neurophysiol 74: 437–452, 1995. [DOI] [PubMed] [Google Scholar]
- Johnson EC, Garczynski SF, Park D, Crim JW, Nassel DR, Taghert PH. Identification and characterization of a G protein-coupled receptor for the neuropeptide proctolin in Drosophila melanogaster. Proc Natl Acad Sci USA 100: 6198–6203, 2003b. doi: 10.1073/pnas.1030108100. [DOI] [PMC free article] [PubMed] [Google Scholar]
- Kadamur G, Ross EM. Mammalian phospholipase C. Annu Rev Physiol 75: 127–154, 2013. doi: 10.1146/annurev-physiol-030212-183750. [DOI] [PubMed] [Google Scholar]
- Katada T. The inhibitory G protein Gi identified as pertussis toxin-catalyzed ADP-ribosylation. Biol Pharm Bull 35: 2103–2111, 2012. doi: 10.1248/bpb.b212024. [DOI] [PubMed] [Google Scholar]
- Khorkova O, Golowasch J. Neuromodulators, not activity, control coordinated expression of ionic currents. J Neurosci 27: 8709–8718, 2007. doi: 10.1523/JNEUROSCI.1274-07.2007. [DOI] [PMC free article] [PubMed] [Google Scholar]
- Knollman PE, Conn PM. Multiple G proteins compete for binding with the human gonadotropin releasing hormone receptor. Arch Biochem Biophys 477: 92–97, 2008. doi: 10.1016/j.abb.2008.05.011. [DOI] [PMC free article] [PubMed] [Google Scholar]
- Koch H, Garcia AJ III, Ramirez JM. Network reconfiguration and neuronal plasticity in rhythm-generating networks. Integr Comp Biol 51: 856–868, 2011. doi: 10.1093/icb/icr099. [DOI] [PMC free article] [PubMed] [Google Scholar]
- Lane JR, Powney B, Wise A, Rees S, Milligan G. Protean agonism at the dopamine D2 receptor: (S)-3-(3-hydroxyphenyl)-N-propylpiperidine is an agonist for activation of Go1 but an antagonist/inverse agonist for Gi1,Gi2, and Gi3. Mol Pharmacol 71: 1349–1359, 2007. doi: 10.1124/mol.106.032722. [DOI] [PubMed] [Google Scholar]
- Lange AB. Inositol phospholipid hydrolysis may mediate the action of proctolin on insect visceral muscle. Arch Insect Biochem Physiol 9: 201–209, 1988. doi: 10.1002/arch.940090304. [DOI] [Google Scholar]
- Lawrence JJ, Haario H, Stone EF. Presynaptic cholinergic neuromodulation alters the temporal dynamics of short-term depression at parvalbumin-positive basket cell synapses from juvenile CA1 mouse hippocampus. J Neurophysiol 113: 2408–2419, 2015. doi: 10.1152/jn.00167.2014. [DOI] [PMC free article] [PubMed] [Google Scholar]
- LeBeau FE, El Manira A, Griller S. Tuning the network: modulation of neuronal microcircuits in the spinal cord and hippocampus. Trends Neurosci 28: 552–561, 2005. doi: 10.1016/j.tins.2005.08.005. [DOI] [PubMed] [Google Scholar]
- Levi R, Samoilova M, Selverston AI. Calcium signaling components of oscillating invertebrate neurons in vitro. Neuroscience 118: 283–296, 2003. doi: 10.1016/S0306-4522(02)00973-9. [DOI] [PubMed] [Google Scholar]
- Levi R, Selverston AI. Mechanisms underlying type I mGluR-induced activation of lobster gastric mill neurons. J Neurophysiol 96: 3378–3388, 2006. doi: 10.1152/jn.00591.2005. [DOI] [PubMed] [Google Scholar]
- Lieske SP, Thoby-Brisson M, Telgkamp P, Ramirez JM. Reconfiguration of the neural network controlling multiple breathing patterns: eupnea, sighs and gasps [see comment]. Nat Neurosci 3: 600–607, 2000. doi: 10.1038/75776. [DOI] [PubMed] [Google Scholar]
- Lin JW, Fu Q. Modulation of available vesicles and release kinetics at the inhibitor of the crayfish neuromuscular junction. Neuroscience 130: 889–895, 2005. doi: 10.1016/j.neuroscience.2004.10.023. [DOI] [PubMed] [Google Scholar]
- Lu B, Su Y, Das S, Wang H, Wang Y, Liu J, Ren D. Peptide neurotransmitters activate a cation channel complex of NALCN and UNC-80. Nature 457: 741–744, 2009. doi: 10.1038/nature07579. [DOI] [PMC free article] [PubMed] [Google Scholar]
- Lutas A, Lahmann C, Soumillon M, Yellen G. The leak channel NALCN controls tonic firing and glycolytic sensitivity of substantia nigra pars reticulata neurons. eLife 5: e15271, 2016. doi: 10.7554/eLife.15271. [DOI] [PMC free article] [PubMed] [Google Scholar]
- Luther JA, Robie AA, Yarotsky J, Reina C, Marder E, Golowasch J. Episodic bouts of activity accompany recovery of rhythmic output by a neuromodulator- and activity-deprived adult neural network. J Neurophysiol 90: 2720–2730, 2003. doi: 10.1152/jn.00370.2003. [DOI] [PMC free article] [PubMed] [Google Scholar]
- Mackey SL, Kandel ER, Hawkins RD. Identified serotonergic neurons LCB1 and RCB1 in the cerebral ganglia of Aplysia produce presynaptic facilitation of siphon sensory neurons. J Neurosci 9: 4227–4235, 1989. [DOI] [PMC free article] [PubMed] [Google Scholar]
- MacLean JN, Zhang Y, Goeritz ML, Casey R, Oliva R, Guckenheimer J, Harris-Warrick RM. Activity-independent coregulation of IA and Ih in rhythmically active neurons. J Neurophysiol 94: 3601–3617, 2005. doi: 10.1152/jn.00281.2005. [DOI] [PubMed] [Google Scholar]
- Marder E. Neuromodulation of neuronal circuits: back to the future. Neuron 76: 1–11, 2012. doi: 10.1016/j.neuron.2012.09.010. [DOI] [PMC free article] [PubMed] [Google Scholar]
- Marder E, Bucher D. Understanding circuit dynamics using the stomatogastric nervous system of lobsters and crabs. Annu Rev Physiol 69: 291–316, 2007. doi: 10.1146/annurev.physiol.69.031905.161516. [DOI] [PubMed] [Google Scholar]
- Marder E, O’Leary T, Shruti S. Neuromodulation of circuits with variable parameters: single neurons and small circuits reveal principles of state-dependent and robust neuromodulation. Annu Rev Neurosci 37: 329–346, 2014. doi: 10.1146/annurev-neuro-071013-013958. [DOI] [PubMed] [Google Scholar]
- Maynard DM, Dando MR. The structure of the stomatogastric neuromuscular system in Callinectes sapidus, Homarus americanus and Panulirus argus (Decapoda Crustacea). Philos Trans R Soc Lond B Biol Sci 268: 161–220, 1974. doi: 10.1098/rstb.1974.0024. [DOI] [PubMed] [Google Scholar]
- Mazzocco-Manneval C, Kuczer M, Konopinska D, Fournier B, Loughton BG, Puiroux J. Pharmacological studies of proctolin receptors on foregut and hindgut of Blaberus craniifer. Peptides 19: 1641–1651, 1998. doi: 10.1016/S0196-9781(98)00120-X. [DOI] [PubMed] [Google Scholar]
- Meggio F, Donella Deana A, Ruzzene M, Brunati AM, Cesaro L, Guerra B, Meyer T, Mett H, Fabbro D, Furet P, Dobrowolska G, Pinna LA. Different susceptibility of protein kinases to staurosporine inhibition. Kinetic studies and molecular bases for the resistance of protein kinase CK2. Eur J Biochem 234: 317–322, 1995. doi: 10.1111/j.1432-1033.1995.317_c.x. [DOI] [PubMed] [Google Scholar]
- Michel WC, Ache BW. Cyclic nucleotides mediate an odor-evoked potassium conductance in lobster olfactory receptor cells. J Neurosci 12: 3979–3984, 1992. [DOI] [PMC free article] [PubMed] [Google Scholar]
- Miles GB, Sillar KT. Neuromodulation of vertebrate locomotor control networks. Physiology (Bethesda) 26: 393–411, 2011. doi: 10.1152/physiol.00013.2011. [DOI] [PubMed] [Google Scholar]
- Mitra N, Liu Y, Liu J, Serebryany E, Mooney V, DeVree BT, Sunahara RK, Yan EC. Calcium-dependent ligand binding and G-protein signaling of family B GPCR parathyroid hormone 1 receptor purified in nanodiscs. ACS Chem Biol 8: 617–625, 2013. doi: 10.1021/cb300466n. [DOI] [PMC free article] [PubMed] [Google Scholar]
- Nery LE, da Silva MA, Josefsson L, Castrucci AM. Cellular signalling of PCH-induced pigment aggregation in the crustacean Macrobrachium potiuna erythrophores. J Comp Physiol B 167: 570–575, 1997. doi: 10.1007/s003600050111. [DOI] [PubMed] [Google Scholar]
- Norris BJ, Wenning A, Wright TM, Calabrese RL. Constancy and variability in the output of a central pattern generator. J Neurosci 31: 4663–4674, 2011. doi: 10.1523/JNEUROSCI.5072-10.2011. [DOI] [PMC free article] [PubMed] [Google Scholar]
- O’Leary T, Marder E. Temperature-robust neural function from activity-dependent ion channel regulation. Curr Biol 26: 2935–2941, 2016. doi: 10.1016/j.cub.2016.08.061. [DOI] [PMC free article] [PubMed] [Google Scholar]
- Obukhov AG, Schultz G, Lückhoff A. Regulation of heterologously expressed transient receptor potential-like channels by calcium ions. Neuroscience 85: 487–495, 1998. doi: 10.1016/S0306-4522(97)00616-7. [DOI] [PubMed] [Google Scholar]
- Offermanns S, Simon MI. Gα15 and Gα16 couple a wide variety of receptors to phospholipase C. J Biol Chem 270: 15175–15180, 1995. doi: 10.1074/jbc.270.25.15175. [DOI] [PubMed] [Google Scholar]
- Oh EJ, Gover TD, Cordoba-Rodriguez R, Weinreich D. Substance P evokes cation currents through TRP channels in HEK293 cells. J Neurophysiol 90: 2069–2073, 2003. doi: 10.1152/jn.00026.2003. [DOI] [PubMed] [Google Scholar]
- Olson PA, Tkatch T, Hernandez-Lopez S, Ulrich S, Ilijic E, Mugnaini E, Zhang H, Bezprozvanny I, Surmeier DJ. G-protein-coupled receptor modulation of striatal CaV1.3 L-type Ca2+ channels is dependent on a Shank-binding domain. J Neurosci 25: 1050–1062, 2005. doi: 10.1523/JNEUROSCI.3327-04.2005. [DOI] [PMC free article] [PubMed] [Google Scholar]
- Pawlak V, Wickens JR, Kirkwood A, Kerr JN. Timing is not everything: neuromodulation opens the STDP gate. Front Synaptic Neurosci 2: 146, 2010. doi: 10.3389/fnsyn.2010.00146. [DOI] [PMC free article] [PubMed] [Google Scholar]
- Philipp B, Rogalla N, Kreissl S. The neuropeptide proctolin potentiates contractions and reduces cGMP concentration via a PKC-dependent pathway. J Exp Biol 209: 531–540, 2006. doi: 10.1242/jeb.02011. [DOI] [PubMed] [Google Scholar]
- Popov SG, Krishna UM, Falck JR, Wilkie TM. Ca2+/calmodulin reverses phosphatidylinositol 3,4,5-trisphosphate-dependent inhibition of regulators of G protein-signaling GTPase-activating protein activity. J Biol Chem 275: 18962–18968, 2000. doi: 10.1074/jbc.M001128200. [DOI] [PubMed] [Google Scholar]
- Portilla D, Morrison AR. Bradykinin-induced changes in inositol trisphosphate mass in MDCK cells. Biochem Biophys Res Commun 140: 644–649, 1986. doi: 10.1016/0006-291X(86)90780-1. [DOI] [PubMed] [Google Scholar]
- Ramirez JM. Reconfiguration of the respiratory network at the onset of locust flight. J Neurophysiol 80: 3137–3147, 1998. [DOI] [PubMed] [Google Scholar]
- Ransdell JL, Nair SS, Schulz DJ. Rapid homeostatic plasticity of intrinsic excitability in a central pattern generator network stabilizes functional neural network output. J Neurosci 32: 9649–9658, 2012. doi: 10.1523/JNEUROSCI.1945-12.2012. [DOI] [PMC free article] [PubMed] [Google Scholar]
- Sallese M, Iacovelli L, Cumashi A, Capobianco L, Cuomo L, De Blasi A. Regulation of G protein-coupled receptor kinase subtypes by calcium sensor proteins. Biochim Biophys Acta 1498: 112–121, 2000. doi: 10.1016/S0167-4889(00)00088-4. [DOI] [PubMed] [Google Scholar]
- Shiells RA, Falk G. Rectification of cGMP-activated channels induced by phosphorylation in dogfish retinal ‘on’ bipolar cells. J Physiol 535: 697–702, 2001. doi: 10.1111/j.1469-7793.2001.00697.x. [DOI] [PMC free article] [PubMed] [Google Scholar]
- Small SA, Cohen TE, Kandel ER, Hawkins RD. Identified FMRFamide-immunoreactive neuron LPL16 in the left pleural ganglion of Aplysia produces presynaptic inhibition of siphon sensory neurons. J Neurosci 12: 1616–1627, 1992. [DOI] [PMC free article] [PubMed] [Google Scholar]
- Spitzer N, Edwards DH, Baro DJ. Conservation of structure, signaling and pharmacology between two serotonin receptor subtypes from decapod crustaceans, Panulirus interruptus and Procambarus clarkii. J Exp Biol 211: 92–105, 2008. doi: 10.1242/jeb.012450. [DOI] [PMC free article] [PubMed] [Google Scholar]
- Spruston N, Nusbaum MP. Cyclic nucleotide-mediated modulation of the pyloric motor pattern in the stomatogastric ganglion of the crab Cancer borealis. Biol Bull 181: 329–330, 1991. doi: 10.1086/BBLv181n2p329. [DOI] [PubMed] [Google Scholar]
- Strübing C, Krapivinsky G, Krapivinsky L, Clapham DE. TRPC1 and TRPC5 form a novel cation channel in mammalian brain. Neuron 29: 645–655, 2001. doi: 10.1016/S0896-6273(01)00240-9. [DOI] [PubMed] [Google Scholar]
- Swensen AM, Marder E. Multiple peptides converge to activate the same voltage-dependent current in a central pattern-generating circuit. J Neurosci 20: 6752–6759, 2000. [DOI] [PMC free article] [PubMed] [Google Scholar]
- Swensen AM, Marder E. Modulators with convergent cellular actions elicit distinct circuit outputs. J Neurosci 21: 4050–4058, 2001. [DOI] [PMC free article] [PubMed] [Google Scholar]
- Thiyagarajan V, Wong T, Qian PY. 2D gel-based proteome and phosphoproteome analysis during larval metamorphosis in two major marine biofouling invertebrates. J Proteome Res 8: 2708–2719, 2009. doi: 10.1021/pr800976u. [DOI] [PubMed] [Google Scholar]
- Thoby-Brisson M, Simmers J. Neuromodulatory inputs maintain expression of a lobster motor pattern-generating network in a modulation-dependent state: evidence from long-term decentralization in vitro. J Neurosci 18: 2212–2225, 1998. [DOI] [PMC free article] [PubMed] [Google Scholar]
- Thoby-Brisson M, Simmers J. Transition to endogenous bursting after long-term decentralization requires de novo transcription in a critical time window. J Neurophysiol 84: 596–599, 2000. [DOI] [PubMed] [Google Scholar]
- Thoby-Brisson M, Simmers J. Long-term neuromodulatory regulation of a motor pattern-generating network: maintenance of synaptic efficacy and oscillatory properties. J Neurophysiol 88: 2942–2953, 2002. doi: 10.1152/jn.00482.2001. [DOI] [PubMed] [Google Scholar]
- Trimmer BA. Current excitement from insect muscarinic receptors. Trends Neurosci 18: 104–111, 1995. doi: 10.1016/0166-2236(95)80032-W. [DOI] [PubMed] [Google Scholar]
- Uzdensky A, Lobanov A, Bibov M, Petin Y. Involvement of Ca2+- and cyclic adenosine monophosphate-mediated signaling pathways in photodynamic injury of isolated crayfish neuron and satellite glial cells. J Neurosci Res 85: 860–870, 2007. doi: 10.1002/jnr.21190. [DOI] [PubMed] [Google Scholar]
- Vezenkov SR, Danalev DL. From molecule to sexual behavior: the role of the neuropentapeptide proctolin in acoustic communication in the male grasshopper Chorthippus biguttulus. Eur J Pharmacol 619: 57–60, 2009. doi: 10.1016/j.ejphar.2009.08.010. [DOI] [PubMed] [Google Scholar]
- Vilim FS, Sasaki K, Rybak J, Alexeeva V, Cropper EC, Jing J, Orekhova IV, Brezina V, Price D, Romanova EV, Rubakhin SS, Hatcher N, Sweedler JV, Weiss KR. Distinct mechanisms produce functionally complementary actions of neuropeptides that are structurally related but derived from different precursors. J Neurosci 30: 131–147, 2010. doi: 10.1523/JNEUROSCI.3282-09.2010. [DOI] [PMC free article] [PubMed] [Google Scholar]
- Wei JW, Wang MC. Muscarinic M2 receptors coupled to inhibition of adenylate cyclase in rat heart. Chin J Physiol 33: 315–327, 1990. [PubMed] [Google Scholar]
- Withers MD, Kennedy MB, Marder E, Griffith LC. Characterization of calcium/calmodulin-dependent protein kinase II activity in the nervous system of the lobster, Panulirus interruptus. Invert Neurosci 3: 335–345, 1998. doi: 10.1007/BF02577693. [DOI] [PubMed] [Google Scholar]
- Wong SK, Ross EM. Chimeric muscarinic cholinergic:β-adrenergic receptors that are functionally promiscuous among G proteins. J Biol Chem 269: 18968–18976, 1994. [PubMed] [Google Scholar]
- Wu JS, Vilim FS, Hatcher NG, Due MR, Sweedler JV, Weiss KR, Jing J. Composite modulatory feedforward loop contributes to the establishment of a network state. J Neurophysiol 103: 2174–2184, 2010. doi: 10.1152/jn.01054.2009. [DOI] [PMC free article] [PubMed] [Google Scholar]
- Xi M, Fung SJ, Yamuy J, Chase MH. Interactions between hypocretinergic and GABAergic systems in the control of activity of neurons in the cat pontine reticular formation. Neuroscience 298: 190–199, 2015. doi: 10.1016/j.neuroscience.2015.04.022. [DOI] [PubMed] [Google Scholar]
- Zhang H, Rodgers EW, Krenz WD, Clark MC, Baro DJ. Cell specific dopamine modulation of the transient potassium current in the pyloric network by the canonical D1 receptor signal transduction cascade. J Neurophysiol 104: 873–884, 2010. doi: 10.1152/jn.00195.2010. [DOI] [PMC free article] [PubMed] [Google Scholar]
- Zhao F, Li P, Chen SR, Louis CF, Fruen BR. Dantrolene inhibition of ryanodine receptor Ca2+ release channels. Molecular mechanism and isoform selectivity. J Biol Chem 276: 13810–13816, 2001. doi: 10.1074/jbc.M006104200. [DOI] [PubMed] [Google Scholar]
- Zhao S, Golowasch J. Ionic current correlations underlie the global tuning of large numbers of neuronal activity attributes. J Neurosci 32: 13380–13388, 2012. doi: 10.1523/JNEUROSCI.6500-11.2012. [DOI] [PMC free article] [PubMed] [Google Scholar]
- Zhao S, Golowasch J, Nadim F. Pacemaker neuron and network oscillations depend on a neuromodulator-regulated linear current. Front Behav Neurosci 4: 21, 2010. doi: 10.3389/fnbeh.2010.00021. [DOI] [PMC free article] [PubMed] [Google Scholar]
- Zhao S, Sheibanie AF, Oh M, Rabbah P, Nadim F. Peptide neuromodulation of synaptic dynamics in an oscillatory network. J Neurosci 31: 13991–14004, 2011. doi: 10.1523/JNEUROSCI.3624-11.2011. [DOI] [PMC free article] [PubMed] [Google Scholar]
- Zhou L, Zhao S, Nadim F. Neuromodulation of short-term synaptic dynamics examined in a mechanistic model based on kinetics of calcium currents. Neurocomputing 70: 2050–2054, 2007. doi: 10.1016/j.neucom.2006.10.084. [DOI] [PMC free article] [PubMed] [Google Scholar]