

We develop and experimentally verify an electrical circuit model describing cross-talk that necessarily occurs between two channels. Recorded cross-talk increased with electrode impedance and signal frequency. We recorded cross-talk contamination of spike waveforms from intracellular to extracellular channels. We simulated high-density multichannel extracellular recordings and demonstrate spatial smoothing and phase shifts that cross-talk enacts on CSD measurements. However, when channels record similar-magnitude signals, effects are modest and unlikely to affect most conclusions.
Keywords: methods, distortion, capacitance, action potential, impedance
Abstract
Modern neurophysiological experiments frequently involve multiple channels separated by very small distances. A unique methodological concern for multiple-electrode experiments is that of capacitive coupling (cross-talk) between channels. Yet the nature of the cross-talk recording circuit is not well known in the field, and the extent to which it practically affects neurophysiology experiments has never been fully investigated. Here we describe a simple electrical circuit model of simultaneous recording and stimulation with two or more channels and experimentally verify the model using ex vivo brain slice and in vivo whole-brain preparations. In agreement with the model, we find that cross-talk amplitudes increase nearly linearly with the impedance of a recording electrode and are larger for higher frequencies. We demonstrate cross-talk contamination of action potential waveforms from intracellular to extracellular channels, which is observable in part because of the different orders of magnitude between the channels. This contamination is electrode impedance-dependent and matches predictions from the model. We use recently published parameters to simulate cross-talk in high-density multichannel extracellular recordings. Cross-talk effectively spatially smooths current source density (CSD) estimates in these recordings and induces artefactual phase shifts where underlying voltage gradients occur; however, these effects are modest. We show that the effects of cross-talk are unlikely to affect most conclusions inferred from neurophysiology experiments when both originating and receiving electrode record signals of similar magnitudes. We discuss other types of experiments and analyses that may be susceptible to cross-talk, techniques for detecting and experimentally reducing cross-talk, and implications for high-density probe design.
NEW & NOTEWORTHY We develop and experimentally verify an electrical circuit model describing cross-talk that necessarily occurs between two channels. Recorded cross-talk increased with electrode impedance and signal frequency. We recorded cross-talk contamination of spike waveforms from intracellular to extracellular channels. We simulated high-density multichannel extracellular recordings and demonstrate spatial smoothing and phase shifts that cross-talk enacts on CSD measurements. However, when channels record similar-magnitude signals, effects are modest and unlikely to affect most conclusions.
historically, neurophysiological experiments were performed on a single channel at a time, including extracellular (Mountcastle 1957) and intracellular (Hodgkin et al. 1952) experiments. Today neurophysiological experiments are often performed with simultaneous recordings from many channels (Buzsáki 2004). Beyond merely increasing the throughput of a given experiment, multiple-channel experiments afford unique inferences not available to single-channel studies (Buzsáki et al. 1996; Henze et al. 2000).
A unique methodological concern for multiple-electrode experiments is that of capacitive coupling (cross-talk) between channels. This coupling occurs along the lengths of electrode shanks located close to each other and is artificially introduced into the naturally occurring electrical circuits of the brain whenever simultaneous multiple-electrode recordings are performed. Modern multichannel neuronal recording methods have been becoming increasingly parallel with increasingly smaller interelectrode distances (Blanche et al. 2005; Khodagholy et al. 2015; Lopez et al. 2014; Rios et al. 2016). Whether or not cross-talk creates a problem for these designs would seem to need to be documented but has not yet been fully addressed.
Additionally, cross-talk will be more apparent for experiments involving large differences in amplitudes between signals (Nagaoka et al. 1992), with the larger-amplitude signal more easily contaminating the smaller-amplitude signal. This is the case for experiments in which stimulation and simultaneous recording as well as simultaneous intracellular and extracellular recordings are performed, both of which have seen increased interest in recent years (Anastassiou et al. 2011, 2015; Atallah and Scanziani 2009; Bazelot et al. 2010; Blot and Barbour 2014; Glickfeld et al. 2009; Gomes et al. 2016; Haider et al. 2016; Hasenstaub et al. 2005; Nelson et al. 2013; Okun et al. 2010; Poo and Isaacson 2009; Poulet and Petersen 2008; Trevelyan 2009).
Some neurophysiologists may be aware of the existence of cross-talk, but the nature of the cross-talk recording circuit is not widely known in the field, and the extent to which it might practically affect the experiments being conducted today has never been fully investigated. In reviewing the literature, we were only able to find the issue discussed in depth with respect to surface EMGs (Farina et al. 2004; Kilner et al. 2002; but see Nagaoka et al. 1992). Further, a mention of the potential concerns for cross-talk rarely appears in even the methodology sections of most multiple-channel papers (but see Blot and Barbour 2014 as a counterexample). Some recent papers concerning new multichannel recording probes have addressed the issue, however (Lopez et al. 2014; Rios et al. 2016). The issue is mentioned for example in the user guide The Axon Guide (3rd ed.) (Molecular Devices, Sunnyvale, CA), but not in the user guides of other equipment we have looked at. Moreover, when mentioned in the above references, the issue of cross-talk has not been discussed in depth.
We sought to more specifically explore the topic of cross-talk and present the details of import for neurophysiology experimenters and anyone interpreting multiple-channel electrophysiological data.
MATERIALS AND METHODS
All experiments involving animals were performed with protocol approval from the local animal welfare committee (Center for Interdisciplinary Research in Biology) and in accordance with EU guidelines (directive 86/609/EEC).
Recording Procedures
Brain slice recordings.
Extracellular or whole cell recordings of striatal output neurons (medium-sized spiny neurons, MSNs) were performed in horizontal brain slices (330 μm) from Oncins France Strain A (OFA) rats (Charles River, L’Arbresle, France) (postnatal days P17–P30), using procedures described previously (Fino et al. 2005). Using a temperature control system (Bathcontroller V, Luigs&Neumann, Ratingen, Germany) recordings were performed at 34°C. Slices were continuously superfused at 1.5–2 ml/min with an artificial cerebrospinal fluid. The composition was (in mM) 125 NaCl, 2.5 KCl, 25 glucose, 25 NaHCO3, 1.25 NaH2PO4, 2 CaCl2, 1 MgCl2, and 0.01 pyruvic acid bubbled with 95% O2-5% CO2. Pipettes used for extracellular recordings or stimulation were filled with the same extracellular solution. Pipettes used for whole cell recordings were filled with (in mM) 105 K-gluconate, 30 KCl, 10 HEPES, 10 phosphocreatine, 4 ATP-Mg, 0.3 GTP-Na, 0.3 EGTA (adjusted to pH 7.35 with KOH). Recordings were made with EPC 10–2 and EPC 10–3 amplifiers (HEKA Elektronik; Lambrecht, Germany) with a very-high-input impedance (~1 TΩ) to ensure there was no appreciable signal distortion imposed by the high-impedance electrodes (Nelson et al. 2008). For all ex vivo experiments, a circular reference electrode surrounding the slice was used to avoid biasing current travel in any direction.
During the experiments, individual neurons and the microscale local composition of the extracellular space were identified using infrared-differential interference contrast videomicroscopy with a CCD camera (Optronis VX45; Kehl, Germany). For experiments that involved ex vivo whole cell recordings, target cells were chosen to be located far from obvious extracellular obstructions (blood vessels, fiber bundles, etc.) that would not bias the amounts of obstructions in the slice in any direction (Nelson et al. 2013). Recorded neurons were identified as MSNs based on apparent cell morphology, current-voltage relationships, and specific firing patterns (Fino et al. 2005, 2009).
Recording pipettes of varying impedances across experiments (ranging from 1.1 to 17.2 MΩ) were inserted into the slice via a micromanipulator and either were used for whole cell recordings or remained suspended in the extracellular space within the brain slice 100 μm below the surface of the slice. With the recording pipette in place, a signal pipette (6–8 MΩ impedance) filled with extracellular solution was placed suspended in the air above the bath, with its tip ~50 μm away in a lateral direction from the recording pipette shaft. Sinusoidal stimuli were then driven through the signal pipette as described below. Pipettes approached the slice at similar angles from opposite ends of the bath, and the two pipettes were at an approximately orthogonal angle relative to each other. For the recording configurations depicted in Fig. 1, we varied the location of the recording pipette between recordings while maintaining the signal pipette in the same position.
Fig. 1.

Evidence of cross-talk between channels. The same 40-Hz sine wave signal is sent through the electrode on the left while it is suspended in the air and a second recording micropipette records signals at three different locations: in the bath (A); just above the surface of the bath, near the signal electrode (B); and above the bath and far away from the signal electrode (C). Data traces show raw single recordings. Note the y-axis scaling of the recorded signal at each location; the relative increase in amplitude in B is even larger than what is visually presented here. The same x-axis scaling is used for all plots. Below each panel depicts a schematic showing the equivalent electronic circuit that describes these results.
To calculate pipette impedance across frequencies, sinusoidal stimuli (see below for details) were applied with the pipette in the slice without other pipettes present. For the recordings shown in Fig. 5C, this was done while whole cell recordings were performed with that electrode as well. The HEKA patch-clamp system can operate to apply either a known, preset voltage to a given channel while measuring the current it applies to do so, or it can apply a known, preset current to the electrode while measuring the voltage required to do so. These two values are related to each other by Ohm’s law: V = I × Zelec. In both cases, both the current (I) and the voltage (V) are either known or measured, and the impedance between the pipette shaft and ground (Zelec) can be calculated as the ratio of V to I. We used a known voltage level to measure the impedance of the pipette alone in a slice and a known current level to measure the impedance of the pipette in series with a neuron during a whole cell recording (see below).
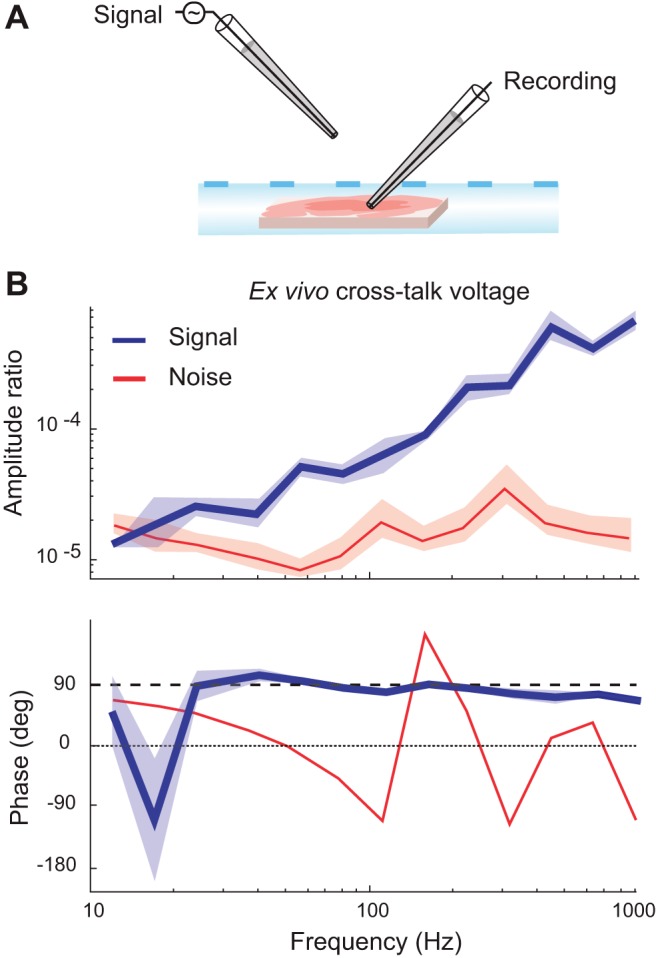
Fig. 5.

Cross-talk recorded in pipettes performing whole cell recordings. A: a sinusoidal voltage at various frequencies was injected through a pipette suspended in air with a tip 50 μm away laterally from the tip of a pipette that was performing a whole cell recording in a brain slice. The equivalent circuit diagram is overlaid on the illustration describing the recording. The equivalent circuit is identical to that shown in Fig. 2A, but with the addition of Zcell (corresponding to the total impedance of the intracellular space and cell membrane) in series with the electrode tip. These have the effect of adding to the effective impedance of Zelec2′. B: blue traces correspond to the signal frequency voltage recorded by the pipette performing the whole cell recording. Red traces correspond to estimates of the noise levels in the recording channel obtained from the same recordings, based on the recordings where no signal was present at that frequency for each frequency. Six different neurons were recorded with pipettes with impedances ranging from 5.7 to 6.7 MΩ. The shaded regions show the SEs of the mean across recordings. The top plot shows the amplitude of the voltage whereas the bottom plot shows the phase. The dashed line indicates a phase of 90°. C: the impedance of a whole cell recording configuration was measured across frequencies for 2 different whole cell recordings, following the same procedure as for electrodes alone (Fig. 4D). The top panel shows the impedance magnitude, and the bottom panel shows the impedance phase. Labels of 17.5 and 15.1 MΩ indicate the impedance magnitude of the cell and pipette at the highest frequency tested (926 Hz). D: cross-talk recorded from a nearby electrode suspended in the air in a separate set of recordings made with the same 2 whole cell recordings from C. The top panel shows the amplitude ratio (the whole cell recording channel amplitude divided by the amplitude of the signal channel suspended in air). The bottom panel shows the phase of the whole cell recording channel relative to the phase of the signal channel suspended in air. The dashed lines in the bottom panel indicate the predicted phase across frequencies, given the measurements shown in C.
In vivo recordings.
In vivo experiments were conducted in adult male Sprague-Dawley rats (Charles River, L’Arbresle, France) weighing 275–300 g. Rats were placed in a stereotaxic apparatus (Unimecanique, Asniere, France) after anesthesia induction with a 400 mg/kg ip injection of chloral hydrate (Sigma-Aldrich, Saint-Quentin Fallavier, France). Deep anesthesia maintenance was ensured by intraperitoneal infusion on demand of chloral hydrate delivered with a peristaltic pump set at 60 mg·kg−1·h−1 turned on 1 h after induction. Proper depth of anesthesia was assessed regularly by testing the cardiac rhythm, EcoG activity, the lack of response of mild hindpaw pinch, and the lack of vibrissae movement. The electrocardiogram was monitored throughout the experiment and body temperature was maintained at 36.5°C by a homeothermic blanket.
Two craniotomies were performed, one for the insertion of a reference electrode in the somatosensory cerebral cortex (layer 2/3) and one to allow the recording of activity from within the cortex. For the recording electrode, a 2 × 2 mm craniotomy was made to expose the left posteromedial barrel subfield at the following coordinates: posterior 3.0–3.5 mm from the bregma, lateral 4.0–4.5 mm from the midline. To increase recording stability the cistern was drained.
Recording pipettes of varying impedances across experiments (ranging from 1.7 to 9.2 MΩ) filled with extracellular solution were inserted into the brain and lowered 1.5 mm below the cortical surface. With the recording pipette in place, a signal pipette (6–8 MΩ impedance) filled with extracellular solution was placed suspended in the air above the brain, with a tip ~50 μm away in a lateral direction from the recording pipette shaft. Sinusoidal stimuli were then driven through the signal pipette as described below.
Stimuli Sinusoids
Sine wave stimuli of 13 different frequencies were applied using a HEKA patch-clamp system (EPC10–2 and EPC10–3). The frequencies tested varied approximately evenly on a logarithmic scale ranging from 6 to 926 Hz. Specific frequencies tested were: 6, 12, 24, 40, 57, 80, 113, 160, 225, 320, 450, 640, and 926 Hz. For some experimental configurations, not all frequencies were gathered. Recordings were sampled at 16.7 kHz. One hundred to 300 traces, 100–1,500 ms in length, were averaged before the data were recorded to disk for off-line analyses. Longer stimulus lengths and more traces were recorded for low-frequency stimuli for which the cross-talk signal-to-noise ratio was lower. The order of the presentation of the frequencies was randomized for each recording.
For most configurations, stimuli were introduced with the signal electrode in voltage-clamp mode to ensure constant voltage amplitude, regardless of the impedance from the signal electrode to ground. This was particularly important when the signal electrode was suspended in the air. The signal amplitudes for most configurations were 300 mV for frequencies from 6 to 113 Hz, and 50 mV for frequencies from 160 to 926 Hz. For select experiments indicated, amplitudes of 100 μV across all frequencies were used to mimic typical extracellular LFP recording amplitudes. For the impedance measurements of the pipette in series with a neuron while the pipette performed a whole cell recording, we used a constant current stimulus of 300 pA at every frequency to ensure that the current levels would not damage the recorded neuron. Intracellular and extracellular voltages were recorded unfiltered. Before conducting experiments, we verified that any amplitude changes or phase shifts introduced by the equipment into the recordings across frequencies were negligible via control recordings with an external signal generator in the bath without a slice.
Spontaneous Local Field Potential Recordings
Extracellular recordings of spontaneous local field potentials (LFPs) were performed for both ex vivo slice preparations and in vivo whole brain preparations. A recording pipette was placed in each neural preparation at the same depths described above for the sinusoidal recordings for each preparation, located ~50 μm away laterally from the tip of a second electrode which passively recorded potentials in two conditions: suspended in the air above the neural preparation, or inserted in the neural preparation at the same depth. For the ex vivo preparation (Fig. 8A), the glutamate uptake blocker dihydrokainic acid (DHK, 300 μM) (Tocris Bioscience) was bath-applied to increase the spontaneous LFP activity by promoting neuronal depolarization and spontaneous firing resulting from the accumulation of extracellular glutamate. Five minutes of spontaneous activity was recorded in both conditions.
Fig. 8.

Recorded natural LFP fluctuations do not create appreciable cross-talk voltages in our preparation. A: power spectral density across frequencies recorded from a 1.4 MΩ pipette placed in a brain slice near a second electrode that was either suspended in the air, or recording spontaneous LFPs from the same slice. B: power spectral density across frequencies from a 0.8 MΩ pipette recording extracellularly in an in vivo preparation with a second electrode alternately placed in the air or recording spontaneous LFPs from the same in vivo preparation.
Action Potential Recordings
To record the cross-talk effect of natural action potential waveforms, a recording electrode was suspended submerged in an artificial cerebrospinal fluid (aCSF) bath above the surface of a brain slice, 10 μm away laterally from the shaft of a pipette performing a whole cell recording. Action potentials were evoked by repeated intracellular depolarizing current injection steps (500-ms duration at 1 Hz) while the voltage was recorded continuously on both channels. Occasional longer breaks of approximately 1 min were taken between groups of sweeps. Depolarizing current amplitudes were set to the level needed to elicit approximately three spikes per sweep, which varied from 200 to 400 pA across experiments. We recorded 363–450 sweeps per neuron, recording 995–1,335 spikes per neuron. This experiment was performed for three MSNs using a range of impedances for the extracellular pipettes: 1.6, 5.8, and 12.0 MΩ. MSNs are best suited for this experiment because in response to depolarizing current pulses they display action potentials that are homogeneous in shape and amplitude across sweeps, as well as medium-range discharge frequency without spike-frequency adaptation. These recordings were sampled at 50 kHz. We analyzed the intracellular and extracellular waveforms triggered on the peak of the recorded intracellular potential.
Following these recordings, we sent a series of constant-current sine wave stimuli via the pipette performing a whole cell recording of a neuron with the extracellular pipette maintained at the exact same position, following the same procedures as our other experiments. The sine wave recordings along with the known effective impedance of the extracellular pipette allowed us to estimate Zcross for each action potential recording using Eq. 2 (see Equivalent Circuit). We then entered Zcross, the effective impedance of the extracellular pipette, and the recorded intracellular waveform into Eq. 2 to predict the expected waveform recorded from the extracellular pipette resulting from cross-talk.
For the recording with an extracellular pipette impedance of 5.8 MΩ, we performed action potential sweeps with the extracellular pipette at two different locations. We performed the first groups of sweeps with the extracellular pipette in the bath just above the slice surface, and then, while maintaining the whole cell recording on the same neuron, we raised the extracellular pipette 100 μm vertically in the bath while maintaining a 10-μm horizontal distance from the shaft of the pipette performing the whole cell recording. We then performed another group of action potential sweeps, followed by the sine wave recordings. The action potentials recorded at the two distances from the neuron were compared to determine if the difference in distance from the neuron affected the recorded potential.
Equipment Sources of Cross-Talk
We tested to rule-out equipment sources of cross-talk downstream of the amplifier-electrode circuits we present here. This was done one channel at a time by attaching a BNC shorting cap to each channel and recording from that channel while the stimulation channel delivered sinusoidal currents in the same manner as in the rest of our experiments. The resulting signal was flat on the shorted channel for all frequencies and configurations.
Analyses
Offline analyses were conducted in Matlab (Natick, MA). The amplitude and phase of each digitized recording at the known stimulus frequency were determined using techniques previously described (Nelson et al. 2013). Briefly, we first averaged the waveform across all the cycle lengths of the known input frequency. The amplitude was then taken as times the root mean square of the resulting waveform. The phase was then determined as the four-quadrant inverse tangent of a 2-dimensional projection of the resulting waveform. The x-coordinate of the projection was the correlation (in the signal-processing sense) of the resulting waveform with a cosine waveform, and the y-coordinate was the correlation with a cosine waveform shifted forward by 90°.
Noise levels were estimated for each experiment at each frequency by averaging across all the recordings in the experiment in which the given frequency was not the frequency of the stimulus sinusoid. For averaging across experiments, the phase and amplitude of each measurement were first combined and averages were then performed in the complex plane, although we observed that for these data, results were the same when calculating the average amplitude and circular average phase individually.
For the analysis of spontaneous LFPs, spectra were calculated using the function pwelch from Matlab’s signal-processing toolbox, dividing the data into eight equal-length segments with 50% overlap. Segments were windowed with a Hamming window. The resulting spectra were smoothed on a log-log scale with each point showing the average spectrum over a width of 0.25 in base 10 log of frequency space, at a sampling distance of 0.25 in base 10 log of frequency. Results near 50 Hz were omitted.
Model Simulations
Full Stimulation Model and Full Recording Model.
We performed simulations in Matlab modeling the recording circuits shown in Fig. 2, B and C, which we label as the “Full Stimulation Model” and “Full Recording Model,” respectively. We used the node voltage method to derive and then solve a system of equations describing each circuit, as described below. For both models, we took an initial step to simplify the circuit by assuming that Za has a sufficiently large amplitude to consider it as an open-circuit element, which is an idealization of recording conditions in terms of current flow through the electrodes. In the following description we omit the notation for (ω) for brevity, but it should be known that every variable can potentially vary with frequency.
Fig. 2.

Equivalent circuit model for simultaneous intracellular and extracellular recordings. A: circuit diagram for the Isolated Cross-Talk Model. A hypothetical simultaneous stimulation and recording with two glass micropipette electrodes is illustrated. The signal pipette on the left is suspended in air and driven at a certain stimulation frequency while the nearby pipette on the right records extracellularly from neural tissue. The equivalent recording circuit model in black is overlaid on the illustration of the experiment. The signal pipette is driven with the AC voltage Velec1. The recording pipette is connected to an amplifier with input impedance Za recording the signal Velec2. This diagram and circuit could describe the behavior of either a slice recording or an in vivo recording with a grounded reference in contact with the neural tissue. Grounding in the bath as for a slice preparation is indicated. The arrow labeled Icross indicates the path of current flow that gives rise to the cross-talk contamination added to Velec2. B: circuit diagram for the Full Stimulation Model, depicting simultaneous extracellular recording and stimulation in the configuration in which it would be applied in a neuroscience experiment. The signal pipette is driven with the AC voltage Velec1 and immerged extracellularly in the same neural preparation as the recording pipette which records the voltage Velec2. C: circuit diagram for the Full Recording Model, depicting dual extracellular recordings in the configuration in which it would be applied in a neuroscience experiment. An AC voltage source of voltage VS within the neural preparation generates a voltage at the two electrode tips, Vtip1 and Vtip2. The two electrodes record Velec1 and Velec2 with cross-talk between the electrode shafts. D: circuit diagram for the Silicon Array Model, depicting the simultaneous recording of multiple extracellular channels linearly arranged. The voltage at each electrode tip is fixed to a given source voltage Vtip i. Each electrode records the voltage Velec i, with cross-talk between adjacent electrode shafts. E: abstract schematic of a voltage divider circuit. This simple circuit leads to the relations shown in Eq. 1.
For the Full Stimulation Model, balancing the current at the corresponding key nodes in Fig. 2B leads to the following system of equations:
This description presents a system of three equations with three unknown variables (Vtip1,Vtip2,Velec2) and is thus solvable to derive an expression for each variable in terms of the voltage applied to stimulation electrode (Velec1).
Similarly for the Full Recording Model, balancing the current at the corresponding key nodes in Fig. 2C leads to this system of equations:
This description presents a system of four equations with four unknown variables (Vtip1,Vtip2,Velec1,Velec2) and is thus solvable to derive an expression for each variable in terms of the source voltage originating from within the neural preparation (VS).
Each system of equations was solved in Matlab after assigning values to each impedance term. The amplitude of Zcross was made to vary from 105 to 1012 Ω, always with a phase angle of −90°, for each combination of other parameters being tested. The base values for other terms was as follows: Zelec1 and Zelec2, 5 MΩ; Zextra1, Zextra2, and Zextra3, 50 kΩ; ZextraS1, 40kΩ; and ZextraS2, 400 kΩ. The base electrode impedance is in the range of typical glass micropipettes, which we used for the experimental portion of this study. The base magnitude of the extracellular space impedance that we chose is in line with the high end of approximations of its value, and we vary this magnitude within a range about this base value to determine its effect on predictions of the model (see below). We assigned all extracellular impedances to purely resistive base values in line with some experiments (Logothetis et al. 2007; Miceli et al. 2017; Ranta et al. 2017), although the intention of the present study is not to address the properties of the extracellular space but rather to focus on the phenomenon of cross-talk. Importantly, however, we observed that the phase of extracellular impedance for both full models had no effect on any of the results that we show here, provided that that phase was consistently applied to each extracellular impedance element. We show in our diagrams the extracellular impedance components as resistive and capacitive to include the possibility that these can include capacitive elements.
For the Full Recording Model simulation, we chose a value of ZextraS1 9 times smaller than the value of ZextraS2 to simulate a neural voltage source that was much closer to electrode 1 than electrode 2. If these values are approximately equal such that the source has nearly the same effect on the tip voltage of both electrodes, the cross-talk current becomes small with an unstable phase. We found that the overall combined impedance magnitudes of ZextraS1 and ZextraS2 were less important to the behavior of the simulated recordings than their ratio with respect to each other. The exception is the caveat that if those impedances were small relative to the other extracellular impedances, both tip voltages would approach the same value as the source voltage, and again there would be no stable cross-talk current. This led to our choice of these values for the present simulation to demonstrate the cross-talk predicted by the model.
The relevant source voltages (Velec1 for the Full Stimulation Model and VS for the Full Recording Model) were set to 1 for each model, allowing the values of other voltages to be interpreted as the phase and amplitude relative to the source voltages. Each simulation was run across the range of Zcross values. All other input parameters (which were all impedances) were held to their base value while one other parameter of interest was varied in either phase or magnitude. When varied in magnitude, the varying parameter of interest was set to 0.1, 1, and 10 times its base value using a base phase of 0° in 3 separate simulations. When varied in phase, the parameter of interest was set to a phase of 0°, −30°, and −60° using its base magnitude in 3 separate simulations. These phase values reflect a resistive impedance (0°) and increasingly capacitive combinations of resistive and capacitive impedance (−30° and −60°). The variables of interest varied in this way in subsequent simulations were Zelec1, Zelec2, Zextra3 (uniquely varied while other extracellular impedances remained the same), and Zextra*, which corresponds to adjustments that are simultaneously applied to all extracellular impedance elements. This same pattern of parameter variation was applied to the Full Stimulation Model and Full Recording Model independently.
We determined the cross-talk addition to the recorded voltage on electrode 2 by subtracting from Velec2 a reference value of what that voltage would be with an open circuit replacing the Zcross element in the circuit, with all other parameters kept the same. We labeled this difference as the cross-talk contribution to the recorded voltage in Figs. 9 and 10. For each model, we compared this to the predictions from the simpler “Isolated Cross-Talk Model.” For the Full Stimulation Model, this involved multiplication of the applied Velec1 by the ratio shown in Eq. 2 (see Equivalent Circuit). For the Full Recording Model, this involved first deriving the isolated value of Velec1 from the value of Vtip1 in the simulation after accounting for voltage drops occurring over the electrode impedance, Zelec1. Since the Isolated Cross-Talk Model corresponds to the cross-talk expected if there is no current path between electrodes within the neural preparation, the ratio of the cross-talk component in the full model to the cross-talk voltage predicted by the Isolated Cross-Talk Model directly reflects the effect of the current path between electrodes within the neural preparation.
Fig. 9.

Full Stimulation Model simulations. Panels show the voltages theoretically predicted by the Full Stimulation Model circuit shown in Fig. 2B. A: variations of the magnitudes of key parameters. For each column of plots, the magnitude of the parameter listed was varied across 3 different orders of magnitude relative to its base value as indicated in the legend, while other parameters were set to their base values. For every combination of parameters the magnitude of Zcross varied continuously across its range of interest. The top row of plots shows the amplitude of the cross-talk recorded at Velec2 (see materials and methods for further description) relative to the amplitude of the artificially applied Velec1. The dashed lines show the value predicted by the Isolated Cross-Talk Model and Eq. 2 wherever that value differs from the Full Stimulation Model. The middle row shows the phase of the cross-talk recorded at Velec2 relative to the applied Velec1. B: variations of the phases of key parameters. For each column of plots, the phase of the parameter listed was varied across 3 values as indicated in the legend, while its magnitude and the phase and magnitude of all other parameters were set to their base values. Plots are in the same format as in A. Zextra* corresponds to adjustments in phase and amplitude that are simultaneously applied to all extracellular impedance elements. Only Zelec2 had an appreciable effect on the cross-talk recorded from a nearby stimulating electrode. The predictions of the Full Stimulation Model are not appreciably different from the predictions of the simpler Isolated Cross-Talk Model for the range of parameters tested here.
Fig. 10.

Full Recording Model simulations. Panels show the voltages theoretically predicted by the Full Recording Model circuit shown in Fig. 2C. A: variations of the magnitudes of key parameters. For each column of plots, the magnitude of the parameter listed was varied across 3 different orders of magnitude relative to its base value, in the same manner as Fig. 9. The top row of plots shows the amplitude of the cross-talk recorded at Velec2 relative to the amplitude of the neural source voltage, VS. The dashed lines show the value predicted by the Isolated Cross-Talk Model and Eq. 2 wherever that value differs from the Full Recording Model. The middle row shows the phase of the cross-talk recorded at Velec2 relative to VS. Here the bottom row of plots shows the ratio of the cross-talk amplitudes of the Full Recording Model to the Isolated Cross-Talk Model at every point. B: variations of the phases of key parameters. For each column of plots, the phase of the parameter listed was varied across 3 values as indicated in the legend, in the same manner as Fig. 9. Plots are in the same format as in A. Zelec2 had the most direct effect on cross-talk amplitude and phase. For all combinations of parameters, less cross-talk is predicted by the Full Recording Model than the Isolated Cross-Talk Model. The ratio moves closer to unity as the magnitude of Vextra3 increased, reflecting that electrical isolation between electrode tips within the neural preparation increases cross-talk.
Silicon Array Model.
To demonstrate the effect of cross-talk on current source density (CSD) and voltage measurements performed with modern multichannel probes, we simulated extracellular recordings with cross-talk on a hypothetical probe with 16 channels linearly arranged along one spatial dimension, each separated by a common distance (Fig. 2D). Here we label this the “Silicon Array Model” because many such designs use silicon bases with small metal wires performing recordings and carrying such signals, although we wish to be clear that this model applies to any multiple-channel recording array linearly arranged. For this model we assigned a particular voltage profile to the tips of each electrode recording site (shown in Figs. 11A and 12A), with the voltages at each electrode tip fixed to that level. The effects we observed were mostly unaffected by the relative degree of the voltage step in this profile. We model the system of voltages recorded by each electrode according to the circuit shown in Fig. 2D for 16 electrodes. A recent study (Rios et al. 2016) reported estimated parameter values for a dense multichannel recording design. This allows us to make our work here directly applicable to the equipment in use for modern parallel multichannel recordings, and we appreciate the care of these authors for including these parameter details in their article. We use these as the base values for these parameters in our simulation of a linear array of multiple extracellular recordings currently in use in neuroscience experiments. In their model, the authors report estimating the cross-talk capacitance between channels as 1.35 pF, which we use to derive Zcross between adjacent electrode pairs. The authors report the shunting capacitance to ground as 2.5 pF and the amplifier input capacitance as 12 pF. Here we sum these parallel capacitances to derive what we refer to as the amplifier shunt capacitance, used in turn to derive Za. The authors report the impedances of their probe’s recording sites across frequency for both unplated and gold-plated recording sites, which at 1 kHz were 3.8 and 0.5 MΩ in magnitude, respectively, with phases near −80°. We use both plated and unplated values for the value of Zelec as indicated in results. The authors’ estimation of electrode impedance are derived from empirical measurements whereas the other estimations appear to be derived from theory. For further details about that specific probe’s design, readers are referred to the original article (Rios et al. 2016).
Fig. 11.

Simulated 1-dimensional voltage profile recording on a 16-channel metal probe array performing extracellular recordings using the Silicon Array Model circuit shown in Fig. 2D. A: the voltage profile at top left was simulated to exist at the recording site tips of an array of 16 electrodes arranged linearly, as might occur in a modern multichannel probe design. Each column of plots shows the simulated recorded voltage amplitudes, phases, and CSD normalized with respect to the maximal value of the ground-truth CSD for different combinations of parameter values. Simulations are performed with and without the inclusion of the capacitive cross-talk term in the model as indicated in the legend. The simulation was performed at 1 kHz, and the values shown can be interpreted as the spectral component of an oscillation at that frequency. Left: parameters for Za and Zelec are taken from the values reported in Rios et al. (2016). Here we used the unplated electrode impedance values reported in Rios et al. (2016). Middle: the same parameters as the left column are used, while the value for Ccross is increased by a factor of 10 to exacerbate the effects of cross-talk for descriptive purposes. Right: the same parameters as the middle column are used, with the phase of each electrode impedance made 35° less capacitive. B: the instantaneous CSD profile determined from the simulated recordings in time and space of 1-kHz sine waves, using the same voltage profile and parameter values of the right column plots in A.
Fig. 12.

Amplifier input impedance and shunt capacitance effects using the Silicon Array Model circuit shown in Fig. 2D. A: recordings of the same 1-dimensional voltage profile from Fig. 11 using a 16-channel metal probe array were simulated with two different values of the amplifier shunt capacitance (which determines the value of Za): the base value and the base value times 0.1. The base parameters are taken from Rios et al. (2016) as in Fig. 11A, left column. Here we use the plated electrode impedance values reported in Rios et al. (2016) for most electrodes while using the unplated electrode impedance value for the electrode in position 8, resulting in a nearly 8 times larger impedance at that electrode only. The results are shown following the same conventions as Fig. 11A. B: voltage drops and phase shifts across the electrode tips. The same simulation shown in Fig. 11A, left column, was performed over a range of frequencies, and using the same impedance value for every electrode. The recorded voltage amplitude and phase relative to the voltage at the electrode tip is shown for one middle electrode (electrode 8). C: interaction of cross-talk effects and amplifier shunt capacitance. Two pairs of simulations were performed using the same parameters as in Fig. 11B at 1 kHz or with the amplifier shunt capacitance divided by 10. At the electrode immediately preceding the elevated voltage (electrode 5), for each value of the amplifier shunt capacitance we calculated the cross-talk amplitude ratio as the amplitude with cross-talk included minus the amplitude without cross-talk included from the model divided by the voltage difference at the tips of electrodes 5 and 6. Similarly, we calculated the phase shift induced by cross-talk at electrode 5, defined as the phases recorded there with the inclusion of cross-talk relative to the phase recorded there without the inclusion of cross-talk for each amplifier shunt capacitance value. The amplitude ratio results are shown on the left plot, and the phase shift is shown on the right plot.
Using the node voltage method, the model with n electrodes (Fig. 2D) results in a system of n equations and n unknowns (each Velec i) using the following current balance at each electrode’s shaft:
with current balances for the first and last electrodes in the array adjusted to be:
As before, we solved each system of equations in Matlab after assigning values to each impedance term. We performed all simulations at 1 kHz, except when mentioned otherwise, although the same qualitative effects we report here are found at any frequency. Each voltage value within the model can therefore be interpreted as a spectral component with a magnitude and a phase at the frequency being tested. From the results, we plot the simulated recorded amplitude and phase for each electrode in addition to the simulated current source density (CSD) calculated using the traditional method (Mitzdorf 1985; Wójcik 2014) applied to the simulated recorded voltages. Specifically, we calculated CSD as:
Constant terms for conductivity and the distance between electrodes were excluded because the CSDs were later normalized (see below). We calculated two different types of CSD estimates using this method, both of which gave nearly identical results. For the first type of CSD, we calculated the CSD directly from the spectral power derived from the spectral components of the simulations. For the second type of CSD, we generated a time series of sinusoids at the frequency being tested with the amplitude and phase of the sine wave at each electrode given by the simulated spectral component recorded by that electrode. We then performed the CSD calculation on the instantaneous voltage at every time point (sampled at 50 times the underlying sine wave frequency), with results shown in Fig. 11B. The spatial CSD profile was then taken at the time point of the peak voltage of electrode 6 in the array (see Figs. 11 and 12). The value from the second method is shown in Figs. 11A and 12A. In all cases, the plotted CSDs were normalized by dividing by the peak value of the ground truth CSD using the values input to the electrode tips in the simulation.
We include a finite amplifier input impedance uniquely for the Silicon Array Model as a parameter in the simulations. For the two electrode models (i.e., the Full Stimulation Model and the Full Recording Model) which we consider primarily against simultaneous intracellular and extracellular data, there is no indication that single-channel shunt capacitance bypassing the amplifier input impedance is a problem. With modern highly multiple channel recording probes, such unavoidable parasitic capacitances may govern the limitations of this equipment (Najafi et al. 1990; Rios et al. 2016); thus we include this parameter in the Silicon Array Model simulations to determine what degree this parameter might be affecting high-density recordings in current designs.
Additional capacitive connections between nonneighboring electrode pairs in a multichannel array may exist, but we do not believe that accounting for them will considerably influence the results that we present. Note that in our model, a given electrode i still has a capacitive influence on electrode i + 2 which comes via the intermediate capacitance from electrode i to i + 1 and i + 1 to i + 2.
At the present level of analysis for the Silicon Array Model, we opted to set the electrode tip voltages to fixed values and thus did not include lateral current paths within the brain between electrodes. This was done to allow the simulation of a steep change in voltage between neighboring electrodes (see the voltage profile in Figs. 11A and 12A) to better show the potential effects of cross-talk in a multiple electrode array. We expect that the effects of the inclusion of this current path in a more complete model would be similar to its effects in the Full Stimulation Model and Full Recording Model that we examined in two electrode models.
RESULTS
As a descriptive demonstration of the phenomenon of cross-talk, we observed that when one electrode in a bath is placed near another electrode suspended in the air that is made to carry a sine wave voltage, a lower-amplitude sine wave at the same frequency becomes present in the electrode in the bath (Fig. 1A) with a 90-degree phase shift from the original sine wave. Since the electrode from which the signal originates is suspended in the air, we can be certain that the voltage present in the second electrode in this situation results only from capacitive cross-talk between the electrodes. Importantly, this cross-talk would still be present in the case of simultaneous recordings with two or more electrodes placed in a neural preparation and might need to be considered when interpreting such data. Interestingly, after removing the second pipette from the bath, rather than breaking the circuit the recorded cross-talk signal increases considerably (Fig. 1B) and is in-phase with the original signal. When the electrode moved far enough away, the recorded cross-talk can be made to disappear entirely beneath the noise floor of the channel (Fig. 1C). A recording circuit diagram describing each situation is shown below each panel. We explain what happens in each of these cases below, first focusing on a quantitative description of an Isolated Cross-Talk Model that describes the situation in Fig. 1A.
Equivalent Circuit
We present simplified recording circuits (Fig. 2) to describe the simultaneous recording of multiple channels. Additional complications could always be added to the circuit to improve precision, but this circuit suffices to describe the phenomena we explore here, which are the practical implications of cross-talk in neuroscience.
We first consider an Isolated Cross-Talk Model (Fig. 2A) in which the signal electrode (which is driven at a particular frequency) is suspended above a neural preparation, while a second electrode in proximity of the signal electrode records from the neural preparation, which could be either an ex vivo slice or in vivo whole brain preparation. This equivalent circuit also describes the recording in Fig. 1A, with the neural preparation replaced with conductive saline that the recording electrode is immersed in. We focus much of our attention here on this circuit because it isolates the effect of cross-talk: any current above noise level going through the recording electrode at the signal frequency must result from cross-talk between the channels. This makes the phenomenon easier to understand and verify with experimental data, in a situation in which we can be certain that experimentally recorded data were the result of cross-talk.
To describe the implications of the circuit, we recall the behavior of a voltage divider shown in Fig. 2E, which yields the resulting relationship:
| (1) |
where (ω) indicates that the given variable is a function of frequency. Thus the ratio of VB to a signal that is present at VA connected in series along a path to ground is equal to the ratio of the impedance of the portion of the path following VB (i.e., ZB) to the impedance of the entire path (ZA + ZB). This relation follows from the application of Ohm’s law and a conservation of current.
We apply this concept to the circuit shown in Fig. 2A to derive an expression for the cross-talk voltage recorded. We denote the voltage present in the signal-originating electrode to be Velec1. A second electrode records a cross-talk voltage from the first electrode, which we denote as Velec2. The cross-talk voltage ratio can be reduced to the approximation in Eq. 2:
| (2) |
where ‖ represents impedances adding in parallel, and the effective electrode impedance is written as Zelec2′ = Zelec2 + Zextra, which incorporates the impedance in the neural preparation downstream of the electrode. The (ω) is omitted for intermediate variables for brevity above, but it should be known that every variable could potentially vary with frequency. The approximation in the rightmost side of Eq. 2 holds if |Za| >> |Zelec2′|, which is typically the case for the high-input impedance amplifiers used in brain slice recordings. In our setup, Za is reported to be ~1 TΩ (HEKA Elektronik, Lambrecht, Germany) which is several orders of magnitude higher than our measured values of Zelec2′ (up to 15.4 MΩ). These values of Zelec2′ encompass and exceed the values of electrode impedances used in either intracellular or extracellular recording experiments.
This circuit and equation indicate that the current contributing to cross-talk voltages crosses a capacitance between the electrode shafts and then, rather than only traveling to ground through the amplifier input impedance, much of the current travels through the second electrode tip into the neural preparation along a route to ground, as indicated in Fig. 2A. Velec2 is thus in between the impedances Zcross and Zelec2′ in a complete path to ground, and the resulting cross-talk voltage is described by a voltage divider between those two impedances. This capacitive current traveling through the neural preparation is of course artificially introduced by the addition of these multiple electrodes and would not otherwise be present. Cross-talk voltage magnitude will thus increase with the magnitude of Zelec2′ and decrease with the magnitude of Zcross. Note that the behavior of this circuit stands in contrast with the circuit for single-channel electrode recording described in Robinson (1968) and Nelson et al. (2008), where the recorded voltage is effectively electrically independent of electrode impedance when high-input impedance initial amplifiers are used.
The phase of the recorded cross-talk is also described by the above equation. The denominator, Zcross + Zelec2′ is the result of a sum of complex values; its phase will be equal to a magnitude weighted average of the phases of Zcross and Zelec2′. The phase of the righthand side of the equation will be the phase of Zelec2′ minus the phase of this sum, and this result determines the phase of the cross-talk in Velec2 relative to Velec1. The resulting phase will thus depend on the magnitude and phase of Zelec2′ relative to Zcross. Zcross will always have a phase angle of −90°. Glass micropipettes have a phase of 0° across all frequencies (see Fig. 4D for a demonstration of this) whereas metal microelectrodes have a phase angle that can vary between 0° and −90° for the frequencies of interest to neuroscientists (Nelson et al. 2008). In most neuroscience applications, as we later show, the overall magnitude of Zcross will be much higher than the magnitude of Zelec2′, and the overall levels of cross-talk relative to the originating signal will be low. In these cases if it holds true that |Zcross| >> |Zelec2′|, then it is possible to roughly simplify Eq. 2 to:
| (3) |
to describe the relatively small cross-talk voltage that is recorded. In this case this additional assumption allows for an easy to remember and more intuitive approximately correct description of the resulting cross-talk: the cross-talk voltage magnitude will scale approximately linearly with the effective electrode impedance magnitude, and the phase of the cross-talk voltage relative to the original voltage will be approximately the phase angle of Zelec2′ plus 90°. This phase will a maximal +90° when the phase of Zelec2′ is 0° and will be smaller for more capacitive Zelec2′ values. When the magnitude of Zelec2′ is large enough relative to Zcross and the rough approximation of Eq. 3 is invalid (in which case Eq. 2 must be used), the phase of the denominator moves toward the phase of Zelec2′, resulting in cross-talk phases that decrease as the magnitude of Zelec2′ grows and eventually approach 0 if the magnitude of Zelec2′ grows large enough.
Fig. 4.

Cross-talk recordings in extracellular electrodes in vivo across a range of impedances. A: a sinusoidal voltage at various frequencies was injected through a pipette suspended in air with a tip 50 μm away laterally from the tip of a pipette recording extracellularly from an in vivo preparation. B: amplitude (top) and phase (bottom) of the extracellular electrode. Extracellular electrodes with impedances of 1.7, 4.8, and 9.2 MΩ across frequencies were used in separate recordings, with the darker traces corresponding to higher impedances. Blue traces show the voltage at the frequency used to drive the signal in the suspended electrode. Red traces correspond to estimates of the noise levels obtained from the same recordings, using the recordings when no signal was present for each frequency. Dashed blue lines show the amplitude values predicted by the model given each electrode’s known impedance value. The expected voltage phase of 90° is shown with a horizontal dashed line in the bottom panel. C: estimations of the amplitude (top) and phase (bottom) of Zcross for each electrode using these same data. The average value for Zcross across all three electrodes was used to derive the predicted voltage ratios shown with dashed lines in the left panel. The dashed black line in the top plot shows the regression line approximating the average Zcross amplitude, and the horizontal dashed line in the bottom plots marks the phase of −90°, which is expected for the impedance across a simple capacitance. D: pipette impedance amplitude (left) and phase (right) measured from single pipettes in a brain slice. The impedance is generally resistive and constant across frequencies, with some stray capacitance causing a negative phase shift and depressed impedance amplitudes observed at high frequencies for high-impedance pipettes.
In the configuration tested in Fig. 1A with a glass micropipette, Velec2 should therefore be phase shifted +90° relative to Velec1, indicating that the cross-talk component of Velec2 would lead Velec1 by that amount. This is precisely what is found (Fig. 1A). Equations 2 and 3 explain the results observed in Fig. 1, B and C, as well. When the electrode is removed from the bath in Fig. 1B, this would have the effect of replacing Zelec2′ with the capacitive current route between the electrode and the nearby conducting saline bath, which we denote with Zstray. This stray capacitive impedance is larger than the impedance Zelec2′ when the electrode tip was in the bath, and the cross-talk voltage thus increases in amplitude. At this higher impedance, the previous assumption |Za| >> |Zelec2′| may no longer hold sufficiently true and current paths through Za may play a more meaningful role. However at high enough amplifier input impedances, shunt capacitance around the amplifier input impedance likely limits the effective value of Za (Robinson 1968), and renders the element Za as effectively capacitive. Thus the overall impedance downstream of Zcross in the scenario shown in Fig. 1B is capacitive (and specifically would be a parallel sum of Zstray and Za). The phase of this component (which replaces Zelec2′ in Eq. 2) thus also becomes −90°, equal to that of Zcross. The cross-talk observed in Velec2 is predicted by Eq. 2 to be in-phase with Velec1, which is precisely what is observed in Fig. 1B. In Fig. 1C, the distance between the electrodes eventually becomes large enough so that the magnitude of Zcross is sufficiently large to render the righthand side of Eqs. 2 and 3 sufficiently close to 0° so that the sine wave is no longer visible in Velec2. The Zcross circuit element in this case is effectively replaced with an open circuit.
We model the precise configurations used in neuroscience experiments with a Full Stimulation Model and Full Recording Model shown in Fig. 2, C and D, respectively. The Full Stimulation Model shows a voltage applied to the signal electrode while it is placed in the neural preparation. The Full Recording Model shows the same situation but with the voltage source originating from within the neural preparation, and additional necessary current paths within the neural preparation shown. We choose here to consider a voltage source of neural origin, but similar behavior for the effects we investigate here can be shown for a neural current source of neural origin.
We verified the Isolated Cross-Talk Model with experimental data, as the presence of recorded voltages in the second electrode in this configuration are certain to result from cross-talk and the configuration offers a simple way to verify predictions of the equivalent circuit model. We later show with simulations of the full stimulation and recording models similarities and differences of the simpler Isolated Cross-Talk Model and those situations.
Demonstrating and Testing the Isolated Cross-Talk Model Equivalent Circuit
Figure 3 demonstrates the existence of cross-talk recorded in an extracellular electrode when a voltage signal is sent through a nearby channel suspended in the air. At the signal levels tested here, the cross-talk rises above the noise, with higher magnitudes at higher frequencies and a phase that leads the originating signal voltage by ~90° across frequencies. We showed that this same effect is present in in vivo extracellular recordings across a range of electrode impedances (Fig. 4, A–C). Specifically, the recorded cross-talk amplitude increased as the extracellular electrode impedance increased (Fig. 4B). Application of the model (Eq. 2) with the known effective impedance of the pipette permitted calculation of the cross-talk impedance, Zcross (Fig. 4C). The values were nearly identical across electrodes, with some slight systematic differences across electrodes likely resulting from differential effects of stray capacitance unaccounted for in the simplified model. Zcross decreases linearly with frequency on a log-log scale with an approximate slope of −1 and a phase of nearly −90°, as anticipated for the impedance of a simple capacitance. Using the average value for Zcross and the known impedance of each extracellular electrode, we used the rightmost expression of Eq. 2 to predict the expected voltage ratio. These yielded close results to the observed data (solid vs. dashed lines in Fig. 4B), indicating that the quantitative predictions of the model are held in these data. Across frequencies and electrodes for this configuration we estimated the capacitance underlying Zcross to be 87 pF.
Fig. 3.
Recorded cross-talk across frequencies by an extracellular electrode. A: a sinusoidal voltage at various frequencies was injected through a pipette suspended in air with a tip 50 μm away laterally from the tip of a pipette placed in a brain slice. B: blue traces show the voltage recorded across frequencies by the pipette in the slice. Red traces correspond to estimates of the noise levels obtained from the same recordings, using the recordings when no signal was present for each frequency. Five recordings were made with extracellular pipette impedances ranging from 2.3 to 7 MΩ. The shaded regions show the SEs of the mean across recordings. The top plot shows the amplitude ratio of the voltage, specifically the recording channel amplitude divided by the signal channel amplitude. The bottom plot shows the phase of the recording channel relative to the phase of the signal channel. The dashed line indicates a phase of 90°.
The calculations described above to determine the predicted values in Fig. 4B assume that the pipette impedance is resistive and constant across frequencies, using the value estimated from Patchmaster software (HEKA Elektronik) by the application of a square biphasic pulse of 5-ms duration per phase. We verified the assumption by performing single electrode tests measuring pipette impedances across frequencies for a range of pipette impedances (Fig. 4D). The impedance of these pipettes is generally resistive (with phases near zero) and constant across frequencies. Effects of stray capacitances can be observed causing a negative phase shift and depressed impedance moduli at high frequencies for high impedance pipettes. These effects are seen over these ranges because both higher frequencies and higher pipette resistances result in the parallel stray capacitive routes becoming increasingly less impeding relative to the direct route through the tip of the pipette. Note that this observation that the impedance of glass micropipettes surrounding a metallic filament is well described as a constant resistance across frequencies stands in stark contrast to the impedance of electrodes in which the metal-electrolyte interface dominates the impedance of the electrode, in particular metal microelectrodes. The metal-electrolyte interface has been modeled with varied equivalent circuits and the interface itself is known to be nonlinear in the sense that the individual elements of equivalent circuits are known to be dependent on at least frequency and current density (Geddes et al. 1971; Geddes 1997; Grimnes and Martinsen 2000; Wei and Grill 2009), although it can be accounted for as a resistance and capacitance in parallel for simplicity with the value of each individual parameter varying with frequency (Nelson et al. 2008; Robinson 1968). Considering that glass pipettes involve recording with a metallic inner filament, the resulting linearity of the overall impedance can be explained by the fact that there is a low overall resistance in the very large metal-to-saline contact over the wire inside the pipettes, despite the nonlinearity of this contact. The impedance of the pipette is then dominated by the impedance at the pipette tip, which becomes large because of the microscopically small conductive opening there. This impedance through saline along a narrow passage still involves the transfer of ions through saline, which is resistive across frequencies (Grimnes and Martinsen 2000), thus resulting in the overall resistive and frequency independent nature of the glass pipettes used in slice electrophysiology.
Cross-Talk Recorded on an Intracellular Channel
Cross-talk originating from a nearby channel can also affect intracellular recordings, drawing current into the recorded neuron and later the bath via the electrode performing the recordings in the same manner demonstrated above for extracellular recordings. The effect of this on the recording circuit would be to simply add an additional impedance for the cell and cell membrane in series with the electrode tip performing the intracellular recording (Fig. 5A), which would be quantifiably indistinguishable from accordingly adjusting the value of Zelec2′, in terms of both phase and amplitude, in the equivalent circuit. We sought to test this by performing a whole cell recording of a neuron with one electrode while sending a voltage signal through a nearby channel suspended in the air.
Figure 5B shows that signals were transmitted above noise levels across frequencies to the recording electrode. The recorded voltages had a positive phase shift as in Fig. 3, but that phase shift was less than 90°, resulting from the negative phase of the mixed capacitive and resistive impedance of the recorded neuron. We explored this further in a separate set of experiments by first directly measuring the total impedance of a pipette and cell in series while performing a whole cell recording in a slice (Fig. 5C), and then performing subsequent cross-talk recordings from the same pipette and cell in series, sending signals through a nearby electrode suspended in air (Fig. 5D). The measured impedances of the pipette and cell (Fig. 5C) rose over lower frequencies, with moderate negative phases of about −30° across frequencies, and local phase minima at ~40 Hz. These measured impedances shown in Fig. 5C can replace the value of Zelec2′ in the model to provide a prediction of the phase shifts that should be observed in the separate set of cross-talk recordings shown in Fig. 5D. The phase shifts predicted by the model approximation (Eq. 3) are 90° plus the phase of Zelec2′, which matches reasonably well with the observed values, including the shape of the cross-talk phase across frequencies (Fig. 5D). This agreement across distinct experiments provides further confidence in the model description and demonstrates the phase shifts imposed in the circuit when current travels across a cell membrane.
Practical Implications of Cross-Talk in Neuroscience
Simultaneous intracellular and extracellular recordings.
One can observe in Fig. 3 that the overall ratio of recorded cross-talk voltage to the voltage in the originating signal is very low, peaking at 0.001 in our setup for the highest of the frequencies we tested (~1 kHz), with even lower ratios for low frequencies. What are the practical implications of this level of cross-talk for neuroscience recordings?
We first examined this question for simultaneous intracellular and extracellular recordings. Here the amplitudes of the signals differ by several orders of magnitude, which suggests that the lower amplitude extracellular channel would be susceptible to recording cross-talk contamination from the higher amplitude intracellular channel. Moreover, the observation that cross-talk voltage ratios are higher at high frequencies indicates that the recording of action potential waveforms would be particularly susceptible to this effect. To test the extent of these effects, we recorded action potentials intracellularly from a neuron in whole cell mode while simultaneously recording the potentials measured from a second pipette submerged in the bath but not in the slice, with its tip located 10 μm away from the shaft of the pipette performing the intracellular recording (Fig. 6A).
Fig. 6.

Intracellular spike waveforms lead to cross-talk on nearby extracellular channels. A: action potentials were evoked from a neuron by intracellular depolarizing current steps with a second recording pipette submerged in the bath just above the slice surface, at a 10 μm lateral distance from the shaft of the pipette performing the intracellular recording. B, top: the average intracellular spike waveform for the recording with an extracellular pipette impedance of 5.8 MΩ. B, middle: the average extracellular spike waveforms for recordings with 3 different impedance extracellular pipettes. The extracellular waveform amplitudes increased systematically with electrode impedance. B, bottom: the predicted extracellular cross-talk waveforms for each recording based on the application of the model from Eq. 2 to the average intracellular waveform using parameters derived from the application of Eq. 2 to recordings of sine wave voltages injected into the neuron at the same electrode locations. This prediction takes into account the precise cross-talk capacitance and intracellular waveform height of each recording, in addition to the measured electrode impedance. C: the observed and predicted waveforms for each recording, as indicated. D: very similar recorded waveforms were observed at different positions relative to the neuron, but at the same distance (10 μm) relative to the shaft of the pipette recording the intracellular waveform. This was performed for the recording using the extracellular pipette with an impedance of 5.8 MΩ.
Figure 6B shows the average intracellular and extracellular waveforms recorded, as well as the waveforms resulting purely from cross-talk that are predicted by the Isolated Cross-Talk Model based on the parameters derived from sine-wave recordings performed immediately after the action potential recordings. Qualitatively, an increase in the recorded extracellular waveform with extracellular electrode impedance is predicted to result from the model (Fig. 6B, bottom), which is precisely what is observed in these data (Fig. 6B, middle). Note that an increase in extracellular waveform height with electrode impedance is not expected to occur from a single electrode recording a waveform that would naturally be present in the bath at that location without the addition of cross-talk (Nelson and Pouget 2010). The recorded cross-talk waveform is a distorted version of the intracellular waveform, and is distinct in shape from extracellular spike waveforms recorded in absence of cross-talk, which are typically negative going at their largest amplitude point. The waveform peaks before the intracellular waveform, resulting from the positive phase shift across frequencies described above. The waveform recorded from the highest impedance extracellular electrode had a peak amplitude of 15.2 μV. In addition, the recorded waveforms quantitatively match well with the waveforms predicted by the model (Fig. 6C), with the exception that the actual voltage is observed after a slight delay beyond what is predicted by the model, likely resulting from some inaccuracy not accounted for by our simplified model.
To increase the certainty that the recorded waveforms resulted from cross-talk alone we ideally would record the cross-talk spike waveforms from an electrode suspended in air. We found however that the recording of these waveforms in the air was unreliable. As well, recording from an electrode submerged in aCSF, as we did, affords an improved direct comparison to the experiments performed by neuroscientists. To test the contribution from the action potential waveform present in the bath without cross-talk to our recordings in the aCSF bath, for one neuron we recorded action potentials with the extracellular pipette in two locations. We performed the first action potential recordings with the extracellular pipette in the bath just above the slice surface, and then while maintaining the whole cell recording from the same neuron we raised the extracellular pipette 100 μm vertically in the bath while maintaining the same 10 μm horizontal distance from the shaft of the pipette performing the whole cell recording. The distance between electrodes was thus kept the same across recordings, but the distance from the spiking neuron increased considerably. If the recorded extracellular waveform resulted from a significant contribution from the extracellular potentials of the spiking neuron, the waveform would be noticeably lower in the second recording. However, this was not the case (Fig. 6D), corroborating our interpretation that these potentials recorded were dominated by the cross-talk contribution from the intracellular recording.
Simultaneous multiple extracellular recordings.
To test the implications of cross-talk for simultaneous multiple extracellular recordings, we re-performed the same experiment as shown in Fig. 3 for one experiment with lower originating signal peak-to-peak amplitudes of 200 μV, mimicking what would be a large voltage observed during an extracellular recording. Figure 7 shows that the cross-talk signal voltages do not exceed the noise level in the same recordings, for both the ex vivo (Fig. 7A) and in vivo preparations (Fig. 7B). Importantly, these results indicate that even at close distances (here ~50 μm of lateral separation at the pipette tips), there is no appreciable effect of cross-talk between extracellular recording channels for the amplitudes typically encountered for these recordings.
Fig. 7.

Cross-talk of signals at amplitudes mimicking extracellular recordings does not exceed noise levels in our preparation. A: an example ex vivo recording session using stimuli with peak-to-peak amplitudes of 200 μV sent through an electrode suspended in air 50 μm away laterally from the tip of a pipette with an impedance of 1.1 MΩ recording in a brain slice. B: three example in vivo recording sessions using stimuli of amplitude 200 μV for the same pipettes and preparation shown in Fig. 4 (1.7, 4.8, and 9.2 MΩ).
We tested the cross-talk transfer of spontaneous LFPs recorded from ex vivo (Fig. 8A) and in vivo (Fig. 8B) reparations. We reasoned that if the recordings in an electrode were influenced by the naturally recorded LFPs on a second nearby electrode, there should be an increase in the signal power recorded when the second electrode is recording LFPs vs. being suspended in the air. For both preparations, recordings showed no considerable differences in power spectral density when a nearby electrode was suspended in the air or simultaneously recording spontaneous LFPs from the same preparation (Fig. 8). The condition where LFPs were recorded in a nearby electrode actually showed slightly less power across frequencies (Fig. 8). We conclude that the effect of cross-talk between extracellular recording channels for naturalistic stimuli was too weak to appreciably affect results in these conditions.
Effects of Stimulation and Recording Parameters in Full Model Simulations
We ran simulations of the equivalent circuits shown in Fig. 2C (the Full Stimulation Model) and 2D (the Full Recording Model) using reasonable approximations of each impedance element, and varied the magnitude and phase of key elements, one parameter at a time. For the Full Stimulation Model (Fig. 9), cross-talk voltages very closely match the results predicted by the application of the simpler Isolated Cross-Talk Model in all instances. The magnitude and phase of Zelec2 affects the magnitude and phase of the recorded cross-talk to essentially the same degree predicted by Eq. 2, while other parameters show essentially no effect on cross-talk within the ranges tested. At the left end of the plot, we observe that the effects of Zelec2 disappear when the magnitude of Zcross becomes small relative to the magnitude of Zelec2 and the two electrodes, in this hypothetical situation, share the same voltage via cross-talk current. When the magnitude of Zcross is high relative to the magnitude of Zelec2, the phase of the cross-talk voltage is +90°, whereas the phase tends toward 0° when the magnitude of Zcross is low relative to Zelec2, although this region is not of practical concern for neuroscience experiments. This pattern entirely matches the expectations described by Eq. 2.
For the Full Recording Model (Fig. 10), Zelec2 has the same clear and direct impact on cross-talk voltage as predicted with the Isolated Cross-Talk Model and confirmed in our experimental data. However the cross-talk amplitudes of the full model are always less than the amplitudes expected by the Isolated Cross-Talk Model, with a ratio of ~0.4 for the base parameter values in our simulation that remained constant across values of Zcross magnitude. The parameter with the most noticeable effect on this ratio is Zextra3, which is the impedance in the neural preparation between electrode tips. Increasing the magnitude of Zextra3 increases the full model cross-talk voltage while not appreciably affecting the Isolated Cross-Talk Model approximation, thus increasing this ratio. If one considers Zextra3 to have an infinite magnitude (i.e., being replaced with an open circuit) this corresponds to the same situation as the Isolated Cross-Talk Model circuit in which the voltages between the electrodes only interact via the capacitive cross-talk between the channels. The extent that current from a neural source can flow within the neural preparation between electrodes thus leads to similar voltages in the neural preparation at the electrode tips, which leads to similar voltages in the electrode shafts and reduced cross-talk. A deviation in the phase of Zextra3 without changes in its magnitude also affects the phase of the recorded cross-talk, and results in modest increases in cross-talk amplitude. The phase and amplitude of Zelec1 only affect cross-talk amplitude when the magnitude of Zelec1 is at least within an order of magnitude of Zcross. This effect would occur because the high amount of cross-talk current flowing from electrode 1 to electrode 2 when Zcross is low results in increased current across Zelec1 and a concomitant increased voltage drop across Zelec1 that is dependent on its magnitude. This would cooccur with decreased signal voltages recorded by Zelec1, similar to the effects of a finite amplifier input impedance. Both the magnitude and phase of Zextra*, which were adjustments uniformly applied to all extracellular impedance elements, had no appreciable effect on any of the effects observed here within the ranges of values we tested, giving confidence that our results are not dependent on these precise values of the simulation. We do note that if we increase these values beyond the range we have tested here such that they are larger than the impedances of the electrodes, some effects of these parameters are observed. In these cases, increases of Zextra* result in increases in the ratio of cross-talk between the full and the isolated cross-talk models.
Silicon Array Model Simulation
Modern multichannel probes are now in use with designs with very small interelectrode spacing (<1 μm) that raise the question for neurophysiologists and biomedical engineers: at what point, even when the same types of signals are recorded on every channel, does cross-talk have a noticeable impact on recordings and what are those effects? To address this, we performed a series of simulations of a high-density multielectrode array performing extracellular recordings using parameter values reported from a recent study (Rios et al. 2016).
We first simulated the recordings of unplated metal recording sites, which have higher impedances and therefore as we have shown makes them more susceptible to cross-talk. We contrasted simulated recordings with the reported cross-talk capacitance (Ccross) values to the simulations with a negligible (10−35 F) Ccross value, labeled as with and without cross-talk, respectively (Fig. 11A, left). To accentuate the amount of cross-talk for demonstrative purposes, we multiplied Ccross by 10 (Fig. 11A, middle). To explore the effect of electrode impedance phase, we further added 35° to the phase of Zelec (Fig. 11A, right), which results in an impedance phase similar to what has been observed in traditional tungsten microelectrodes (Nelson et al. 2008). When cross-talk does affect multiple-channel recordings, the effect is a spatial smoothing of recorded voltages with small phase shifts observed at the boundaries when voltage changes between neighboring electrodes. Using the literature-reported values (Rios et al. 2016) for unplated electrodes the cross-talk effects are barely visible (voltage at electrodes 5 and 6 are 2.2% higher and 1.1% lower, respectively, than they would be without cross-talk effects), although distortion at such a level is unlikely to render all but the most precise of scientific inferences invalid. This smoothing and phase shift is observed in the CSD profile as well (Fig. 11, A and B). One of the reasons the cross-talk-induced phase effects in the reported values model are so minimal is that the reported phase of the electrode impedances (approximately −80°) are very near to the phase of a pure capacitance. As we have shown here, cross-talk induced phase shifts result from a difference in the phase of the electrode tip impedance and the phase of the pure capacitance between the channels. Adding the 35° to the impedance phase increased the cross-talk-induced phase shifts at voltage boundaries, and also increased the overall recorded phase shifts and modestly increased the recorded amplitudes resulting from the electrode-amplifier circuit effects (see below). Even at this more positive electrode impedance phase at an increased Ccross level, the cross-talk-induced phase shifts are maximally only just over 3°.
One can observe in Fig. 11 that even in the simulations without cross-talk, phase shifts and amplitude attenuations occur on every channel, resulting from the electrode-amplifier circuit (Geddes et al. 1967; Nelson et al. 2008). Even with a high-input impedance amplifier, parasitic shunting capacitances are inevitable and seemingly would have an increased impact for designs with many electrodes amplified in tight spaces. This phase shift and amplitude reduction will be dependent on electrode impedance. To demonstrate this, we performed a simulation in which all electrodes had the lower reported plated impedance value (which is 13.2% of the unplated impedance value), while the electrode at position 8 had the unplated impedance value (Fig. 12A). Lower impedance plated channels had less amplitude reductions and phase shifts than was observed overall for the unplated channels in Fig. 11. Figure 12A highlights one of the potential problems of the amplifier shunt capacitance levels in current use: a change in electrode impedance at one position results in a change in the recorded voltage there and induces an artifact in the calculated CSD that in this case rivals the size of the CSD spike resulting from a doubling of voltage between adjacent channels. Using the same electrode array with the amplifier input capacitance reduced by a factor of 10, the effects of the different impedance electrode are notably less severe. These effects will depend on frequency (Fig. 12B), though the change with frequency is relatively modest as the slope of the log impedance vs. the log of frequency for these electrodes is approximately −0.89, nearing that of the effectively capacitive amplifier input impedance (which is near −1). We further compared the interaction between cross-talk and amplifier input impedances (Fig. 12C) and found that the lower amplifier shunt capacitance increases the result of cross-talk effects, although those effects are still low overall.
DISCUSSION
We have presented a simplified electrical circuit model of cross-talk between channels during a neurophysiology experiment and developed simple equations that capture the bulk of the circuit’s behavior. We demonstrated experimentally both in ex vivo brain slice preparations and in vivo whole brain preparations that this model accurately describes cross-talk amplitudes and phases, and we have shown that this model accurately predicts cross-talk waveforms in novel situations. As predicted by the model, cross-talk recorded on a given channel increases with the electrode impedance and signal frequency and leads the originating signal voltage in phase. We showed with artificial and natural stimuli that recordings of similar amplitude levels are not expected to be appreciably affected. These results were confirmed in more detailed models that included the circuit loop between electrodes within neural tissue. These models further showed that this circuit loop is expected to decrease cross-talk effects in parallel recordings but have little effect in stimulation. Models of high-density, multiple-channel extracellular probes showed the anticipated extent of cross-talk effects in those recordings and described the nature with which cross-talk affects CSD estimates when it exists. Although cross-talk may be an issue affecting the precision of measurements and is good to counteract when possible, even in the dense conditions explored today with modern probes, cross-talk is unlikely to influence most conclusions of experiments when parallel recordings are performed of signals with a similar amplitude. Amplifier input impedance compromised by capacitance in dense recordings may however affect these recordings.
Experiments That May Be Affected by Cross-Talk
We find from both experiments and simulations that multiple extracellular recordings are likely not considerably affected by cross-talk, nor are as far as we can tell EEG recordings. The results demonstrate that there is no strong concern over cross-talk for existing and new multiple extracellular recording experiments, even with modern multiple-electrode recording designs (e.g., Blanche et al. 2005; Lopez et al. 2014; Maynard et al. 1997; Rios et al. 2016) which employ increasingly smaller separations between recording channels. Here we experimentally tested a distance of 50 μm between two glass pipettes and found no noticeable cross-talk for signals at approximate amplitudes of typical LFPs. Fifty micrometers, however, is the minimum distance between channels in most of our experiments, and the pipettes in these experiments were oriented approximately orthogonally to each other; thus their shafts did not run near each other. More so than just the minimum distance, the integrated interchannel distance along the entire electrical path up to the initial headstage amplifiers is the critical factor in cross-talk capacitance. Therefore the experimental data here likely underestimates the cross-talk observed in multiple electrode arrays. To complement this we simulated the recording in a silicon array using model parameter values reported in a recent study (Rios et al. 2016). As expected, cross-talk amplitude ratios were simulated to be higher than our experiments with glass micropipettes; even so, the ultimate effect in the reported “worst case scenario” of unplated recording sites was a slight loss of spatial resolution in the recorded voltage profile with very modest phase shifts occurring when spatial voltage gradients occur.
Cross-talk may warrant special consideration for simultaneous intracellular and extracellular experiments, however. Intracellular voltages vary on the order of tens of millivolts, with peak-to-peak action potential amplitudes exceeding 100 mV. Extracellular potentials of interest can be as small as on the order of tens of microvolts. In consideration of spike shapes in particular, we note that the distorted, positive-peaked spike shapes resulting from cross-talk will be one noticeable sign of potential cross-talk. Extracellular recording of negative-peaked action potentials (which is the extracellular waveform most encountered in single-channel experiments where no cross-talk is possible) is an indication that the waveform is not wholly a result of cross-talk. However, even in this case cross-talk could still have contributed to the precise overall recorded action potential shape, and this should be kept in mind when interpreting such experiments.
The questions we raise are not meant to imply that all articles employing this methodology are certain to have cross-talk concerns, or that such concerns if they exist necessarily invalidate conclusions of the paper. Taking one recent example in the literature, Haider et al. (2016) used a regularized linear regression technique to explore coupling between simultaneously recorded intracellular and extracellular data. The distances between their electrodes (from 0.2 to 1.1 mm, on average 0.5 mm) may be sufficiently large to avoid concern. In addition, much of their results are driven by lower frequencies where cross-talk is less of a concern, especially for the pipettes they use to perform the extracellular recordings.
Other experiment types where cross-talk should be considered include stimulation when simultaneous recording is applied (Anastassiou et al. 2011; Nelson et al. 2013), which may be susceptible for the same reason that the stimulating electrodes and extracellular recording electrodes may have vastly differing voltage magnitudes. Experimenters and readers should cautiously keep these implications of cross-talk in mind when considering experiments that involve averaging over a large number of instances of an event to reveal a small signal interpreted as a result (Bakkum et al. 2013; Teleńczuk et al. 2015). Cross-talk voltage ratios are small, but its effect is consistent and could be revealed by such techniques.
Lower frequencies are less susceptible to cross-talk. This dependence will be stronger when the channel potentially recording cross-talk is a micropipette as opposed to a metal microelectrode. The dominant element giving rise to the impedance of glass micropipettes is an essentially pure resistance at the narrow pipette tip. This is constant in amplitude and has a phase of 0° across frequencies (Fig. 4D). Equations 2 and 3 show that cross-talk at lower frequencies will thus be attenuated because Zcross increases with lower frequency, and cross-talk is determined by the ratio of the recording electrode impedance to Zcross. In contrast, the impedance of metal microelectrodes rises at lower frequencies, but not as steeply as Zcross. Zcross is a purely capacitive impedance that increases with lower frequencies, with a slope of −1 on a log-log scale. The slope of common metal-microelectrode impedance against frequency is less steep, and is roughly −0.6 with some differences at different frequencies (Nelson et al. 2008). Thus there is expected to be some increase in cross-talk for higher frequencies for metal microelectrode recordings, but less frequency dependence than glass pipette recordings.
Limitations of Non-Electrode Instrumentation
The results in Figs. 11 and 12 show that with the amplifier shunt capacitance reported in Rios et al. (2016), recordings are performed at a level where they are sensitive to the underlying electrode impedance resulting from the amplifier-electrode circuit, with effects that have been previously described (Nelson et al. 2008). The use of high-input impedance amplifier circuits can counteract this, but there are some limitations outside of the purview of the amplifier. Shunting the amplifier itself can result from parasitic capacitance between the electrode and ground downstream of the electrode tip, which can be unavoidable particularly in small spaces when many electrodes are recorded. Although to some degree these effects may be unavoidable, still this leads to undesirable effects, including lower recorded voltages and phase shifts, and a sensitivity of the recordings on electrode impedance. This means that if electrode impedances change due to one electrode being damaged, for example, or due to natural variation of the electrode impedance in time or across electrodes, the recorded voltage will be affected. If this situation cannot be avoided, then the stability of electrode impedances throughout experiments and across channels becomes a necessary consideration for electrode designers and anyone interpreting high-density extracellular recordings to consider.
Specifically, the collection of multiple wires in between the electrode and headstage, which typically travel distances of up to a few centimeters bundled in close proximity to each other, is often the limiting factor for cross-talk considerations and parasitic amplifier shunting capacitance in most multielectrode recording designs. The values the authors in Rios et al. (2016) report for cross-talk and shunting capacitances appear to have been derived theoretically, and it is not clear whether these values include the wires between the electrode and headstage which for their design (as well as for many other designs) travel a distance of a few centimeters. If this had not been included in their original capacitance estimates, then the estimates and their effects that we describe here would certainly increase. We did not investigate the narrow placement of such wires here, but users should be aware of this and minimize the length of such cables whenever possible. Some designs have included “active probes” with the first stage of amplification fabricated inside the recording probe itself (Lopez et al. 2014). This is suggested to have other benefits in addition to reducing the unwanted capacitance values that we describe here.
Signs of the Occurrence of Cross-Talk
A positive phase shift between a recorded voltage and potential cross-talk source is a potential indication of cross-talk. This phase will be 90° if the signal is recorded with a glass pipette, but between 0 and 90° with more variation across frequencies if the signal is recorded with typical metal microelectrodes because of the phase of metal microelectrode impedances (Nelson et al. 2008).
Another sign is an effect that increases with electrode impedance across experiments. Note this increase of voltage with electrode impedance in the cross-talk recording circuit is different from the single-channel behavior of recording a signal from the neural preparation in series with the electrode tip (Nelson et al. 2008). Although both this circuit and the cross-talk circuit we describe here operate essentially as voltage dividers, the pipette impedance is on opposite sides of the electrode shaft along the current path in these two circuits. Therefore the pipette impedance has different effects on the voltage in the electrode shaft, which is the voltage that is ultimately recorded during the experiments. The cross-talk current in the electrode shaft flows in the reverse direction from what is typically considered in an electrode recording; after going across Zcross the current flows across the electrode tip and back into the neural preparation along a path to ground there. Zelec2′ thus takes the place of Za′ from the single-electrode circuit (Nelson et al. 2008) and Zcross takes the place of Ze′.
Applying the known relationship between capacitance and the distance d between electrodes to the model shows that cross-talk voltage falls off approximately as 1/d. This is the same relationship predicted for the recording of voltage from a point source in a homogeneous model of extracellular space (Logothetis et al. 2007). Therefore the quantitative relationship of a voltage to the distance from its source alone is not a useful sign of cross-talk.
How To Minimize and Manage Cross-Talk
To reduce cross-talk, the distance of a recording electrode to potential cross-talk sources should be maximized, especially if the potential cross-talk source has a much larger amplitude than either the signal of interest or the noise floor of the recording channel. A shortened current path between each electrode’s tip and the initial headstage of the recording equipment also lessens the opportunity for a channel to receive cross-talk. To maximize the integrated electrode shaft distance when two or more recordings are performed with electrode tips at nearby points in neural tissue, the electrode shafts should be oriented as far away from each other along their lengths as possible.
As we showed, minimizing electrode impedance is another way to decrease the amplitude of cross-talk. Doing so, however, will decrease the thermal noise floor of the electrode (Johnson 1928; Nyquist 1928) by about the same amount, which will not make the cross-talk less visible relative to this noise. However, both the thermal noise and cross-talk will be decreased in amplitude relative to the target signal, so minimizing electrode impedance is desired for dealing with potential cross-talk concerns, inasmuch as it does not interfere with other aims of the study. For example, lowering the impedance by increasing the recording contact size is expected to lower the amplitude of recorded single units (Moffitt and McIntyre 2005). A similar trade-off that this creates with respect to thermal noise has been previously described (Lempka et al. 2006). Also, as our Silicon Array Model shows, minimizing electrode impedance helps combat effects from limitations of the amplifier input impedance due to shunting capacitance (Fig. 12).
Using a driven shield between channels when possible would likely help mitigate cross-talk (Matsuzaka et al. 2012), which for the case of glass micropipettes could be employed with a conductive material like tinfoil covering the pipettes and connected to the associated electronics needed to drive the shield at the voltage recorded by the electrode. A grounded shield covering the pipettes would also alleviate cross-talk concerns, but doing so could compromise the input impedance of the amplifier due to shunt capacitance and lead to other undesirable side effects.
If cross-talk has been recorded between two channels, in some cases the contamination can be removed afterwards using a “blind signal separation” algorithm which is described in Kilner et al. (2002).
Implications of Cross-Talk Circuit for Metal Microelectrodes vs. Glass Pipettes
Here we have performed experiments with glass electrodes and have modeled the expected effects for both glass pipettes and metal microelectrodes. The underlying model applies in precisely the same way between the different kinds of electrodes; the main difference between these electrode types is the nature of the impedance between the tissue and the electrode, which we have referred to here as the tip impedance. For glass micropipettes, we have shown that this interface is resistive and constant across frequency. In contrast, the electrode-tissue interface for metal microelectrodes has nonlinear properties (Geddes 1997; Wei and Grill 2009), is frequency dependent, and is some combination of resistive and capacitive. We have presented here the effects of these electrode impedance properties on recorded cross-talk in data and models. Given these differences, the nature of the circuit makes it so cross-talk will occur with smaller phase shifts on metal microelectrodes relative to glass micropipettes of the same impedance, and this phase shift will decrease the more capacitive in phase the metal electrode tip impedance is. Because the frequency dependence of metal microelectrodes as opposed to glass micropipettes more closely mimics the frequency dependence of the cross-talk impedance, as described quantitatively by our models, cross-talk effects of glass micropipettes are expected to be more frequency dependent than metal microelectrodes. The nonlinearity of metal microelectrodes suggests that their impedance, and thus the behavior of this recording circuit, are potentially more susceptible to the amplitude of recorded and stimulated voltages, whereas glass micropipettes would not be. Although here we do not describe the extent to which this makes an appreciable difference in recorded voltages for the signal amplitudes encountered in neuroscience experiments, for stimulation in a clinical setting this nonlinearity has been shown to have an effect (Wei and Grill 2009).
Relationship to 60/50 Hz Line Noise
Our model and finding that cross-talk increases nearly linearly with electrode impedance suggests that the amount of 60/50 Hz line noise recorded will increase with electrode impedance because the path of the electrical current giving rise to this noise is the same as the cross-talk current path described here. This is supported by data presented in at least two studies (Baranauskas et al. 2011; Keefer et al. 2008). The present study offers a theoretical explanation underlying these observations in the literature.
GRANTS
This work was supported by grants from INSERM, Collège de France and CNRS. S. Valtcheva is a Research Fellow of the MRT and the LabEx MemoLife.
DISCLOSURES
No conflicts of interest, financial or otherwise, are declared by the authors.
AUTHOR CONTRIBUTIONS
M.J.N., S.V., and L.V. conceived and designed research; M.J.N. analyzed data; M.J.N., S.V., and L.V. interpreted results of experiments; M.J.N. prepared figures; M.J.N. drafted manuscript; M.J.N., S.V., and L.V. edited and revised manuscript; S.V. and L.V. performed experiments.
ACKNOWLEDGMENTS
We thank Ueli Rutishauser for helpful conversations and comments on the manuscript. We thank Sylvie Perez for technical assistance with the in vivo experiments and France Maloumian for design work on the figures.
REFERENCES
- Anastassiou CA, Perin R, Buzsáki G, Markram H, Koch C. Cell type- and activity-dependent extracellular correlates of intracellular spiking. J Neurophysiol 114: 608–623, 2015. doi: 10.1152/jn.00628.2014. [DOI] [PMC free article] [PubMed] [Google Scholar]
- Anastassiou CA, Perin R, Markram H, Koch C. Ephaptic coupling of cortical neurons. Nat Neurosci 14: 217–223, 2011. doi: 10.1038/nn.2727. [DOI] [PubMed] [Google Scholar]
- Atallah BV, Scanziani M. Instantaneous modulation of gamma oscillation frequency by balancing excitation with inhibition. Neuron 62: 566–577, 2009. doi: 10.1016/j.neuron.2009.04.027. [DOI] [PMC free article] [PubMed] [Google Scholar]
- Bakkum DJ, Frey U, Radivojevic M, Russell TL, Müller J, Fiscella M, Takahashi H, Hierlemann A. Tracking axonal action potential propagation on a high-density microelectrode array across hundreds of sites. Nat Commun 4: 2181, 2013. doi: 10.1038/ncomms3181. [DOI] [PMC free article] [PubMed] [Google Scholar]
- Baranauskas G, Maggiolini E, Castagnola E, Ansaldo A, Mazzoni A, Angotzi GN, Vato A, Ricci D, Panzeri S, Fadiga L. Carbon nanotube composite coating of neural microelectrodes preferentially improves the multiunit signal-to-noise ratio. J Neural Eng 8: 066013, 2011. doi: 10.1088/1741-2560/8/6/066013. [DOI] [PubMed] [Google Scholar]
- Bazelot M, Dinocourt C, Cohen I, Miles R. Unitary inhibitory field potentials in the CA3 region of rat hippocampus. J Physiol 588: 2077–2090, 2010. doi: 10.1113/jphysiol.2009.185918. [DOI] [PMC free article] [PubMed] [Google Scholar]
- Blanche TJ, Spacek MA, Hetke JF, Swindale NV. Polytrodes: high-density silicon electrode arrays for large-scale multiunit recording. J Neurophysiol 93: 2987–3000, 2005. doi: 10.1152/jn.01023.2004. [DOI] [PubMed] [Google Scholar]
- Blot A, Barbour B. Ultra-rapid axon-axon ephaptic inhibition of cerebellar Purkinje cells by the pinceau. Nat Neurosci 17: 289–295, 2014. doi: 10.1038/nn.3624. [DOI] [PubMed] [Google Scholar]
- Buzsáki G. Large-scale recording of neuronal ensembles. Nat Neurosci 7: 446–451, 2004. doi: 10.1038/nn1233. [DOI] [PubMed] [Google Scholar]
- Buzsáki G, Penttonen M, Nádasdy Z, Bragin A. Pattern and inhibition-dependent invasion of pyramidal cell dendrites by fast spikes in the hippocampus in vivo. Proc Natl Acad Sci USA 93: 9921–9925, 1996. doi: 10.1073/pnas.93.18.9921. [DOI] [PMC free article] [PubMed] [Google Scholar]
- Farina D, Merletti R, Indino B, Graven-Nielsen T. Surface EMG crosstalk evaluated from experimental recordings and simulated signals. Reflections on crosstalk interpretation, quantification and reduction. Methods Inf Med 43: 30–35, 2004. [PubMed] [Google Scholar]
- Fino E, Deniau J-M, Venance L. Brief subthreshold events can act as Hebbian signals for long-term plasticity. PLoS One 4: e6557, 2009. doi: 10.1371/journal.pone.0006557. [DOI] [PMC free article] [PubMed] [Google Scholar]
- Fino E, Glowinski J, Venance L. Bidirectional activity-dependent plasticity at corticostriatal synapses. J Neurosci 25: 11279–11287, 2005. doi: 10.1523/JNEUROSCI.4476-05.2005. [DOI] [PMC free article] [PubMed] [Google Scholar]
- Geddes LA. Historical evolution of circuit models for the electrode-electrolyte interface. Ann Biomed Eng 25: 1–14, 1997. doi: 10.1007/BF02738534. [DOI] [PubMed] [Google Scholar]
- Geddes LA, Baker LE, McGoodwin M. The relationship between electrode area and amplifier input impedance in recording muscle action potentials. Med Biol Eng 5: 561–569, 1967. doi: 10.1007/BF02474249. [DOI] [Google Scholar]
- Geddes LA, Da Costa CP, Wise G. The impedance of stainless-steel electrodes. Med Biol Eng 9: 511–521, 1971. doi: 10.1007/BF02474708. [DOI] [PubMed] [Google Scholar]
- Glickfeld LL, Roberts JD, Somogyi P, Scanziani M. Interneurons hyperpolarize pyramidal cells along their entire somatodendritic axis. Nat Neurosci 12: 21–23, 2009. doi: 10.1038/nn.2230. [DOI] [PMC free article] [PubMed] [Google Scholar]
- Gomes J-M, Bédard C, Valtcheva S, Nelson M, Khokhlova V, Pouget P, Venance L, Bal T, Destexhe A. Intracellular impedance measurements reveal non-ohmic properties of the extracellular medium around neurons. Biophys J 110: 234–246, 2016. doi: 10.1016/j.bpj.2015.11.019. [DOI] [PMC free article] [PubMed] [Google Scholar]
- Grimnes S, Martinsen ØG. Bioimpedance and Bioelectricity Basics. San Diego, CA: Academic, 2000. [Google Scholar]
- Haider B, Schulz DPA, Häusser M, Carandini M. Millisecond coupling of local field potentials to synaptic currents in the awake visual cortex. Neuron 90: 35–42, 2016. doi: 10.1016/j.neuron.2016.02.034. [DOI] [PMC free article] [PubMed] [Google Scholar]
- Hasenstaub A, Shu Y, Haider B, Kraushaar U, Duque A, McCormick DA. Inhibitory postsynaptic potentials carry synchronized frequency information in active cortical networks. Neuron 47: 423–435, 2005. doi: 10.1016/j.neuron.2005.06.016. [DOI] [PubMed] [Google Scholar]
- Henze DA, Borhegyi Z, Csicsvari J, Mamiya A, Harris KD, Buzsáki G. Intracellular features predicted by extracellular recordings in the hippocampus in vivo. J Neurophysiol 84: 390–400, 2000. [DOI] [PubMed] [Google Scholar]
- Hodgkin AL, Huxley AF, Katz B. Measurement of current-voltage relations in the membrane of the giant axon of Loligo. J Physiol 116: 424–448, 1952. doi: 10.1113/jphysiol.1952.sp004716. [DOI] [PMC free article] [PubMed] [Google Scholar]
- Johnson JB. Thermal agitation of electricity in conductors. Phys Rev 32: 97–109, 1928. doi: 10.1103/PhysRev.32.97. [DOI] [Google Scholar]
- Keefer EW, Botterman BR, Romero MI, Rossi AF, Gross GW. Carbon nanotube coating improves neuronal recordings. Nat Nanotechnol 3: 434–439, 2008. doi: 10.1038/nnano.2008.174. [DOI] [PubMed] [Google Scholar]
- Khodagholy D, Gelinas JN, Thesen T, Doyle W, Devinsky O, Malliaras GG, Buzsáki G. NeuroGrid: recording action potentials from the surface of the brain. Nat Neurosci 18: 310–315, 2015. doi: 10.1038/nn.3905. [DOI] [PMC free article] [PubMed] [Google Scholar]
- Kilner JM, Baker SN, Lemon RN. A novel algorithm to remove electrical cross-talk between surface EMG recordings and its application to the measurement of short-term synchronisation in humans. J Physiol 538: 919–930, 2002. doi: 10.1113/jphysiol.2001.012950. [DOI] [PMC free article] [PubMed] [Google Scholar]
- Lempka SF, Johnson MD, Barnett DW, Moffitt MA, Otto KJ, Kipke DR, McIntyre CC. Optimization of microelectrode design for cortical recording based on thermal noise considerations. Conf Proc IEEE Eng Med Biol Soc 1: 3361–3364, 2006. doi: 10.1109/IEMBS.2006.259432. [DOI] [PubMed] [Google Scholar]
- Logothetis NK, Kayser C, Oeltermann A. In vivo measurement of cortical impedance spectrum in monkeys: implications for signal propagation. Neuron 55: 809–823, 2007. doi: 10.1016/j.neuron.2007.07.027. [DOI] [PubMed] [Google Scholar]
- Lopez CM, Andrei A, Mitra S, Welkenhuysen M, Eberle W, Bartic C, Puers R, Yazicioglu RF, Gielen GGE. An implantable 455-active-electrode 52-channel CMOS neural probe. IEEE J Solid-State Circuits 49: 248–261, 2014. doi: 10.1109/JSSC.2013.2284347. [DOI] [Google Scholar]
- Matsuzaka Y, Ichihara T, Abe T, Mushiake H. Bio-amplifier with driven shield inputs to reduce electrical noise and its application to laboratory teaching of electrophysiology. J Undergrad Neurosci Educ 10: A118–A124, 2012. [PMC free article] [PubMed] [Google Scholar]
- Maynard EM, Nordhausen CT, Normann RA. The Utah intracortical Electrode Array: a recording structure for potential brain-computer interfaces. Electroencephalogr Clin Neurophysiol 102: 228–239, 1997. doi: 10.1016/S0013-4694(96)95176-0. [DOI] [PubMed] [Google Scholar]
- Miceli S, Ness TV, Einevoll GT, Schubert D. Impedance Spectrum in Cortical Tissue: Implications for Propagation of LFP Signals on the Microscopic Level. eNeuro 4: ENEURO.0291–16.2016, 2017. doi: 10.1523/ENEURO.0291-16.2016. [DOI] [PMC free article] [PubMed] [Google Scholar]
- Mitzdorf U. Current source-density method and application in cat cerebral cortex: investigation of evoked potentials and EEG phenomena. Physiol Rev 65: 37–100, 1985. [DOI] [PubMed] [Google Scholar]
- Moffitt MA, McIntyre CC. Model-based analysis of cortical recording with silicon microelectrodes. Clin Neurophysiol 116: 2240–2250, 2005. doi: 10.1016/j.clinph.2005.05.018. [DOI] [PubMed] [Google Scholar]
- Mountcastle VB. Modality and topographic properties of single neurons of cat’s somatic sensory cortex. J Neurophysiol 20: 408–434, 1957. [DOI] [PubMed] [Google Scholar]
- Nagaoka T, Walker DD, Seaba PJ, Yamada T. “Cross-talk” in recording evoked potentials. Electroencephalogr Clin Neurophysiol 84: 473–476, 1992. doi: 10.1016/0168-5597(92)90035-A. [DOI] [PubMed] [Google Scholar]
- Najafi K, Ji J, Wise KD. Scaling limitations of silicon multichannel recording probes. IEEE Trans Biomed Eng 37: 1–11, 1990. doi: 10.1109/10.43605. [DOI] [PubMed] [Google Scholar]
- Nelson MJ, Bosch C, Venance L, Pouget P. Microscale inhomogeneity of brain tissue distorts electrical signal propagation. J Neurosci 33: 2821–2827, 2013. doi: 10.1523/JNEUROSCI.3502-12.2013. [DOI] [PMC free article] [PubMed] [Google Scholar]
- Nelson MJ, Pouget P. Do electrode properties create a problem in interpreting local field potential recordings? J Neurophysiol 103: 2315–2317, 2010. doi: 10.1152/jn.00157.2010. [DOI] [PubMed] [Google Scholar]
- Nelson MJ, Pouget P, Nilsen EA, Patten CD, Schall JD. Review of signal distortion through metal microelectrode recording circuits and filters. J Neurosci Methods 169: 141–157, 2008. doi: 10.1016/j.jneumeth.2007.12.010. [DOI] [PMC free article] [PubMed] [Google Scholar]
- Nyquist H. Thermal agitation of electric charge in conductors. Phys Rev 32: 110–113, 1928. doi: 10.1103/PhysRev.32.110. [DOI] [Google Scholar]
- Okun M, Naim A, Lampl I. The subthreshold relation between cortical local field potential and neuronal firing unveiled by intracellular recordings in awake rats. J Neurosci 30: 4440–4448, 2010. doi: 10.1523/JNEUROSCI.5062-09.2010. [DOI] [PMC free article] [PubMed] [Google Scholar]
- Poo C, Isaacson JS. Odor representations in olfactory cortex: “sparse” coding, global inhibition, and oscillations. Neuron 62: 850–861, 2009. doi: 10.1016/j.neuron.2009.05.022. [DOI] [PMC free article] [PubMed] [Google Scholar]
- Poulet JFA, Petersen CCH. Internal brain state regulates membrane potential synchrony in barrel cortex of behaving mice. Nature 454: 881–885, 2008. doi: 10.1038/nature07150. [DOI] [PubMed] [Google Scholar]
- Ranta R, Le Cam S, Tyvaert L, Louis-Dorr V. Assessing human brain impedance using simultaneous surface and intracerebral recordings. Neuroscience 343: 411–422, 2017. doi: 10.1016/j.neuroscience.2016.12.013. [DOI] [PubMed] [Google Scholar]
- Rios G, Lubenov EV, Chi D, Roukes ML, Siapas AG. Nanofabricated neural probes for dense 3-D recordings of brain activity. Nano Lett 16: 6857–6862, 2016. doi: 10.1021/acs.nanolett.6b02673. [DOI] [PMC free article] [PubMed] [Google Scholar]
- Robinson D. The electrical properties of metal microelectrodes. Proc IEEE 56: 1065–1071, 1968. doi: 10.1109/PROC.1968.6458. [DOI] [Google Scholar]
- Teleńczuk B, Baker SN, Kempter R, Curio G. Correlates of a single cortical action potential in the epidural EEG. Neuroimage 109: 357–367, 2015. doi: 10.1016/j.neuroimage.2014.12.057. [DOI] [PMC free article] [PubMed] [Google Scholar]
- Trevelyan AJ. The direct relationship between inhibitory currents and local field potentials. J Neurosci 29: 15299–15307, 2009. doi: 10.1523/JNEUROSCI.2019-09.2009. [DOI] [PMC free article] [PubMed] [Google Scholar]
- Wei XF, Grill WM. Impedance characteristics of deep brain stimulation electrodes in vitro and in vivo. J Neural Eng 6: 046008, 2009. doi: 10.1088/1741-2560/6/4/046008. [DOI] [PMC free article] [PubMed] [Google Scholar]
- Wójcik DK. Current Source Density (CSD) analysis. In: Encyclopedia of Computational Neuroscience, edited by Jaeger D, Jung R. New York: Springer, 2014, p. 1–10. [Google Scholar]