Abstract
Buildup of hydrogen sulfide (H2S), which functions as a signaling molecule but is toxic at high concentrations, is averted by its efficient oxidation by the mitochondrial sulfide oxidation pathway. The first step in this pathway is catalyzed by a flavoprotein, sulfide quinone oxidoreductase (SQR), which converts H2S to a persulfide and transfers electrons to coenzyme Q via a flavin cofactor. All previous studies on human SQR have used detergent-solubilized protein. Here, we embedded human SQR in nanodiscs (ndSQR) and studied highly homogenous preparations by steady-state and rapid-kinetics techniques. ndSQR exhibited higher catalytic rates in its membranous environment than in its solubilized state. Stopped-flow spectroscopic data revealed that transfer of the sulfane sulfur from an SQR-bound cysteine persulfide intermediate to a small-molecule acceptor is the rate-limiting step. The physiological acceptor of sulfane sulfur from SQR has been the subject of controversy; we report that the kinetic analysis of ndSQR is consistent with glutathione rather than sulfite being the predominant acceptor at physiologically relevant concentrations of the respective metabolites. The identity of the acceptor has an important bearing on how the sulfide oxidation pathway is organized. Our data are more consistent with the reaction sequence for sulfide oxidation being: H2S → glutathione persulfide → sulfite → sulfate, than with a more convoluted route that would result if sulfite were the primary acceptor of sulfane sulfur. In summary, nanodisc-incorporated human SQR exhibits enhanced catalytic performance, and pre-steady-state kinetics characterization of the complete SQR catalytic cycle indicates that GSH serves as the physiologically relevant sulfur acceptor.
Keywords: enzyme kinetics, flavin, flavin adenine dinucleotide (FAD), oxidation-reduction (redox), pre-steady-state kinetics, glutathione, hydrogen sulfide
Introduction
Hydrogen sulfide (H2S) is a signaling molecule that exerts varied effects in the cardiovascular, gastrointestinal, and central nervous systems (1, 2). In mammals, H2S is produced enzymatically by cystathionine β-synthase and cystathionine γ-lyase in the transsulfuration pathway (3, 4) as well as by 3-mercaptopyruvate sulfurtransferase (5, 6). However, H2S accumulation is toxic because it targets cytochrome c oxidase in the electron transport chain (7). Thus, low steady-state levels of H2S are maintained primarily by the action of the mitochondrial sulfide oxidation pathway, which converts H2S to thiosulfate and sulfate (8). The sulfide oxidation pathway is also postulated to facilitate H2S-mediated signaling via generation of reactive sulfur species (9).
The first step in the sulfide oxidation pathway is catalyzed by sulfide quinone oxidoreductase (SQR).2 SQR is anchored in the inner mitochondrial membrane and is a member of the flavin disulfide reductase family (10). It catalyzes a combination of a sulfur transfer reaction from H2S to an acceptor via a cysteine persulfide (Cys-SSH) intermediate and an electron transfer reaction from H2S to coenzyme Q (CoQ10) via a FADH2 intermediate (Fig. 1). The postulated reaction mechanism involves the addition of H2S to the active site disulfide formed between Cys-379 and Cys-201 to form Cys-SSH at Cys-379 with the release of the Cys-201 thiolate. The latter engages in an intensely absorbing charge transfer (CT) complex with FAD with an absorbance maximum at ∼675 nm (9, 11) Transfer of the sulfane sulfur from Cys-SSH to one of several acceptors completes the sulfur transfer reaction, yielding a small molecule persulfide and reduced FADH2 (8, 9, 11, 12). In the second half-reaction, FADH2 relays two electrons to oxidized CoQ10 to regenerate the resting enzyme. SQR exhibits remarkable substrate promiscuity using a variety of small molecule acceptors in vitro, including cyanide, sulfite, sulfide, GSH, cysteine, and homocysteine (8, 11, 12) (Fig. 1A). The identity of the primary acceptor in vivo is unclear and, in fact, is a matter of controversy. Due to the high reactivity of sulfite with the Cys-SSH intermediate in SQR and the reported lack of GSH acceptor activity, it was initially concluded that sulfite functions as the primary sulfane sulfur acceptor (11). This view was soon challenged by the demonstration that GSH can indeed function as a sulfane sulfur acceptor at physiologically relevant concentrations of this thiol (12). Simulations using a range of sulfite concentrations from 0 to 100 μm predicted that sulfite would surpass the acceptor activity of GSH at concentrations of >30 μm (12). Although GSH concentrations are well determined and range from 1 to 10 mm depending on the cell type, the concentration of sulfite is poorly determined. A recent study, however, reported an intracellular sulfite concentration of 9.2 μm in rat liver (13). The authors used monobromobimane derivatization of tissue extract followed by HPLC analysis to estimate sulfite concentration. However, the identity of the compound(s) in the peak eluting with the same retention time as authentic sulfite was not validated by mass spectrometry or NMR spectroscopy. For reasons discussed later, it is highly probable that the sulfite concentration was overestimated in this study. The reactivity of sulfite (e.g. with some flavoproteins with KD values in the nanomolar to low micromolar range; Ref. 14) is well known, and the presence of sulfite oxidase in compartments (e.g. the peroxisome), where sulfur assimilation does not occur, has been taken as evidence of its importance in removing toxic sulfite and maintaining low concentrations (15). The kcat/Km for the reaction of sulfite oxidase with sulfite is 2.4 × 10⁶ m−1s−1 (16).
Figure 1.
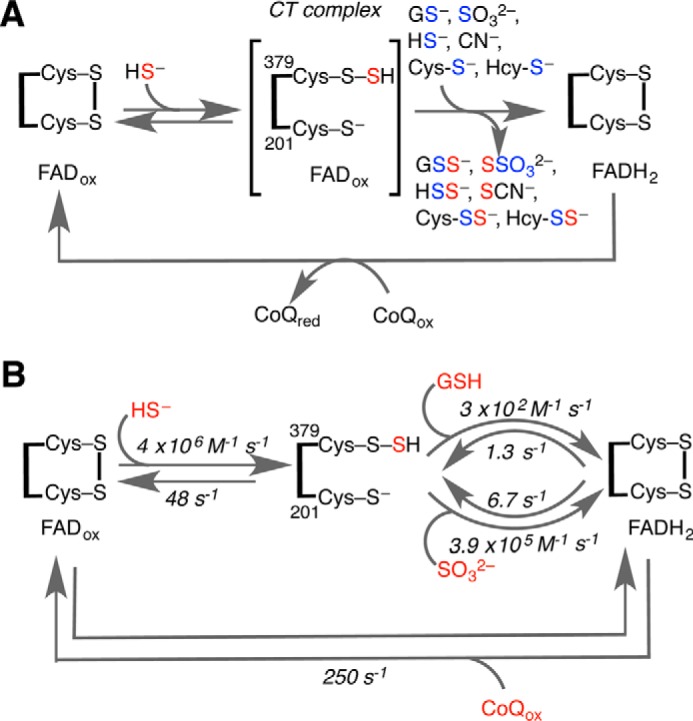
Minimal reaction mechanism of SQR. A, reaction of sulfide (red) with the resting form of SQR leads to the formation of a Cys-SSH intermediate and the CT complex. A variety of acceptors (glutathione, sulfite, sulfide, cyanide, cysteine (Cys-S−), and homocysteine (Hcy-S−), shown in blue) can accept the sulfane sulfur as two electrons are transferred to FAD to give FADH2. Oxidation of the latter by CoQ regenerates the resting enzyme. B, the rate constants for the individual steps for ndSQR determined in this study are shown.
The issue of what constitutes the physiological acceptor of SQR is pertinent to understanding how the sulfide oxidation pathway is organized. If the product is thiosulfate (with sulfite as acceptor), then it must first be converted to GSSH, the only known substrate for persulfide dioxygenase (PDO, also known as ETHE1), which catalyzes the conversion of GSSH to sulfite and GSH (17, 18). If on the other hand, the product is GSSH (with GSH as acceptor), then it can be directly utilized by PDO.
All prior studies on human SQR have used detergent-solubilized protein from membranes (9, 11–13). Stopped-flow spectroscopic studies on solubilized protein were used to characterize the kinetics of the first detectable step, i.e. CT complex formation (9). Because SQR is a membrane protein, it is important that its catalytic properties and efficacy with sulfite versus GSH as the acceptor be assessed in a more native membrane-like environment. To this end, we have incorporated human SQR into nanodiscs (ndSQR), generating soluble, monodisperse, and stable protein in the absence of detergent. ndSQR exhibits enhanced activity compared with the previously studied solubilized protein. Stopped-flow spectroscopic characterization of ndSQR revealed enhanced sulfide binding and that sulfane sulfur transfer from Cys-SSH to either GSH or sulfite constitutes the rate-limiting step. In contrast, electrons are rapidly transferred from ndSQR-bound FADH2 to CoQ. This study provides the kinetic framework for assessing the SQR reaction in the context of the mitochondrial sulfide oxidation pathway.
Results
Incorporation of human SQR into nanodiscs
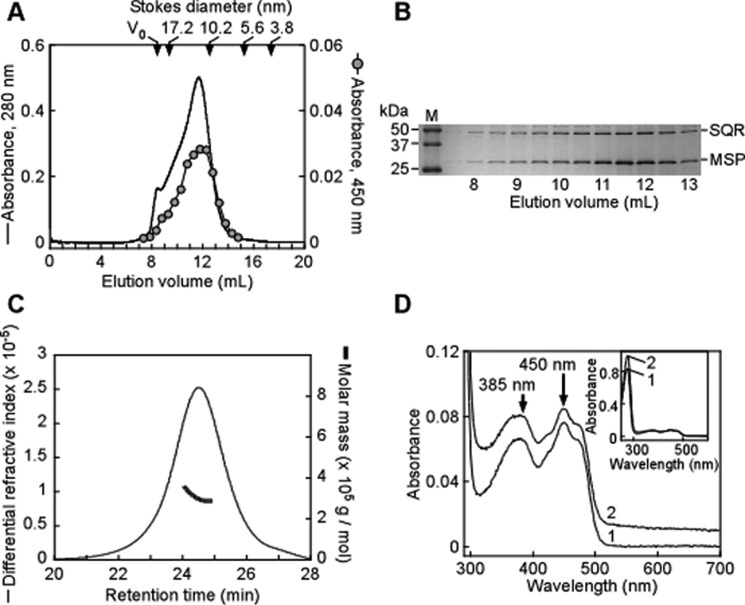
The purification procedure developed previously for human SQR involves extraction of the recombinant enzyme from Escherichia coli membranes and solubilization using DHPC, a phospholipid detergent with short fatty acid chains (11, 12). To transition the solubilized SQR into nanodiscs, we combined the enzyme with the MSP1E3D1 scaffold protein (MSP) (19, 20) and the phospholipid POPC as described under “Experimental Procedures.” A molar ratio of 1:1:130 for SQR/MSP/POPC was used to incorporate one SQR dimer per nanodisc containing 2 MSPs and ∼125 POPC molecules per disc leaflet (21). Upon purification by gel filtration, ndSQR eluted at a position consistent with the Stokes diameter of ∼13 nm for MSP1E3D1 nanodiscs assembled with POPC (Fig. 2A, black trace) (19, 20). This nanodisc peak overlapped with the 450-nm absorbance of the FAD cofactor in SQR (Fig. 2A, gray circles), and both MSP and SQR were detected in the elution peak by SDS-PAGE (Fig. 2B). The assembled ndSQR was further assessed by size exclusion chromatography coupled with multi-angle light scattering (SEC-MALS), which yielded an estimated molecular mass of ∼303 kDa and a polydispersity index of 1.007 ± 0.06, corresponding to a monodisperse population (Fig. 2C). The FAD spectrum of ndSQR was virtually identical to that of solubilized SQR, with absorbance maxima at 385 and 450 nm (Fig. 2D). The A450:A280 ratio of ∼10:1 obtained with detergent-solubilized SQR (11, 12) was increased to ∼13:1 with ndSQR due to the presence of MSP (Fig. 2D, inset).
Figure 2.
Incorporation of human SQR into nanodiscs. A, elution profile of ndSQR in nanodisc buffer. The elution was monitored at 280 nm (solid black line), and individual fractions were measured for FAD absorbance at 450 nm (gray circles). V0 denotes the void volume. The denoted Stokes diameters (DS) are derived from gel filtration standards in nanodisc buffer and represent thyroglobulin (670 kDa, DS = 17.2 nm), γ-globulin (158 kDa, DS = 10.2 nm), ovalbumin (44 kDa, DS = 5.6 nm), and myoglobin (17 kDa, DS = 3.8 nm), respectively. B, SDS-PAGE analysis of eluted gel filtration fractions of ndSQR containing SQR (47 kDa) and the MSP (32.6 kDa). Molecular weight markers are shown in lane M. C, SEC-MALS elution profile of purified ndSQR in 50 mm HEPES, pH 7.5, containing 150 mm KCl, 2 mm MgCl2, and 2 mm DTT. The refractive index (thin trace) and molar mass (thick trace) are plotted versus retention time. D, UV-visible absorbance spectra of detergent solubilized SQR (spectrum 1, 6.7 μm in nanodisc buffer containing 0.03% DHPC) compared with ndSQR (spectrum 2, 6.7 μm in nanodisc buffer, offset for clarity).
Steady-state kinetic characterization of ndSQR with small-molecule acceptors
We characterized sulfide-driven reduction of CoQ1 by ndSQR in the presence of various concentrations of sulfite, sulfide, or GSH (Fig. 3). In comparison to solubilized SQR, ndSQR showed somewhat greater activity with all acceptors tested (Table 1). The catalytic efficiency (kcat/Km) of the ndSQR reaction with sulfite, GSH, and sulfide was 25, 45, and 100% greater, respectively, than that of solubilized SQR. We note that the Km for GSH was previously overestimated (12) due to the contribution of a non-enzymatic, GSH-dependent CoQ1 reduction activity (13), determined to be ∼1.6 μmol of CoQ1 min−1 mm GSH−1 under our assay conditions. Correcting for this background yielded an ∼3-fold lower value for Km for GSH using solubilized SQR, which was identical to that obtained with ndSQR.
Figure 3.
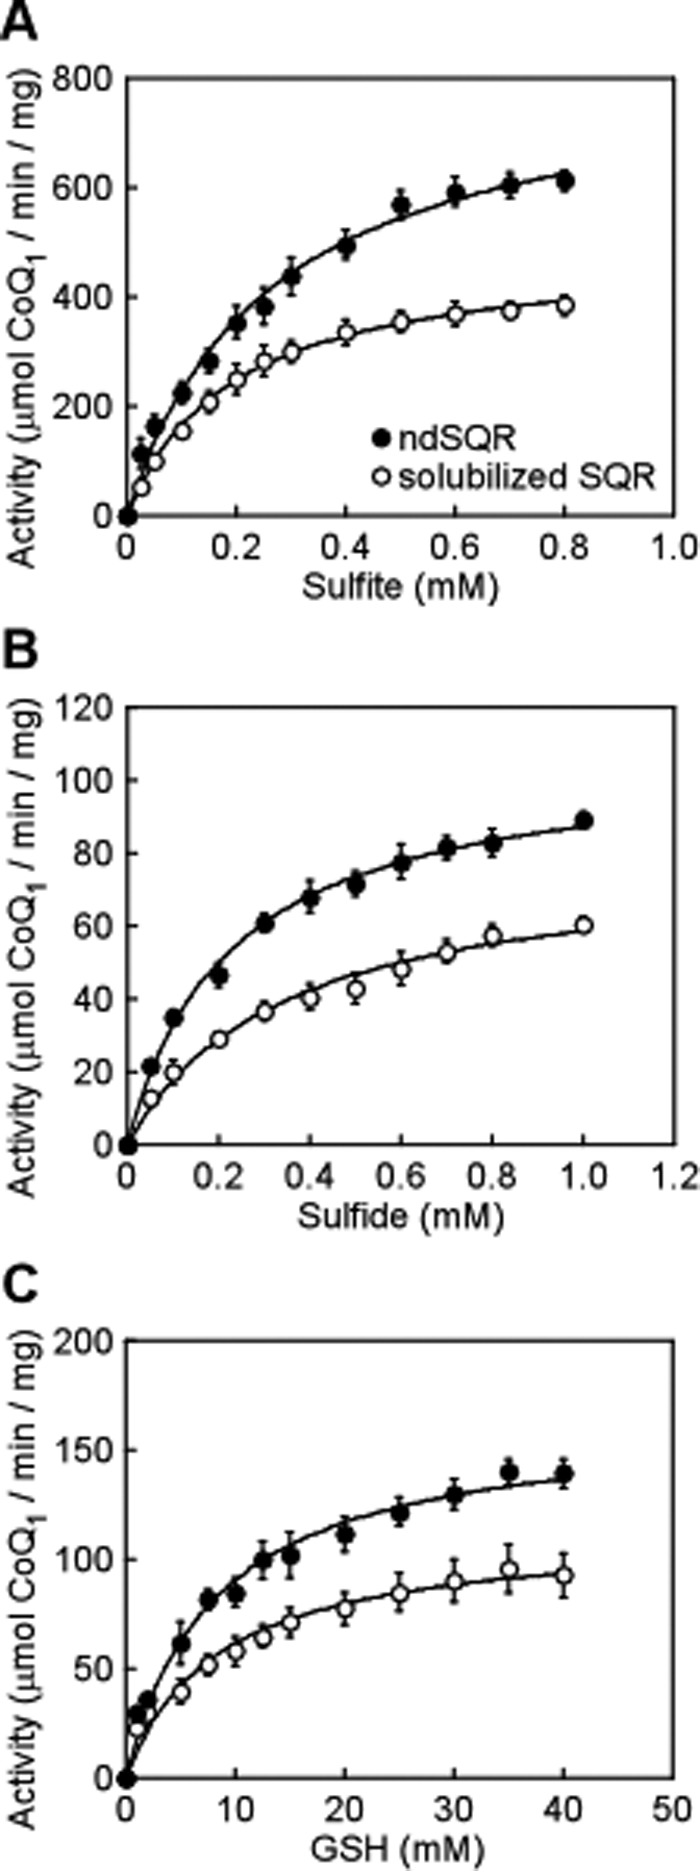
Steady-state kinetic characterization of H2S oxidation by ndSQR in nanodiscs with varying concentrations of small molecule acceptors. The rates of sulfide-driven CoQ1 reduction were assayed with ndSQR (closed circles) versus detergent solubilized enzyme (open circles). The reactions included 0–0.8 mm sulfite (A), 0–1 mm sulfide (B), or 0–40 mm GSH (C) in 100 mm potassium phosphate buffer, pH 7.4, containing 60 μm CoQ1, 0.06 mg ml−1 BSA, 1 nm SQR, and 150 μm sulfide (except when sulfide was used as an acceptor in the reaction) at 25 °C. Assays with detergent-solubilized SQR were conducted in the presence of 0.03% DHPC. The data represent the mean ± S.D. of three independent experiments in which each acceptor concentration was assayed in duplicate.
Table 1.
Kinetic parameters for H2S oxidation by ndSQR versus solubilized SQR
| Acceptor | SQR | Km | Vmax | kcat | kcat/Km |
|---|---|---|---|---|---|
| mm | μmol/min/mg | s−1 | m−1 s−1 | ||
| Sulfite | In nanodiscs | 0.26 ± 0.03 | 830 ± 34 | 650 ± 27 | 2.5 × 10⁶ |
| Solubilized | 0.19 ± 0.01 | 488 ± 8 | 382 ± 6 | 2.0 × 10⁶ | |
| Sulfide | In nanodiscs | 0.23 ± 0.02 | 107 ± 2 | 84 ± 2 | 3.7 × 10⁵ |
| Solubilized | 0.35 ± 0.05 | 79 ± 4 | 62 ± 3 | 1.8 × 10⁵ | |
| GSH | In nanodiscs | 8 ± 1 | 164 ± 6 | 128 ± 5 | 1.6 × 10⁴ |
| Solubilized | 8 ± 1 | 113 ± 6 | 89 ± 5 | 1.1 × 10⁴ |
Kinetics of the sulfide-induced charge transfer complex formation in ndSQR
The addition of sulfide to SQR leads to the formation of an enzyme-bound Cys-SSH intermediate and a prominent CT band due to the interaction of the thiolate with FAD and has a characteristic absorbance maximum at 675 nm (11, 12). Stopped-flow spectroscopic analysis of CT complex development with ndSQR revealed identical spectral changes as seen with solubilized SQR, including increases in absorbance at 390 nm and 675 nm and a decrease in absorbance at 450 nm, with isosbestic points at 423 and 500 nm (Fig. 4A). The kon rate for sulfide binding to ndSQR (4 × 10⁶ m−1s−1) was 2-fold higher than observed with solubilized SQR (2 × 10⁶ m−1s−1); the koff rates were similar (48 ± 6 s−1 versus 46 ± 3 s−1). Thus, the apparent KD for sulfide binding to ndSQR (12 μm) is nearly 2-fold lower versus solubilized SQR (22 μm), indicating a higher binding affinity for sulfide when SQR is in its native membrane environment. Due to the presence of excess sulfide, the CT complex decayed slowly (∼0.02 s−1) with concomitant reduction of FAD (Fig. 4C) as seen previously with solubilized SQR (9).
Figure 4.
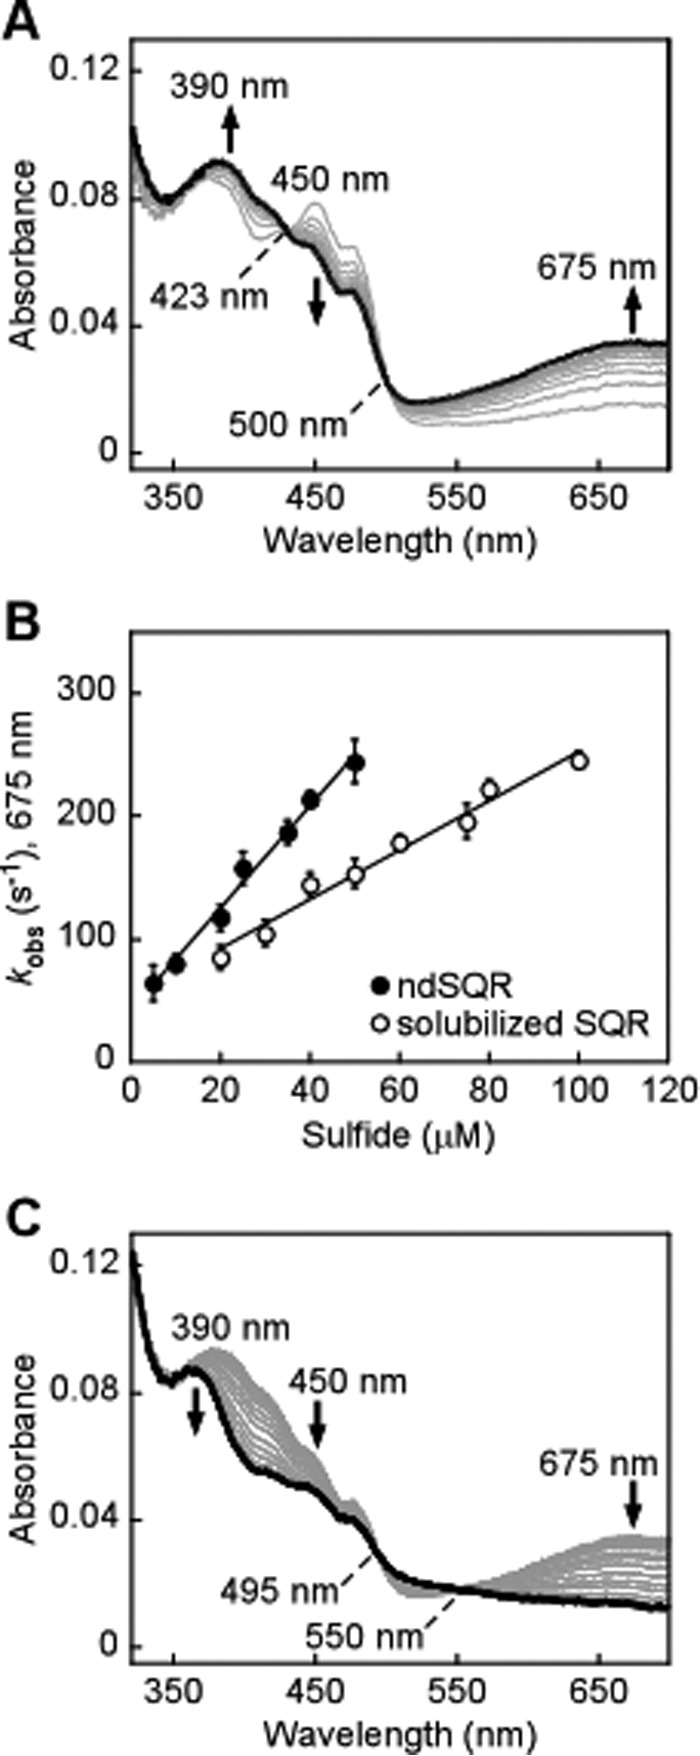
Rapid-kinetics analysis of sulfide binding to ndSQR. A, ndSQR (20 μm) in 100 mm potassium phosphate buffer, pH 7.4, was rapidly mixed 1:1 (v/v) with Na2S (40 μm) and monitored over a period of 3 s for CT complex formation (thick black line). B, dependence of the kobs for CT complex formation on the sulfide concentration for ndSQR (closed circles) versus detergent-solubilized SQR (open circles). The data represent the mean ± S.D. of three independent experiments. C, decay of the ndSQR charge transfer complex formed with 10 μm ndSQR and 20 μm Na2S, which was monitored over a period of 70 s and was accompanied by flavin reduction at 450 nm (thick black line).
Kinetics of GSH- and sulfite-dependent decay of the CT complex in ndSQR
The rate constant for the decay of the CT complex in the presence of either GSH or sulfite has not been previously evaluated. Double-mixing stopped-flow studies with ndSQR were employed to assess the kinetic competence of sulfane sulfur transfer from Cys-SSH to either GSH or sulfite as monitored by the decay of the CT complex, which was accompanied by reduction of FAD. For this, ndSQR was mixed with 2 eq of sulfide to form the CT complex, which was found to be stable for several seconds (Fig. 5A). After aging for ∼35 ms, GSH was introduced via a third syringe, which led to a rapid decrease in 675 nm absorbance of the CT complex (Fig. 5A) as FAD became reduced (Fig. 5B). The kobs for CT complex decay was linearly dependent on the concentration of GSH, yielding a koff of 1.3 ± 0.2 s−1, kon of 3 × 10² m−1 s−1, and an apparent KD of 4 mm at 4 °C (Fig. 5C).
Figure 5.
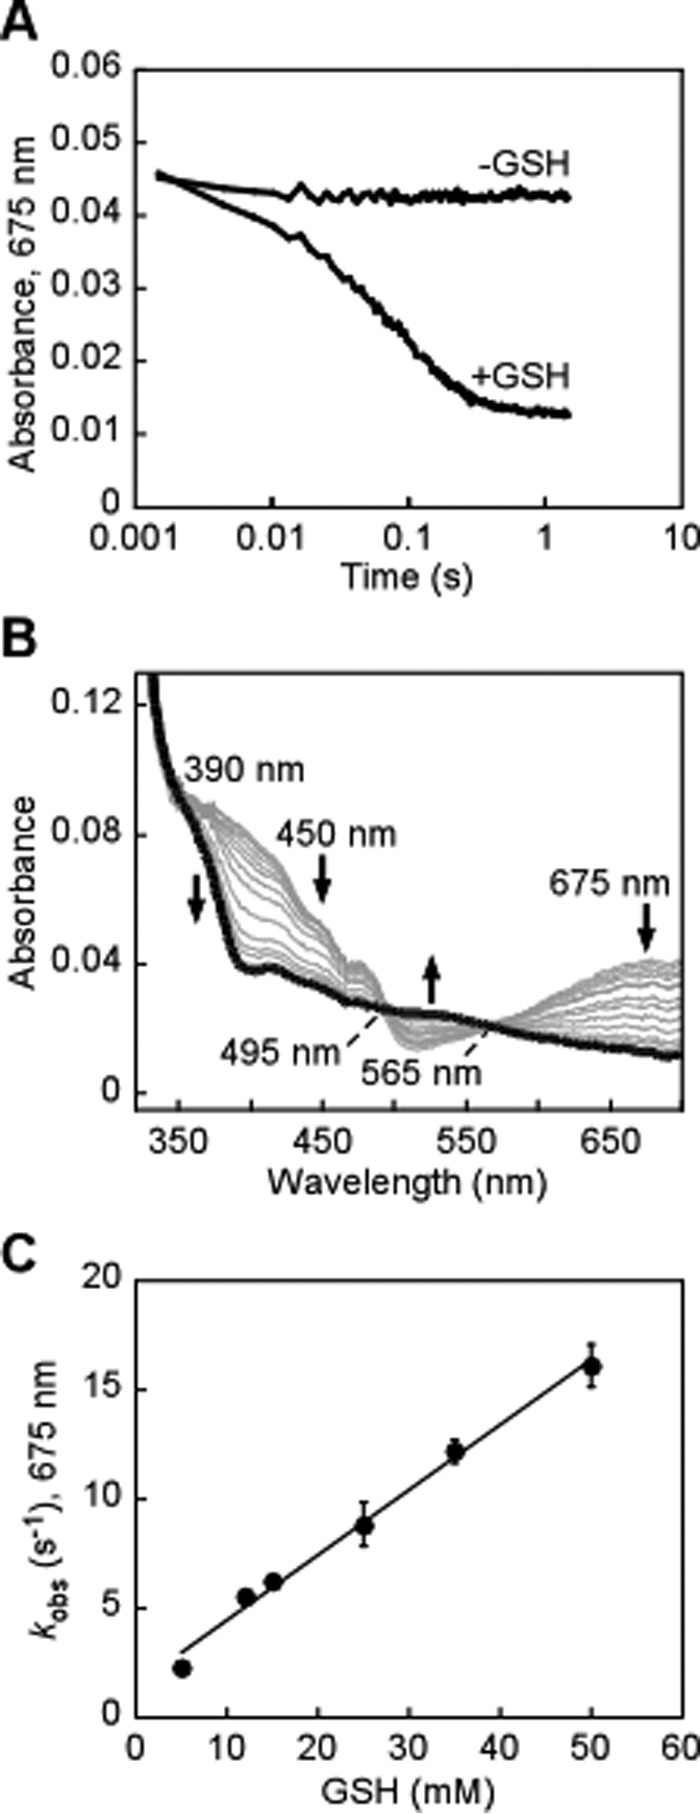
Disappearance of the sulfide-induced CT complex of ndSQR in the presence of GSH. A, ndSQR (40 μm) in 100 mm potassium phosphate buffer, pH 7.4, was rapidly mixed 1:1 (v/v) with Na2S (80 μm) and aged for ∼35 ms to form the CT complex, after which the mixture was rapidly mixed 1:1 (v/v) with 100 mm potassium phosphate buffer, pH 7.4 ± GSH (50 mm). The absorbance at 675 nm was monitored over a period of 3 s. B, spectral changes accompanying the disappearance of the CT complex in the presence of 25 mm GSH, monitored over 3 s, which demonstrated reduction of FAD (thick black line). C, dependence of the kobs for the disappearance of the CT complex in ndSQR on the GSH concentration. The data represent the mean ± S.D. of two independent experiments.
Rapid decay of the CT complex was also observed in the presence of sulfite (Fig. 6A), forming reduced FAD (Fig. 6B). The kobs for CT complex decay with sulfite was dependent on its concentration, yielding a koff of 6.7 ± 0.8 s−1, kon of 3.9 × 10⁵ m−1 s−1, and an apparent KD of 17 μm at 4 °C (Fig. 6C). The kobs values for the decay of the CT complex in the presence of 50 mm GSH or 100 μm sulfite (16 ± 1 s−1 and 46 ± 3 s−1 at 4 °C, respectively) are similar to kcat values obtained in the steady-state assay at the same substrate concentrations and temperature (13 ± 2 s−1 for GSH and 36 ± 2 s−1 for sulfite). This suggests that transfer of the sulfane sulfur from the active-site Cys-SSH to the acceptor is the primary rate-determining step in the SQR reaction cycle.
Figure 6.
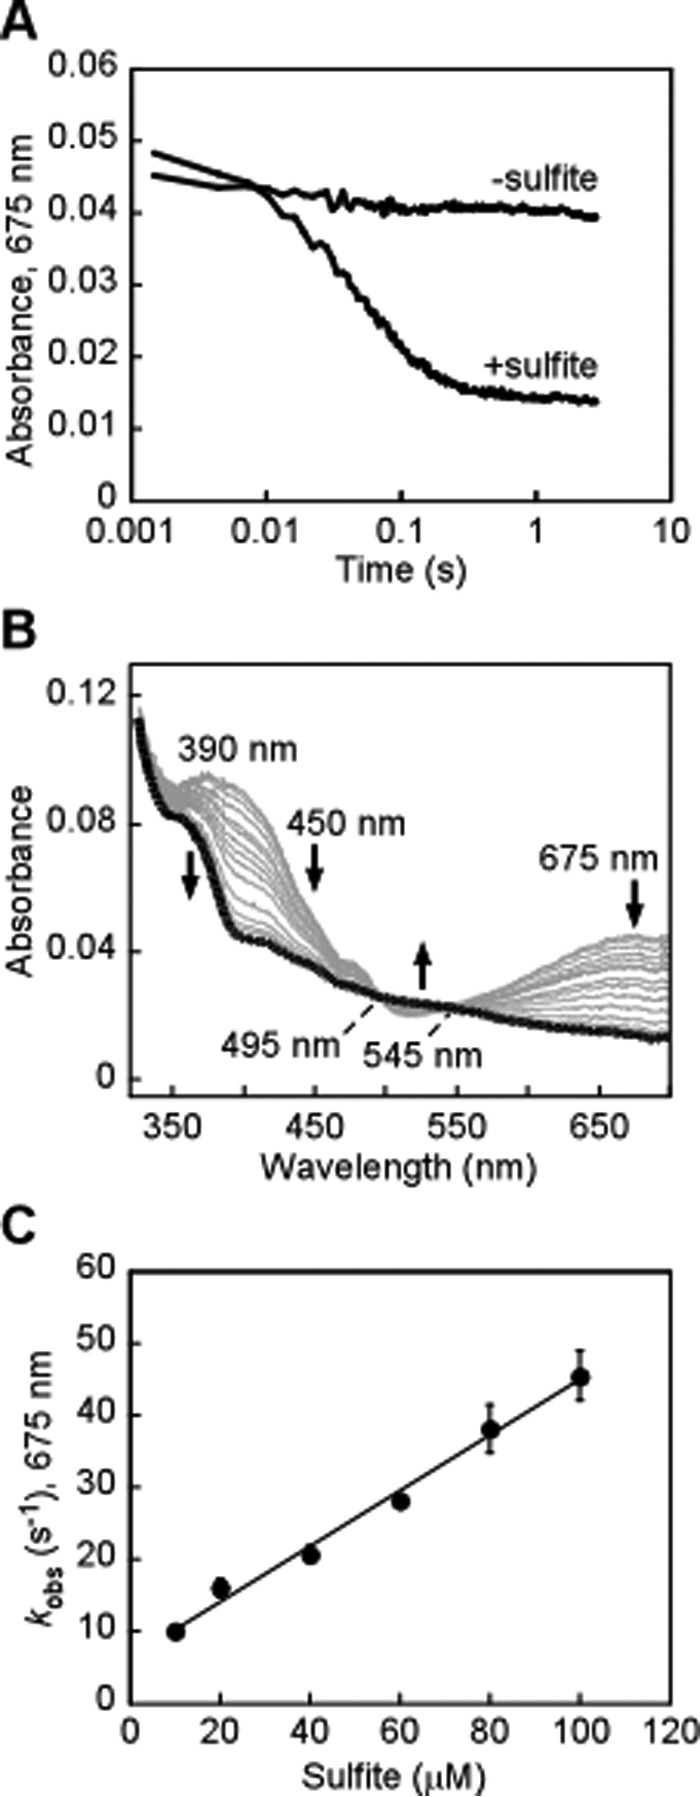
Disappearance of the sulfide-induced CT complex in ndSQR in the presence of sulfite. A, ndSQR (40 μm) in 100 mm potassium phosphate buffer, pH 7.4, was rapidly mixed 1:1 (v/v) with Na2S (80 μm) and aged for ∼35 ms to form the CT complex, after which the mixture was rapidly mixed 1:1 (v/v) with 100 mm potassium phosphate buffer, pH 7.4 ± sulfite (40 μm). The absorbance at 675 nm was monitored over a period of 3 s. B, spectral changes accompanying the disappearance of the CT complex in the presence of 20 μm sulfite, monitored over 3 s, which demonstrated reduction of FAD (thick black line). C, dependence of the kobs for the disappearance of the CT complex in ndSQR on the sulfite concentration. The data represent the mean ± S.D. of two independent experiments.
Kinetic analysis of ndSQR-mediated CoQ1 reduction
Sulfane sulfur transfer from Cys-SSH to the acceptor drives the reduction of FAD to FADH2, which in turn reduces the native quinone substrate, CoQ10. The rate of quinone reduction by ndSQR was determined under steady-state conditions by varying the concentration of the water-soluble analog CoQ1 at saturating concentrations of sulfide and sulfite. From this analysis, a value of 5 ± 0.2 μm was obtained for the Km for CoQ1 for ndSQR (Fig. 7). By comparison, an ∼5-fold higher Km value for CoQ1 (24 ± 3 μm) was obtained with solubilized SQR, which was consistent with a previous report (11).
Figure 7.
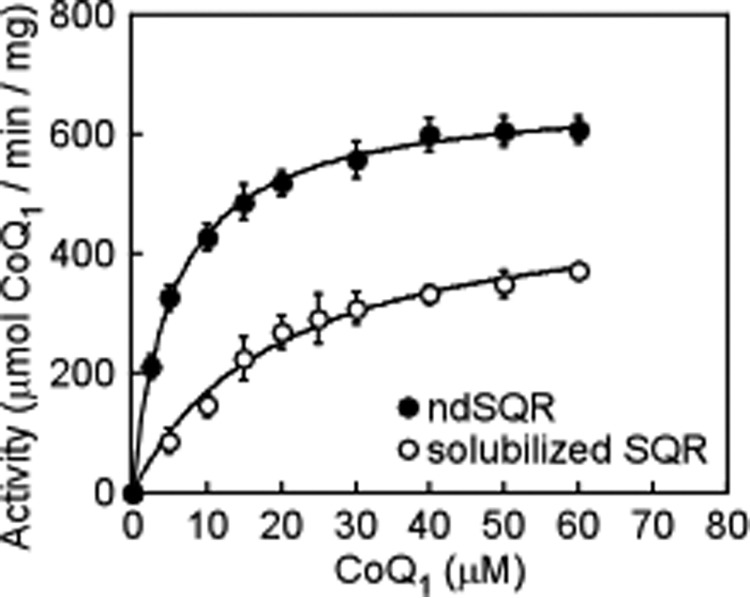
Kinetic analysis of ndSQR-mediated quinone reduction. The dependence of the activity of ndSQR (closed circles) and detergent solubilized SQR (open circles) on CoQ1 concentration. The reactions included 0.8 mm sulfite as the acceptor in 100 mm potassium phosphate buffer, pH 7.4, containing 0.06 mg ml−1 BSA, 1 nm SQR, and 150 μm sulfide at 25 °C. Assays with solubilized SQR were conducted in the presence of 0.03% DHPC. The data represent the mean ± S.D. of three independent experiments in which each CoQ1 concentration was assayed in duplicate.
The kinetic competence of the CoQ1 reduction half-reaction by ndSQR was investigated by stopped-flow studies. Because full reduction of ndSQR requires an excess of sulfide, its use would lead to enzyme turnover in the presence of CoQ1 (Fig. 1). Therefore, ndSQR was prereduced by photoreduction with 5-deazaflavin. Rapid mixing of CoQ1 with reduced ndSQR led to rapid flavin oxidation (Fig. 8A). The dependence of the kobs rates for ndSQR-bound FADH2 oxidation was hyperbolicversus CoQ1 concentration, yielding an apparent KD of 20 μm (Fig. 8B). The kobs rate approached a maximum of ∼250 s−1 at CoQ1 concentrations ≥50 μm. It is likely that CoQ10 reduction by SQR in vivo could proceed at a similar or even higher rate given that the hepatic concentration of CoQ10 is ∼100 μm (22).
Figure 8.
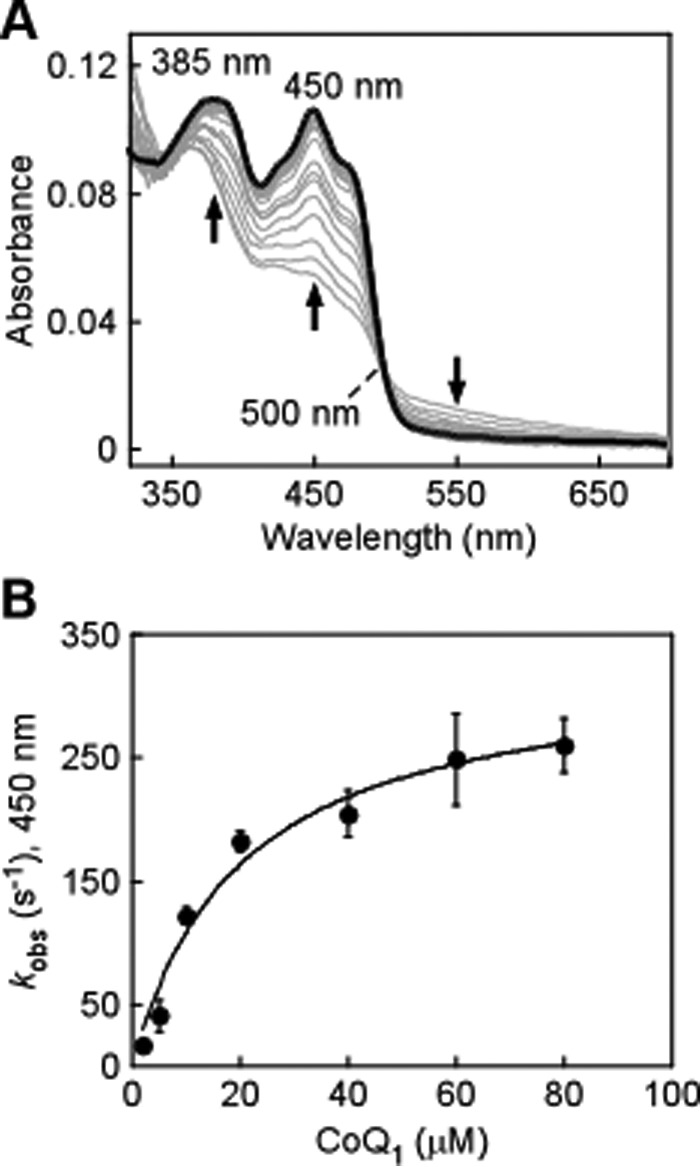
Kinetics of FAD oxidation in ndSQR by coenzyme Q1. A, ndSQR containing reduced FAD (20 μm) was produced via photoreduction as described under “Experimental Procedures” followed by reaction by 1:1 (v/v) rapid mixing with CoQ1 (40 μm) for 5 s, which resulted in the oxidation of FAD (thick black line). B, dependence of the kobs for ndSQR-mediated CoQ1 reduction on the concentration of CoQ1. The data represent the mean ± S.D. of two independent experiments.
Discussion
As a membrane protein, the study of human SQR has been limited by its insolubility and relative instability in aqueous solution. Furthermore, the use of detergent-solubilized protein could affect conformational dynamics and/or substrate access to SQR. Nanodiscs have proven to be powerful tools for studying membrane proteins and in several cases have led to improved kinetic behavior via effects ranging from subtle conformational shifts to changes in oligomerization states (23). In this study we prepared SQR incorporated into nanodiscs to compare its catalytic performance with detergent-solubilized protein, characterized the full catalytic cycle by stopped-flow spectroscopy, and obtained the relevant kinetic parameters in a lipid bilayer environment to address the controversy regarding the physiological sulfane sulfur acceptor.
The steady-state kinetic parameters for ndSQR reveals improved catalytic performance (kcat/Km) over that of detergent-solubilized SQR, particularly with sulfide (∼100%) and GSH (45%) (Table 1). Notably, the Km for GSH (8 ± 1 mm) is significantly lower than previously reported (22 ± 3 mm) (12), which can be attributed to correction of the background nonenzymatic rate of CoQ reduction by GSH. This background rate was previously postulated to be an SQR-mediated GSH:CoQ1 oxidoreductase activity (13) but was found in our studies to occur in the absence of SQR.
Our previous study of the pre-steady-state kinetics of solubilized SQR was limited to analysis of the first step in the reaction, i.e. formation of the CT complex in the presence of sulfite or sulfide (9). CT complex formation with sulfide was shown to be rapid (3.4 × 10⁵ m−1 s−1 at pH 7.4 and 4 °C) and kinetically competent (9). In contrast, the addition of sulfite to SQR to form sulfocysteine (Cys-S-SO32−) exhibited an ∼3000-fold lower rate constant under the same conditions (1 × 10² m−1 s−1). This observation ruled out an alternative mechanism in which sulfite adds first, and the resulting sulfocysteine intermediate is resolved by sulfide to form thiosulfate. In this study we determined a bimolecular rate constant for sulfide addition to ndSQR at 4 °C of 4 × 10⁶ m−1 s−1, which is greater than for the solubilized protein (Fig. 4). H2S is slightly hydrophobic, and its partition coefficient is 2 ± 0.6 (at 25 °C) in a dilauroyl phosphatidylcholine liposome/water mixture (24). Hence, the higher reaction rate of H2S with ndSQR than with the solubilized protein could be explained by its ability to concentrate in membranes leading to an increase in its local concentration in nanodiscs.
We have determined for the first time the rates of the individual reactions beyond the CT complex formation step (Fig. 1B). The rates of transfer of the sulfane sulfur group from ndSQR to small molecule acceptors were determined in double mixing experiments by stopped-flow spectroscopy (Figs. 5 and 6). The kobs values for sulfane sulfur transfer to GSH or to sulfite were similar to the steady-state kcat values under the same experimental conditions. Hence, transfer of the sulfane sulfur from cysteine persulfide to GSH (or sulfite), with concomitant reduction of FAD, was the rate-limiting step in SQR catalysis. The koff for sulfite (6.7 ± 0.8 s−1) was 5-fold greater than for GSH (1.3 ± 0.2 s−1), which was consistent with their difference in size and the greater potential for binding interactions between GSH and the active site residues of SQR. Although the kon for sulfite (3.9 × 10⁵ m−1 s−1) was 1300-fold greater than for GSH (3 × 10² m−1 s−1), the difference in their kcat values (under Vmax conditions) was only 5-fold (Table 1). This discrepancy between the 1300-fold greater association rate constant for sulfite versus GSH but only a 5-fold greater kcat suggests that one or more of the steps after acceptor binding, i.e. FAD reduction, re-formation of the disulfide, and transfer of the sulfane sulfur, occurs more efficiently with GSH as acceptor than with sulfite.
The final step in the reaction cycle, reduction of CoQ1 by FADH2, is very rapid (Fig. 8). The Km for CoQ1 is 5-fold lower for SQR incorporated into nanodiscs than for solubilized SQR (Fig. 7). The quinone pool resides in the mitochondrial inner membrane, and its interaction with SQR requires entry into the quinone-binding site at the protein-membrane interface, as seen in the structure of Acidithiobacillus ferrooxidans SQR (25). The lower Km for CoQ1 observed with ndSQR might be due not only to the enhanced efficiency of CoQ1 entry into the quinone-binding site but also due to sequestering of CoQ1 in nanodiscs, thus increasing its local concentration. The natural substrate for SQR is CoQ10, which is more hydrophobic and because it could partition even more favorably into the membrane, could potentially react even more rapidly than CoQ1 (∼250 s−1 at ≥50 μm CoQ1). Reduction of CoQ integrates H2S oxidation with the electron transport chain by providing reduced quinone to complex III (26).
With the kinetic parameters obtained with ndSQR, the question of its physiological sulfane sulfur acceptor can now be reevaluated. Although GSH exhibits a lower catalytic efficiency (kcat/Km = 1.6 × 10⁴ m−1s−1) than sulfite (2.5 × 10⁶ m−1s−1), it is far more abundant in the cell. The Km value for GSH (8 ± 1 mm) is within the range of its intracellular concentration. In contrast, the Km for sulfite (260 ± 30 μm) is significantly higher than the intracellular sulfite concentration, which is in fact not well known. Other than a few reports of sulfite concentration in human serum and plasma, in which it is very low (<20 nm for free sulfite and 0.47–4.6 μm for total (free + bound) sulfite) (27, 28), a recent report of intracellular sulfite estimated it to be 9.2 μm in rat liver and even higher in heart (13). To compensate for the then undetermined intracellular concentration of sulfite, we had previously used kinetic simulations over a sulfite concentration range of 0–100 μm. The kinetic simulations predicted that GSH (even with the higher Km(GSH) value of 22 ± 3 mm used in that study) is the dominant acceptor at <30 μm sulfite concentrations (12). Using the corrected Km for GSH and the kcat/Km, values for ndSQR determined in this study (Table 1), we can estimate turnover number of 112 s−1 at 7 mm GSH (liver concentration; Refs. 29 and 30) versus 23 s−1 at 9.2 μm sulfite. Based on these estimates derived from steady-state kinetic parameters alone, GSH is favored ∼5:1 over sulfite as an acceptor. However, as discussed below, it is likely that the preference for GSH is much greater than 5-fold under cellular conditions.
The prevalence of substrate promiscuity in enzyme-catalyzed reactions (31), including those involved in H2S biogenesis (32), is well known. Typically, promiscuity arises from the ability of structurally related substrates to compete for the same binding site. In the case of SQR, it would be remarkable if an active site that had evolved to bind sulfite would coincidentally also bind the tripeptide substrate, i.e. GSH, as has been suggested (11, 13). Instead, we conclude that an active site that accommodates GSH can in principle bind smaller substrates (e.g. homocysteine, cysteine, and sulfite, each of which serves as alternative acceptors; Ref. 12) and that these side reactions are averted in cells by the high Km values of these alternative acceptors versus their intracellular concentrations. In this context, it is critically important to have a rigorously determined value for the intracellular sulfite concentration.
The reactivity of sulfite, a six-electron oxidized product of H2S, with aldehydes and DNA is well known, and its toxicity (33) has been exploited in the food industry for use as a preservative. In fact, the toxicity and anti-nutritional effects of sulfite (via depletion of thiamin and folic acid) (34) has led to a Food and Drug Administration ban on its use as a preservative in certain foods. It is very likely that the intracellular concentration of liver sulfite is kept low due to the high abundance and activity of sulfite oxidase in this tissue (35). The 9.2 μm value is likely to be an overestimate, possibly resulting from the lack of analytical evaluation beyond the co-elution of an unknown peak from tissue lysates with authentic sulfite standard (13). Sulfur metabolite analysis from tissue extracts is routinely performed in our laboratory for detecting metabolites in the 0.01–10 mm concentration range (29, 30, 36), and the identity of all new metabolites is validated by mass spectrometric analysis after HPLC separation (e.g. Ref. 3). Based on our studies, we conclude that intracellular sulfite concentration in murine liver is too low to be reliably determined by HPLC-based analysis.3 It is likely that other compounds in tissue lysates, co-eluting with sulfite, contributed to its overestimation by HPLC analysis in the recent study (13).
The identity of the sulfane sulfur acceptor has important implications for how the sulfide oxidation pathway is organized. Although GSSH can be utilized directly by PDO (Fig. 9A), thiosulfate formed from sulfite cannot. Instead, thiosulfate must first undergo a second sulfur transfer to generate GSSH before it can be re-oxidized to sulfite by PDO (Fig. 9B). Rhodanese is a mitochondrial sulfurtransferase that catalyzes the reversible transfer of sulfane sulfur between GSSH and sulfite (GSSH + SO32− ⇔ GSH + S2O32−). In principle, it could serve as the sulfurtransferase that generates GSSH from thiosulfate. However, human rhodanese and its common polymorphic variants exhibit an ∼217,000-fold preference for sulfur transfer in the direction of GSSH → S2O32− with a kcat of 389 s−1 at pH 7.4 and 37 °C (12, 37). The only other known sulfurtransferase that can support the conversion of thiosulfate to GSSH (i.e. GSH + S2O32− ⇔ GSSH + SO32−) is TSTD1, which exhibits a Km for thiosulfate of 14 mm and a low kcat (2.7 s−1 at optimum pH of 9 and 37 °C). Its involvement in the sulfide oxidation pathway would necessitate the intercompartmental crossing of the highly reactive GSSH intermediate from the cytoplasm to the mitochondrion (Fig. 9B). This alternative pathway was described as “convoluted” even by its proponents (11).
Figure 9.
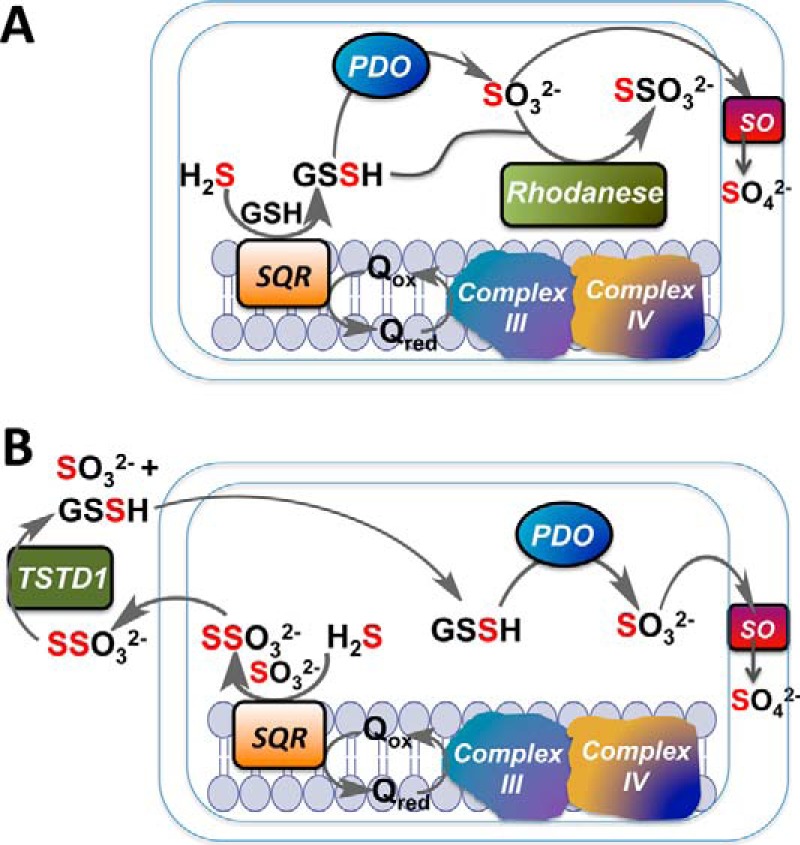
Implications of GSH versus sulfite as sulfane sulfur acceptor from SQR on the organization of the mitochondrial sulfide oxidation pathway. A, transfer of two-electron-oxidized sulfide to GSH forms GSSH, which is converted by PDO to sulfite. The latter is a substrate for sulfite oxidase (SO) that resides in the intermitochondrial membrane space and is further oxidized to sulfate. In this scheme rhodanese forms thiosulfate from GSSH and sulfite generated in the mitochondrion. B, transfer of two-electron oxidized sulfide from SQR to six-electron oxidized sulfite generates thiosulfate, which must be transported out of the mitochondrion to undergo a second sulfur transfer reaction catalyzed by TSTD1. The product GSSH, which is highly reactive, must be transported back into the mitochondrion for utilization by PDO. The sulfur atoms derived from H2S are shown in red. The metabolic logic of pathway B was described as convoluted even by its proponents (11), described under “Discussion,” is considered to be unlikely.
The clinical data on sulfur metabolite accumulation in PDO or rhodanese dysfunction or on thiosulfate catabolism can be interpreted to support either organizational scheme for H2S oxidation (11–13). In the absence of metabolic flux analysis combined with gene knockdown studies, use of these data to distinguish between pathways should be treated with caution.
In summary, we report the enhanced catalytic performance of human SQR incorporated in nanodiscs and present a rapid pre-steady-state kinetic characterization of the complete catalytic cycle. The proposal that the SQR active site evolved to accommodate sulfite but accidentally allows a significantly larger and much more abundant molecule, i.e. GSH, to effectively compete, appears to be improbable. Our kinetic data on ndSQR and the potential to directly funnel labile sulfur from SQR to PDO via GSH support our conclusion that GSH serves as the physiologically relevant sulfur acceptor. The crystal structure of human SQR will allow this question to be addressed unequivocally.
Experimental procedures
Materials
The following reagents were purchased from Sigma: Amberlite XAD-2 resin, CoQ1, GSH, sodium sulfide nonahydrate, sodium sulfite, and sodium cholate hydrate. The phospholipids, DHPC and POPC were purchased from Anatrace Lipids (Maumee, OH). The photocatalyst 5-deazaflavin was a generous gift from Dr. Bruce Palfey (University of Michigan).
Incorporation of human SQR into nanodiscs
Human SQR was purified as reported previously (12). The membrane scaffold protein MSP1E3D1 (MSP) was expressed in E. coli BL21(DE3) cells using the pET28b+ expression vector (plasmid # 20066, deposited to Addgene by Dr. Steven Sligar, University of Illinois at Urbana-Champaign) and purified as reported previously (19, 38).
SQR was incorporated into nanodiscs by combining POPC, MSP, and SQR in a molar ratio of 130:1:1 in nanodisc buffer (20 mm Tris, pH 7.4, containing 150 mm NaCl and 0.5 mm EDTA) with 25 mm sodium cholate. The mixture was incubated on ice for 1 h. Nanodisc assembly was induced by the removal of cholate by adsorption on Amberlite XAD-2 resin. The resin was pre-equilibrated with nanodisc buffer and incubated overnight with the assembly mixture at 4 °C with gentle agitation. The assembled nanodiscs were separated from the XAD-2 resin by filtration and subsequently purified by gel filtration using a 25-ml Superdex 200 column (GE Healthcare) equilibrated with nanodisc buffer. The size of the assembled discs was estimated by comparison with gel filtration standards (Bio-Rad) with known Stokes diameters. The purity of ndSQR was evaluated on a 15% SDS-polyacrylamide gel. The estimated molecular weight and polydispersity index of purified ndSQR was estimated by SEC-MALS, Wyatt Technology).
Spectral analysis of ndSQR
The electronic absorption spectra of ndSQR were recorded in 100 mm potassium phosphate buffer, pH 7.4. The same buffer containing DHPC (0.03%) was used for the detergent-solubilized enzyme. The concentrations of ndSQR and detergent-solubilized SQR were estimated using an extinction coefficient at 450 nm of 11,500 m−1 cm−1 for the FAD cofactor (11).
SQR activity assays
SQR activity was assessed at 25 °C by monitoring the reduction of CoQ1 at 278 nm (Δϵox-red = 12,000 m−1 cm−1) as described previously (11, 12). Stock solutions of CoQ1 were prepared aerobically in 10 mm potassium phosphate, pH 6.8, containing 10% DHPC. For assays with GSH as the acceptor, the reaction rates were corrected for trace amounts of CoQ1 reduction by GSH as previously reported (13). The kinetic parameters Km and Vmax were obtained by fitting the data sets to the Michaelis-Menten equation.
Stopped-flow spectroscopy
All aerobic rapid-mixing spectroscopic experiments were carried out at 4 °C on an SF-DX2 double mixing stopped-flow system from Hi-Tech Scientific equipped with a photodiode array detector (300–700-nm range). The sulfide concentration dependence of the kobs for CT complex formation was monitored as described previously (9). Spectra and kobs for the disappearance of the sulfide-induced CT complex in ndSQR in the presence of GSH or sulfite were obtained in double mixing experiments. For this, ndSQR (40 μm) in 100 mm potassium phosphate buffer, pH 7.4, was mixed with sulfide (80 μm), and the solution was allowed to age for ∼35 ms before mixing it with varying concentrations of GSH or sulfite in the same buffer. The reported concentrations are before mixing, and each mixing resulted in a 1:1 dilution (v/v). Sulfite concentrations were kept to <100 μm or below to minimize a competitive sulfite-induced CT complex formation previously observed in solubilized SQR (9). The kinetic traces at selected wavelengths were fitted using the KinetAsyst software.
Stopped-flow studies on the ndSQR-mediated reduction of CoQ1 were carried out at 8 °C on an Applied Photophysics stopped-flow system housed in an anaerobic chamber and equipped with a photodiode array detector (300–700 nm range). The reduced form of ndSQR (20 μm) was generated under anaerobic conditions by mixing 20 μm ndSQR in 100 mm potassium phosphate buffer, pH 7.4, with 15 mm EDTA and 2 μm 5-deazaflavin as a photocatalyst. The mixture was purged with N2 gas for 30 min in the dark followed by exposure to high-intensity white light for 30 min on ice. Reduced ndSQR was then mixed with various concentrations of CoQ1 (0–80 μm) in the stopped-flow spectrophotometer. The kinetic traces at selected wavelengths were fitted using Pro-Data SX software.
Author contributions
A. P. L. designed and performed the experiments. D. P. B helped with some of the stopped-flow experiments and with data analysis. R. B. helped conceive the experiments, analyzed the data, and co-wrote the manuscript with A. P. L. All authors approved the final version of the manuscript.
Acknowledgments
We thank Dr. Greg Campanello for assistance with the SEC-MALS analysis and Dr. Pramod Yadav for help with the initial experiments on solubilized SQR.
This work was supported in part by National Institutes of Health Grants GM112455 (to R. B.) and F32GM122357 (to A. P. L). The authors declare that they have no conflicts of interest with the contents of this article. The content is solely the responsibility of the authors and does not necessarily represent the official views of the National Institutes of Health.
V. Vitvitsky and R. Banerjee, unpublished results.
- SQR
- sulfide quinone oxidoreductase
- CoQ
- coenzyme Q
- Cys-SSH
- cysteine persulfide
- CT
- charge transfer
- ndSQR
- nanodisc-embedded SQR
- GSSH
- glutathione persulfide
- PDO
- persulfide dioxygenase
- DHPC
- 1,2-diheptanoyl-sn-glycero-3-phophocholine
- MSP
- MSP1E3D1 scaffold protein
- POPC
- 1-palmitoyl-2-oleoyl-sn-glycero-3-phosphocholine
- SEC-MALS
- size exclusion chromatography coupled with multi-angle light scattering.
References
- 1. Kimura H. (2010) Hydrogen sulfide: from brain to gut. Antioxid. Redox Signal. 12, 1111–1123 [DOI] [PubMed] [Google Scholar]
- 2. Kabil O., and Banerjee R. (2010) The redox biochemistry of hydrogen sulfide. J. Biol. Chem. 285, 21903–21907 [DOI] [PMC free article] [PubMed] [Google Scholar]
- 3. Chiku T., Padovani D., Zhu W., Singh S., Vitvitsky V., and Banerjee R. (2009) H2S biogenesis by cystathionine gamma-lyase leads to the novel sulfur metabolites, lanthionine, and homolanthionine and is responsive to the grade of hyperhomocysteinemia. J. Biol. Chem. 284, 11601–11612 [DOI] [PMC free article] [PubMed] [Google Scholar]
- 4. Singh S., Padovani D., Leslie R. A., Chiku T., and Banerjee R. (2009) Relative contributions of cystathionine β-synthase and gamma-cystathionase to H2S biogenesis via alternative trans-sulfuration reactions. J. Biol. Chem. 284, 22457–22466 [DOI] [PMC free article] [PubMed] [Google Scholar]
- 5. Shibuya N., Tanaka M., Yoshida M., Ogasawara Y., Togawa T., Ishii K., and Kimura H. (2009) 3-Mercaptopyruvate sulfurtransferase produces hydrogen sulfide and bound sulfane sulfur in the brain. Antioxid. Redox. Signal. 11, 703–714 [DOI] [PubMed] [Google Scholar]
- 6. Yadav P. K., Yamada K., Chiku T., Koutmos M., and Banerjee R. (2013) Structure and kinetic analysis of H2S production by human mercaptopyruvate sulfurtransferase. J. Biol. Chem. 288, 20002–20013 [DOI] [PMC free article] [PubMed] [Google Scholar]
- 7. Nicholls P., and Kim J. K. (1982) Sulphide as an inhibitor and electron donor for the cytochrome c oxidase system. Can. J. Biochem. 60, 613–623 [DOI] [PubMed] [Google Scholar]
- 8. Hildebrandt T. M., and Grieshaber M. K. (2008) Three enzymatic activities catalyze the oxidation of sulfide to thiosulfate in mammalian and invertebrate mitochondria. FEBS J. 275, 3352–3361 [DOI] [PubMed] [Google Scholar]
- 9. Mishanina T. V., Yadav P. K., Ballou D. P., and Banerjee R. (2015) Transient kinetic analysis of hydrogen sulfide oxidation catalyzed by human sulfide quinone oxidoreductase. J. Biol. Chem. 290, 25072–25080 [DOI] [PMC free article] [PubMed] [Google Scholar]
- 10. Argyrou A., and Blanchard J. S. (2004) Flavoprotein disulfide reductases: advances in chemistry and function. Prog. Nucleic Acid Res. Mol. Biol. 78, 89–142 [DOI] [PubMed] [Google Scholar]
- 11. Jackson M. R., Melideo S. L., and Jorns M. S. (2012) Human sulfide:quinone oxidoreductase catalyzes the first step in hydrogen sulfide metabolism and produces a sulfane sulfur metabolite. Biochemistry 51, 6804–6815 [DOI] [PubMed] [Google Scholar]
- 12. Libiad M., Yadav P. K., Vitvitsky V., Martinov M., and Banerjee R. (2014) Organization of the human mitochondrial H2S oxidation pathway. J. Biol. Chem. 289, 30901–30910 [DOI] [PMC free article] [PubMed] [Google Scholar]
- 13. Augustyn K. D., Jackson M. R., and Jorns M. S. (2017) Use of tissue metabolite analysis and enzyme kinetics to discriminate between alternate pathways for hydrogen sulfide metabolism. Biochemistry 56, 986–996 [DOI] [PMC free article] [PubMed] [Google Scholar]
- 14. Massey V., Müller F., Feldberg R., Schuman M., Sullivan P. A., Howell L. G., Mayhew S. G., Matthews R. G., and Foust G. P. (1969) The reactivity of flavoproteins with sulfite: possible relevance to the problem of oxygen reactivity. J. Biol. Chem. 244, 3999–4006 [PubMed] [Google Scholar]
- 15. Nowak K., Luniak N., Witt C., Wüstefeld Y., Wachter A., Mendel R. R., and Hänsch R. (2004) Peroxisomal localization of sulfite oxidase separates it from chloroplast-based sulfur assimilation. Plant Cell Physiol. 45, 1889–1894 [DOI] [PubMed] [Google Scholar]
- 16. Johnson-Winters K., Nordstrom A. R., Emesh S., Astashkin A. V., Rajapakshe A., Berry R. E., Tollin G., and Enemark J. H. (2010) Effects of interdomain tether length and flexibility on the kinetics of intramolecular electron transfer in human sulfite oxidase. Biochemistry 49, 1290–1296 [DOI] [PMC free article] [PubMed] [Google Scholar]
- 17. Tiranti V., Viscomi C., Hildebrandt T., Di Meo I., Mineri R., Tiveron C., Levitt M. D., Prelle A., Fagiolari G., Rimoldi M., and Zeviani M. (2009) Loss of ETHE1, a mitochondrial dioxygenase, causes fatal sulfide toxicity in ethylmalonic encephalopathy. Nat. Med. 15, 200–205 [DOI] [PubMed] [Google Scholar]
- 18. Kabil O., and Banerjee R. (2012) Characterization of patient mutations in human persulfide dioxygenase (ETHE1) involved in H2S catabolism. J. Biol. Chem. 287, 44561–44567 [DOI] [PMC free article] [PubMed] [Google Scholar]
- 19. Denisov I. G., Grinkova Y. V., Lazarides A. A., and Sligar S. G. (2004) Directed self-assembly of monodisperse phospholipid bilayer nanodiscs with controlled size. J. Am. Chem. Soc. 126, 3477–3487 [DOI] [PubMed] [Google Scholar]
- 20. Denisov I. G., McLean M. A., Shaw A. W., Grinkova Y. V., and Sligar S. G. (2005) Thermotropic phase transition in soluble nanoscale lipid bilayers. J. Phys. Chem. B 109, 15580–15588 [DOI] [PMC free article] [PubMed] [Google Scholar]
- 21. Bayburt T. H., Grinkova Y. V., and Sligar S. G. (2002) Self-assembly of discoidal phospholipid bilayer nanoparticles with membrane scaffold proteins. Nano Letters 2, 853–856 [Google Scholar]
- 22. Beyer R. E., Burnett B. A., Cartwright K. J., Edington D. W., Falzon M. J., Kreitman K. R., Kuhn T. W., Ramp B. J., Rhee S. Y., and Rosenwasser M. J. (1985) Tissue coenzyme Q (ubiquinone) and protein concentrations over the life span of the laboratory rat. Mech. Ageing Dev. 32, 267–281 [DOI] [PubMed] [Google Scholar]
- 23. Bayburt T. H., and Sligar S. G. (2010) Membrane protein assembly into nanodiscs. FEBS Lett. 584, 1721–1727 [DOI] [PMC free article] [PubMed] [Google Scholar]
- 24. Cuevasanta E., Denicola A., Alvarez B., and Möller M. N. (2012) Solubility and permeation of hydrogen sulfide in lipid membranes. PloS ONE 7, e34562. [DOI] [PMC free article] [PubMed] [Google Scholar]
- 25. Cherney M. M., Zhang Y., Solomonson M., Weiner J. H., and James M. N. (2010) Crystal structure of sulfide:quinone oxidoreductase from Acidithiobacillus ferrooxidans: insights into sulfidotrophic respiration and detoxification. J. Mol. Biol. 398, 292–305 [DOI] [PubMed] [Google Scholar]
- 26. Goubern M., Andriamihaja M., Nübel T., Blachier F., and Bouillaud F. (2007) Sulfide, the first inorganic substrate for human cells. FASEB J. 21, 1699–1706 [DOI] [PubMed] [Google Scholar]
- 27. Togawa T., Ogawa M., Nawata M., Ogasawara Y., Kawanabe K., and Tanabe S. (1992) High performance liquid chromatographic determination of bound sulfide and sulfite and thiosulfate at their low levels in human serum by pre-column fluorescence derivatization with monobromobimane. Chem. Pharm. Bull. 40, 3000–3004 [DOI] [PubMed] [Google Scholar]
- 28. Ji A. J., Savon S. R., and Jacobsen D. W. (1995) Determination of total serum sulfite by HPLC with fluorescence detection. Clin. Chem. 41, 897–903 [PubMed] [Google Scholar]
- 29. Vitvitsky V., Dayal S., Stabler S., Zhou Y., Wang H., Lentz S. R., and Banerjee R. (2004) Perturbations in homocysteine-linked redox homeostasis in a murine model for hyperhomocysteinemia. Am. J. Physiol. Regul. Integr. Comp. Physiol. 287, R39–R46 [DOI] [PubMed] [Google Scholar]
- 30. Vitvitsky V., Martinov M., Ataullakhanov F., Miller R. A., and Banerjee R. (2013) Sulfur-based redox alterations in long-lived Snell dwarf mice. Mech. Ageing Dev. 134, 321–330 [DOI] [PMC free article] [PubMed] [Google Scholar]
- 31. Khersonsky O., and Tawfik D. S. (2010) Enzyme promiscuity: a mechanistic and evolutionary perspective. Annu. Rev. Biochem. 79, 471–505 [DOI] [PubMed] [Google Scholar]
- 32. Banerjee R. (2017) Catalytic promiscuity and heme-dependent redox regulation of H2S synthesis. Curr. Opin. Chem. Biol. 37, 115–121 [DOI] [PMC free article] [PubMed] [Google Scholar]
- 33. Gunnison A. F. (1981) Sulphite toxicity: a critical review of in vitro and in vivo data. Food Cosmet. Toxicol. 19, 667–682 [DOI] [PubMed] [Google Scholar]
- 34. Stammati A., Zanetti C., Pizzoferrato L., Quattrucci E., and Tranquilli G. B. (1992) In vitro model for the evaluation of toxicity and antinutritional effects of sulphites. Food. Addit. Contam. 9, 551–560 [DOI] [PubMed] [Google Scholar]
- 35. Woo W. H., Yang H., Wong K. P., and Halliwell B. (2003) Sulphite oxidase gene expression in human brain and in other human and rat tissues. Biochem. Biophys. Res. Commun. 305, 619–623 [DOI] [PubMed] [Google Scholar]
- 36. Vitvitsky V. M., Garg S. K., Keep R. F., Albin R. L., and Banerjee R. (2012) Na+ and K+ ion imbalances in Alzheimer's disease. Biochim. Biophys. Acta 1822, 1671–1681 [DOI] [PMC free article] [PubMed] [Google Scholar]
- 37. Libiad M., Sriraman A., and Banerjee R. (2015) Polymorphic variants of human rhodanese exhibit differences in thermal stability and sulfur transfer kinetics. J. Biol. Chem. 290, 23579–23588 [DOI] [PMC free article] [PubMed] [Google Scholar]
- 38. Boldog T., Li M., and Hazelbauer G. L. (2007) Using Nanodiscs to create water-soluble transmembrane chemoreceptors inserted in lipid bilayers. Methods Enzymol. 423, 317–335 [DOI] [PubMed] [Google Scholar]


