

Abstract
Enhanced fetal γ-globin synthesis alleviates symptoms of β-globinopathies such as sickle cell disease and β-thalassemia, but current γ-globin–inducing drugs offer limited beneficial effects. We show here that lysine-specific demethylase 1 (LSD1) inhibition by RNAi in human erythroid cells or by the monoamine oxidase inhibitor tranylcypromine in human erythroid cells or β-type globin–transgenic mice enhances γ-globin expression. LSD1 is thus a promising therapeutic target for γ-globin induction, and tranylcypromine may serve as a lead compound for the development of a new γ-globin inducer.
β-globinopathies such as sickle cell disease and β-thalassemia arise from genetic defects in the synthesis of the adult hemoglobin β chain (in HbA; α2β2). Elevated synthesis of fetal hemoglobin (HbF; α2γ2), which contains the γ chain instead of β, reduces morbidity of β-globinopathies1. γ-globin inducers such as hydroxyurea and decitabine have been used to treat β-globinopathies, but they show long-term benefit in only fewer than half of compliant patients1. These drugs are antineoplastic agents that can cause deleterious effects such as bone marrow suppression and reproductive toxicity. Therefore, finding more effective and safer γ-globin inducers is desirable.
Because the nuclear receptors TR2 and TR4 repress the γ-globin–encoding genes2,3, the signaling pathways that these receptors regulate could be a therapeutic target for γ-globin induction. TR2 and TR4 associate with co-repressors, including DNA methyl-transferase I (DNMT1) and LSD1, as components of a core heterotetrameric complex4. LSD1 removes methyl groups from mono- and dimethyl histone H3 lysine 4 (H3K4)5, an activating epigenetic signature. To investigate a possible role for LSD1 in globin gene regulation, we examined the association of LSD1 with the gene promoters of β-type globins in human erythroid cells differentiated ex vivo from CD34+ progenitors. Cells appeared to be proerythroblasts after 8 d in culture (Fig. 1a), and after 14 d 26% of the cells had undergone enucleation. We confirmed erythroid differentiation by flow cytometry (Supplementary Fig. 1a). LSD1 protein was expressed at comparable levels throughout differentiation (Fig. 1b). TR2 and TR4 bound the gene promoters of embryonic ε- and fetal γ-globins, but not to the promoter of the gene encoding adult β-globin (in accordance with the lack of their binding motifs therein; Supplementary Fig. 2)2,3. In contrast, LSD1 was detected at all three promoters in differentiating erythroid cells (Fig. 1c), which is not surprising given that LSD1 can bind multiple transcription factors4,6,7. As the cells differentiated, LSD1 binding to all three promoters diminished.
Figure 1.
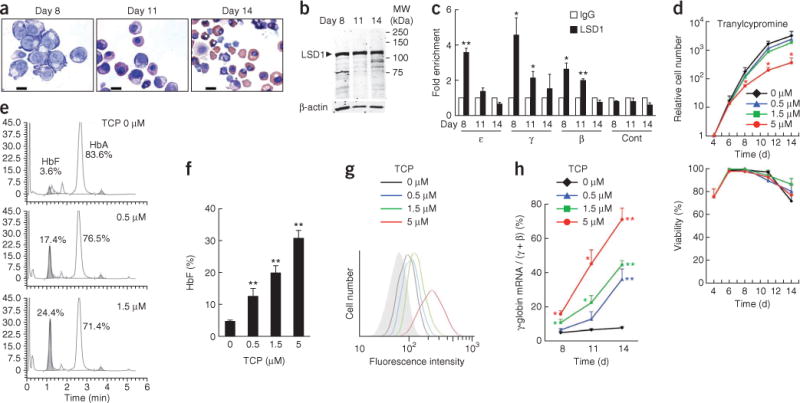
Induction of fetal hemoglobin by an LSD1 inhibitor, TCP, in adult erythroid cells. (a) Morphology of primary human erythroid cells differentiated ex vivo from CD34+ progenitor cells at the indicated times of cell culture. Scale bars, 10 μm. (b) Immunoblot showing LSD1 and β-actin (loading control) abundance in differentiating human erythroid cells. (c) ChIP assay examining LSD1 binding to the gene promoters of embryonic ε-, fetal γ- and adult β-globins after 8, 11 or 14 d of differentiation from CD34+ cells. The abundance of DNA precipitated with an LSD1-specific antibody was normalized to that precipitated with control IgG. As a negative control (Cont), an intergenic region between the ε- and Gγ-globin–encoding genes was used. n = 2 independent immunoprecipitations. (d) Proliferation and viability of differentiating erythroid cells exposed to the indicated concentrations of TCP. n = 3 independent experiments. (e) Representative HPLC chromatograms showing HbF abundance (shaded area) in TCP-treated and untreated human erythroid cells 14 d after differentiation induction. Numbers indicate the percentages of HbF and HbA in total hemoglobin. The y axis represents the abundance of hemoglobin in the elution in an arbitrary unit. (f) Average HbF percentages in total hemoglobin, determined by HPLC, in TCP-treated and untreated human erythroid cells on day 14. n = 3–5 independent experiments. (g) Flow-cytometric analysis of HbF synthesis in TCP-treated and untreated cells on day 14 (colored lines). The shaded area indicates staining with control IgG. (h) Relative γ-globin mRNA abundance normalized to total β-type globin mRNAs (fetal γ- plus adult β-globin) in TCP-treated and untreated cells. n = 3 independent experiments. Statistically significant differences between the LSD1-specific antibody and control IgG (c) or between TCP-treated and untreated cells (d,f,h) are indicated (*P < 0.05; **P < 0.01). Error bars represent s.e.m.
Tranylcypromine (TCP), a monoamine oxidase inhibitor that has been used clinically as an antidepressant since 1960, inhibits LSD1 with a half-maximum inhibitory concentration of ~2 μM (ref. 8). To investigate a possible role for LSD1 in γ-globin regulation, we examined the effects of TCP on human erythroid cells differentiated ex vivo. TCP administration at 0.5 or 1.5 μM did not alter cell proliferation or viability, but 5 μM TCP reduced cell proliferation and delayed differentiation without affecting cell viability (Fig. 1d and Supplementary Fig. 1b). HbF synthesis, detected by HPLC, was enhanced by TCP from 4.6% of total hemoglobin to 31% (Fig. 1e,f). Flow-cytometric analysis showed that HbF was induced in all of the cells in a dose-dependent manner (Fig. 1g), and γ-globin mRNA expression was induced up to 9.4-fold (Fig. 1h). These results suggest that LSD1 has a crucial role in γ-globin silencing in adult erythroid cells and that TCP might be used to treat β-globinopathies, as the effective concentration for HbF induction is within the therapeutic plasma concentration in treated depressed patients9.
To quantify global H3K4 dimethylation (H3K4me2), an activating epigenetic signature, we subjected cell extracts to immunoblotting with antibodies to total histone H3 or H3K4me2. Global H3K4me2 increased during erythroid differentiation (Supplementary Fig. 3a), and TCP administration further enhanced global H3K4me2, confirming the inhibitory effect of TCP on LSD1 activity (Supplementary Fig. 3b).
To assess whether LSD1 inhibition might account for the observed HbF induction, we examined the effect of TCP on H3K4me2 abundance at each β-type globin promoter by chromatin immunoprecipitation (ChIP). In immature erythroid cells (day 8), H3K4me2 was undetectable, but in more mature cells (on days 11 and 14), H3K4me2 accumulated at all three promoters (Supplementary Fig. 3c), presumably owing to dissociation of LSD1 from these promoters over this time course (Fig. 1c). TCP treatment resulted in statistically significant enhancement of H3K4me2 accumulation at the γ-globin promoter (Fig. 2a), but not at the β-globin promoter, indicating that one possible mechanism for γ-globin induction by TCP is H3K4me2 accumulation at its promoter through LSD1 inhibition.
Figure 2.
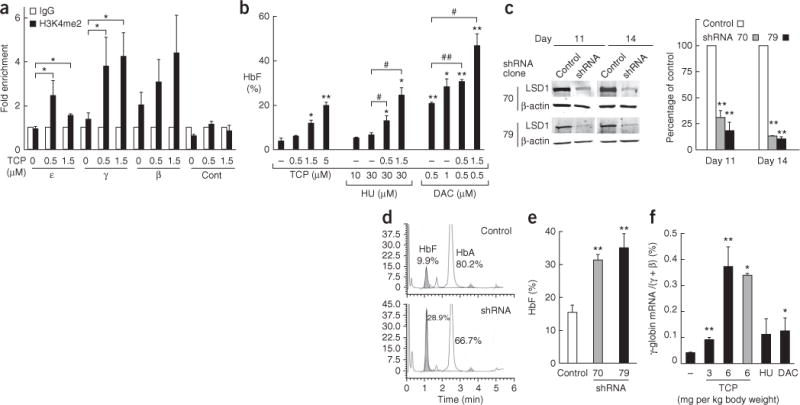
Induction of γ-globin expression by LSD1 inhibition. (a) ChIP assay showing H3K4me2 accumulation induced by TCP on the fetal γ-globin promoter on day 11 of human CD34+ cell differentiation. The abundance of DNA precipitated with an H3K4me2-specific antibody is normalized to that precipitated with control IgG. A negative control (Cont) was used as in Figure 1c. n = 4 independent immunoprecipitations. (b) Effects of TCP, hydroxyurea (HU) and decitabine (DAC) either as single agents or in combination on HbF synthesis, as examined in differentiating human erythroid cells. HbF was measured by HPLC on day 14. Statistically significant differences between cells treated with hydroxyurea or decitabine alone and cells treated additionally with TCP are indicated (#P < 0.05; ##P < 0.01). n = 2 independent experiments. (c) Immunoblots showing LSD1 and β-actin (internal control) in shRNA virus–or control virus–infected cells. Two different shRNA clones (70 and 79) targeting different segments of LSD1 mRNA were used. The bar graph shows the relative abundance of LSD1 normalized to β-actin and to control cells. n = 3 independent experiments. (d) HPLC chromatograms showing HbF abundance in LSD1 shRNA (clone 70) virus–or control virus–infected cells. The y axis represents the abundance of hemoglobin in the elution in an arbitrary unit. (e) Average HbF abundance, determined by HPLC, in LSD1 shRNA virus–or control virus–infected cells. (f) γ-globin mRNA abundance, normalized to total β-type globin mRNAs, in bone marrow cells of β-YAC mice injected with TCP at 3 or 6 mg per kg body weight per day or saline 5 d a week for 4 weeks. A subset of mice injected with TCP (6 mg per kg body weight) for 4 weeks were analyzed 18 d after cessation of drug administration (gray bar). For comparison, mice were treated with hydroxyurea (200 mg per kg body weight per day, 5 d a week for 4 weeks) or decitabine (5 mg per kg body weight per day for 5 d) to examine their individual inductive effects14,15. n = 6 mice for the control group, n = 3 mice for the TCP 3 mg per kg body weight group, n = 4 mice for all other groups. Statistically significant differences between drug-treated and untreated cells (a,b), between shRNA virus–and control virus–infected cells (c,e), or between drug-injected and control mice (f) are indicated (*P < 0.05; **P < 0.01). Error bars represent s.e.m.
We also examined the β-type globin promoters for two repressive regulatory marks: DNMT1 association and H3K9 dimethylation (H3K9me2). DNMT1 is another co-repressor bound by TR2 and TR4, and is presumably also involved in γ-globin silencing4. DNMT1 may be involved in γ-globin induction by TCP, as LSD1 can demethylate and thereby stabilize DNMT1 (ref. 10). H3K9me2 is an epigenetic signature implicated in transcriptional silencing and heterochromatin formation. We detected both DNMT1 association and H3K9me2 accumulation at the γ-globin promoter, and both diminished upon TCP administration (Supplementary Fig. 4), suggesting additional indirect mechanisms for γ-globin induction by TCP. Specific activation of γ-globin transcription (unaccompanied by β-globin induction) by TCP thus seems to be a consequence of the combination of H3K4me2 gain, DNMT1 loss and H3K9me2 loss at the γ-globin promoter. Possible roles for TR2 and TR4 in γ-globin induction by TCP were not further investigated.
When tested alongside other HbF inducers, the effect of TCP was far superior to hydroxyurea, and roughly equivalent to decitabine at their respective optimal concentrations for primary human erythroid cells11,12 (Fig. 2b). We next asked whether TCP can augment HbF induction by hydroxyurea or decitabine, anticipating that their combinatorial use might achieve a higher HbF level that would not be attainable with these single agents without cytotoxicity. The combination of TCP and decitabine had a greater than additive effect, resulting in almost 50% HbF accumulation in differentiating erythroid cells, whereas the combination of TCP and hydroxyurea was less effective (Fig. 2b and Supplementary Table 1).
To further explore the role of LSD1 in γ-globin silencing and address the mechanism for γ-globin induction by TCP, we examined the effect of LSD1 knockdown on γ-globin synthesis. We infected primary erythroid cells with lentivirus expressing either of two shRNAs targeting LSD1. Infection with either virus significantly reduced LSD1 mRNA and protein abundance as compared to a control virus (Fig. 2c and Supplementary Fig. 5). LSD1 knockdown resulted in enhanced HbF and γ-globin mRNA synthesis (Fig. 2d,e and Supplementary Fig. 5). These results validate the role of LSD1 in γ-globin silencing and are consistent with the concept that TCP induces γ-globin synthesis through LSD1 inhibition.
To examine possible global effects of TCP on erythroid gene expression, we conducted microarray analyses after 8 d of differentiation and detected a small number of transcripts whose level of expression was altered after TCP treatment, suggesting that only a few early erythroid genes are regulated by LSD1 (Supplementary Figs. 6, 7 and Supplementary Table 2). Gene ontology terms associated with the greatest changes in gene expression after TCP treatment (Supplementary Table 3) did not allow for a simple interpretation of how TCP treatment has effects specifically on γ-globin accumulation.
Finally, we tested the effects of TCP on γ-globin gene expression in transgenic mice harboring a yeast artificial chromosome containing the human β-type globin locus (β-YAC mice)3. In mice, the genes encoding human fetal γ-globin behave essentially as an embryonic gene and are strongly silenced in adults3,13. We administered TCP at two different doses (3 or 6 mg per kg body weight per day, 5 d a week) for 4 weeks. Expression of the human γ-globin–encoding genes in bone marrow cells was induced by TCP in a dose-dependent manner up to ninefold as compared to untreated mice (Fig. 2f). Furthermore, the effect of TCP was sustained for at least 18 d after cessation of drug injection (Fig. 2f). γ-globin induction by TCP exceeded the efficacy achieved by hydroxyurea or decitabine when these agents were used at their published optimal doses in the β-YAC mice (Fig. 2f), or as compared to their efficacy in other mouse models14,15. Induced expression of the genes encoding human γ-globin as well as those encoding endogenous mouse embryonic β-type globins by TCP injection was observed in FACS-sorted, stage-matched erythroid progenitors from the bone marrow (Supplementary Fig. 8). After administration of TCP to the β-YAC mice, we did not observe any toxic effects or significant changes in blood cell counts (Supplementary Table 4) or hematopoietic precursor populations (Supplementary Fig. 9).
Several transcriptional repressors for the γ-globin–encoding genes have been identified recently13,15–17, but the absence of pharmacological inhibitors for these repressors poses considerable challenges to the therapeutic application of those findings. In contrast, targets of current HbF-inducing medications have not been identified, greatly impeding efforts to improve their safety or efficacy. This study demonstrates that LSD1 plays a crucial role in fetal γ-globin silencing and that an LSD1 inhibitor, TCP, can enhance HbF synthesis. TCP has been widely used as an antidepressant with manageable side effects; it exerts its antidepressive effect by elevating serotonin levels18 and does not seem to have cytotoxic or mutagenic effects. Although it was recently reported that LSD1 inhibition by RNAi in mice can cause hematopoietic defects19, hematological toxicity has not been associated with TCP in humans except in rare cases of transient thrombocytopenia attributable to overdosing20. TCP may thus serve as a lead compound for developing a new HbF-inducing medication that is complementary to, or more favorable than, current medications.
METHODS
Methods and any associated references are available in the online version of the paper.
ONLINE METHODS
Ex vivo differentiation of purified human CD34+ cells
We purchased cryopreserved vials of purified human CD34+ hematopoietic progenitor cells from the Fred Hutchinson Cancer Research Center, which collected the cells from healthy volunteers in full compliance with federal and institutional regulations on informed consent and confidentiality. The CD34+ cells were isolated from the peripheral blood after mobilization by administration of granulocyte colony–stimulating factor (G-CSF). We grew and differentiated the cells ex vivo into the erythroid lineage in 14 d by a two-phase culture method described previously4,21. Cell number and viability were determined with a hemocytometer by trypan blue staining. Cell morphology was examined by Wright-Giemsa staining (Sigma-Aldrich) of cytospins. For cell proliferation and viability analysis, data from three biological replicates are presented.
Drug treatment of differentiating primary human erythroid cells
Tranylcypromine (TCP; Tocris Bioscience) dissolved in water at 50 mM was added to the culture medium at final concentrations of 0.5, 1.5 or 5 μM on days 4–14 of the differentiation culture. Hydroxyurea (HU; Sigma-Aldrich) was added to the culture medium at final concentrations of 10 or 30 μM on days 4–14 of the culture. Decitabine (DAC; Sigma-Aldrich) was added to the culture medium at final concentrations of 0.5 or 1 μM on days 7–14 of the culture. In some experiments, either hydroxyurea or decitabine was administered in combination with TCP. Every 2–3 d, culture media were replaced with media containing freshly added drugs.
Flow cytometry and cell sorting
For cell surface marker analysis, the indicated amounts of antibodies were used to stain 106 cells suspended in 100 μL PBS with 2% FBS. Human erythroid cells were stained with phycoerythrin (PE)-Cy7–conjugated CD34-specific (eBioscience, 25-0349, 0.125 μg), PE-conjugated CD71-specific (eBioscience, 12-0719, 0.03 μg), or PE-Cy5–conjugated glycophorin A–specific (BD Biosciences, 559944, 0.015 μg) antibody. Mouse bone marrow cells were stained with allophycocyanin (APC)-conjugated Ter-119–specific (BioLegend, 116212, 0.5 μg), PE-conjugated CD71-specific (BioLegend, 113808, 0.5 μg), PE-Cy5–conjugated Mac-1–specific (eBioscience, 15-0112-81, 0.5 μg), APC-conjugated Gr-1–specific (BioLegend, 108411, 0.5 μg) or PE-conjugated CD41-specific (eBioscience, 12-0411-81, 0.5 μg) antibody. For cytoplasmic HbF analysis, 105 cells were fixed in 0.05% glutaraldehyde for 10 min, permeabilized in 0.1% Triton X-100 for 5 min and then stained with 5 μL of an APC-conjugated HbF-specific antibody (Invitrogen, MHFH05) in 80 μL of PBS with 0.1% BSA. Stained cells were analyzed using a FACSCanto II (BD Biosciences) or sorted on a FACSAria I (BD Biosciences). Fractional percentages of cell populations represent the averages of two to four biological replicates.
Immunoblotting
Cells were lysed in Laemmli sample buffer and subjected to SDS-PAGE. Proteins were then transferred to a nitrocellulose membrane (Li-Cor) and probed with antibodies to LSD1 (Abcam, ab17721, 1:1,000 dilution), total histone H3 (Abcam, ab1791, 1:20,000 dilution) or dimethyl histone H3 Lysine 4 (H3K4me2) (Abcam, ab11946, 1:5,000 dilution), and fluorescence-conjugated secondary antibodies (Li-Cor). Proteins were visualized and quantified with the Odyssey Infrared Imaging System (Li-Cor). Quantification data represent the results of three or four biological replicates.
ChIP assays
Chromatin immunoprecipitation (ChIP) was performed as described previously using 106 cells for each assay4. For TR2, TR4 and LSD1 binding, ethylene glycol bis(succinimidyl succinate) was used as a cross-linker in addition to formaldehyde. Ten micrograms of antibodies to TR2 and TR4 (ref. 3), LSD1 (Abcam, ab17721), H3K4me2 (Millipore, 05-1338), dimethyl histone H3 Lysine 9 (H3K9me2) (Abcam, ab1220), or DNMT1 (Abcam, ab92453) were used for immune complex formation in 500 μL of immunoprecipitation dilution buffer4. Precipitated DNA was quantified by real-time quantitative PCR assay with primer pairs for human embryonic ε-, fetal γ- and adult β-globin promoter sequences4, as well as a primer pair for an intergenic region between the ε- and Gγ-globin genes used as a negative control (5′-TCC CACTCTGTGGGTTGTCTGTTT-3′ and 5′-CCCTTCTACACATTGGCTTA GGAAAGG-3′). Data representative of two to four independent immunoprecipitations are presented.
Hemoglobin analysis by HPLC
Cells were lysed and analyzed for hemoglobin composition using the Bio-Rad Variant II Hemoglobin Testing System equipped with an ion-exchange HPLC column (Hercules). Data of three to five biological replicates are presented.
RT-qPCR assay
mRNAs for human and mouse β-type globins, human LSD1, and 16 other human genes that were selected for validation of the microarray analysis, as well as 18S rRNA, were quantified by reverse transcription and quantitative real-time PCR (RT-qPCR) assay as described previously4. Relative abundance of human fetal γ- or mouse embryonic εy- and βH1-globin mRNAs was determined using the respective human or mouse adult β-globin mRNA as an internal control, based on threshold cycle (Ct) values and the experimentally determined amplification efficiency for each primer pair. Relative mRNA abundance for LSD1 and all other mRNAs was similarly determined, using 18S rRNA as an internal control. For gene expression analysis with primary human erythroid cells, results of three biological replicates are presented. All the primer pairs except for 18S rRNA were designed to span introns. Primer sequences are as follows: human γ-globin, 5′-GATGCCATAAAGCACCTGGATG-3′ and 5′-TTGCAGAATAAAGCCTATCCTTGA-3′; human β-globin, 5′- AACTG TGTTCACTAGCAACCTCAA-3′ and 5′- GAGTGGACAGATCCCCAAA GGA-3′; LSD1, 5′-TGGCCATTCTCAAAGGGATT-3′ and 5′-CAGCACGCC AACGAGACA-3′; and 18S rRNA, 5′-ACCGCAGCTAGGAATAATGGA-3′ and 5′-GCCTCAGTTCCGAAAACCA-3′. Primer sequences for mouse β-type glob-ins were previously published4. Sequences for all other primers will be provided upon request.
Expression of LSD1 shRNAs by lentiviral vector
The pLKO.1-puro lentiviral vectors used to express LSD1 shRNAs (short hairpin RNAs) and the puromycin resistance gene were purchased from Sigma-Aldrich (TRCN0000046070 and TRCN0000382379). The control vector was generated by deleting a segment (between EcoRI and NdeI sites) with the hairpin sequence from the shRNA vector. Lentiviruses were generated by transient transfection of the vectors into a packaging cell line. For infection, cells were exposed to virus on day 4 of culture for 24 h and then to 1 μg ml−1 puromycin on days 6–14 to select for infected cells.
Drug administration to mice
All animal experiments were approved by the University Committee on Use and Care of Animals at the University of Michigan. TCP, hydroxyurea, or decitabine dissolved in saline was administered to 7- to 19-week-old transgenic mice harboring a yeast artificial chromosome containing the intact human β-type globin locus (β-YAC mice)3. TCP was administered by subcutaneous injection at a dose of 3, 6 or 10 mg per kg body weight per day, 5 d a week for 4 weeks. Hydroxyurea was administered by intraperitoneal injection at a dose of 200 mg per kg body weight per day, 5 d a week for 4 weeks. Decitabine was administered by subcutaneous injection at a dose of 5 mg per kg body weight per day for 5 d. Control mice were injected with saline only. Following the stated periods of injections, bone marrow cells were harvested for flow- cytometric analysis, cell sorting or RT-qPCR analysis for gene expression of human or mouse globins. For gene expression analysis of human γ-globin in unfractionated bone marrow cells, 11 male and 14 female mice were used, and data from three to six mice are presented for each experimental condition. For flow-cytometric analysis and sorting of bone marrow cells, three males and one female were used. For analysis of hematological parameters of peripheral blood, four males and three females were used.
Microarray analysis
Total RNA was extracted from primary human erythroid cells after 8 days of ex vivo differentiation from CD34+ cells with or without TCP treatment (0.5 μM, 1.5 μM or 5 μM). The integrity of RNA samples was verified on the Bioanalyzer (Agilent). The microarray experiments were performed using the Human Genome U219 Array Strip (Affymetrix) with the GeneAtlas 3′ IVT Express Kit. Gene expression values were calculated with the Robust Multi-array Average algorithm22.
Statistical analysis
Student’s t-test was used for all the statistical analyses. Error bars represent s.e.m.
Supplementary Material
Acknowledgments
This work was supported by US National Institutes of Health grants DK086956 (to O.T. and J.D.E.) and HL24415 (to J.D.E.) and an American Heart Association postdoctoral fellowship to L.S. We thank D. Giacherio and D. Harro for hemoglobin HPLC analysis; C. Yu, A.D. Campbell, K.C. Lim, T. Hosoya, B. Godfrey and M. Sierant for discussions, comments and technical assistance; and D. Lavelle and J. DeSimone for discussions regarding the inductive properties of decitabine. Lentiviruses were produced by the University of Michigan Vector Core. Microarray analysis was performed at the University of Michigan Microarray Core.
Footnotes
Accession codes
Microarray data were deposited in the Gene Expression Omnibus (GEO) database with accession number GSE42078.
Note: Supplementary information is available in the online version of the paper.
AUTHOR CONTRIBUTIONS
O.T. and J.D.E. conceived of the study; L.S., S.C., J.D.E. and O.T. designed experiments. L.S. and S.C. performed experiments. L.S., S.C., J.D.E. and O.T. analyzed data and wrote the paper.
COMPETING FINANCIAL INTERESTS
The authors declare no competing financial interests.
References
- 1.Testa U. Ann Hematol. 2009;88:505–528. doi: 10.1007/s00277-008-0637-y. [DOI] [PubMed] [Google Scholar]
- 2.Tanabe O, et al. EMBO J. 2002;21:3434–3442. doi: 10.1093/emboj/cdf340. [DOI] [PMC free article] [PubMed] [Google Scholar]
- 3.Tanabe O, et al. EMBO J. 2007;26:2295–2306. doi: 10.1038/sj.emboj.7601676. [DOI] [PMC free article] [PubMed] [Google Scholar]
- 4.Cui S, et al. Mol Cell Biol. 2011;31:3298–3311. doi: 10.1128/MCB.05310-11. [DOI] [PMC free article] [PubMed] [Google Scholar]
- 5.Shi Y, et al. Cell. 2004;119:941–953. doi: 10.1016/j.cell.2004.12.012. [DOI] [PubMed] [Google Scholar]
- 6.Hu X, et al. Proc Natl Acad Sci USA. 2009;106:10141–10146. doi: 10.1073/pnas.0900437106. [DOI] [PMC free article] [PubMed] [Google Scholar]
- 7.Saleque S, Kim J, Rooke HM, Orkin SH. Mol Cell. 2007;27:562–572. doi: 10.1016/j.molcel.2007.06.039. [DOI] [PubMed] [Google Scholar]
- 8.Lee MG, Wynder C, Schmidt DM, McCafferty DG, Shiekhattar R. Chem Biol. 2006;13:563–567. doi: 10.1016/j.chembiol.2006.05.004. [DOI] [PubMed] [Google Scholar]
- 9.Mallinger AG, Smith E. Psychopharmacol Bull. 1991;27:493–502. [PubMed] [Google Scholar]
- 10.Wang J, et al. Nat Genet. 2009;41:125–129. doi: 10.1038/ng.268. [DOI] [PubMed] [Google Scholar]
- 11.Moutouh-de Parseval LA, et al. J Clin Invest. 2008;118:248–258. doi: 10.1172/JCI32322. [DOI] [PMC free article] [PubMed] [Google Scholar]
- 12.Banzon V, et al. Exp Hematol. 2011;39:26–36.e1. doi: 10.1016/j.exphem.2010.10.003. [DOI] [PMC free article] [PubMed] [Google Scholar]
- 13.Sankaran VG, et al. Nature. 2009;460:1093–1097. doi: 10.1038/nature08243. [DOI] [PMC free article] [PubMed] [Google Scholar]
- 14.Buller AM, Elford HL, DuBois CC, Meyer J, Lloyd JA. Blood Cells Mol Dis. 1999;25:255–269. doi: 10.1006/bcmd.1999.0252. [DOI] [PubMed] [Google Scholar]
- 15.Xu J, et al. Science. 2011;334:993–996. doi: 10.1126/science.1211053. [DOI] [PMC free article] [PubMed] [Google Scholar]
- 16.Menzel S, et al. Nat Genet. 2007;39:1197–1199. doi: 10.1038/ng2108. [DOI] [PubMed] [Google Scholar]
- 17.Wilber A, Nienhuis AW, Persons DA. Blood. 2011;117:3945–3953. doi: 10.1182/blood-2010-11-316893. [DOI] [PMC free article] [PubMed] [Google Scholar]
- 18.Frieling H, Bleich S. Eur Arch Psychiatry Clin Neurosci. 2006;256:268–273. doi: 10.1007/s00406-006-0660-8. [DOI] [PubMed] [Google Scholar]
- 19.Sprüssel A, et al. Leukemia. 2012;26:2039–2051. doi: 10.1038/leu.2012.157. [DOI] [PubMed] [Google Scholar]
- 20.Eyer F, Jetzinger E, Pfab R, Zilker T. Clin Toxicol (Phila) 2008;46:261–263. doi: 10.1080/15563650601118085. [DOI] [PubMed] [Google Scholar]
- 21.Giarratana MC, et al. Nat Biotechnol. 2005;23:69–74. doi: 10.1038/nbt1047. [DOI] [PubMed] [Google Scholar]
- 22.Irizarry RA, et al. Biostatistics. 2003;4:249–264. doi: 10.1093/biostatistics/4.2.249. [DOI] [PubMed] [Google Scholar]
Associated Data
This section collects any data citations, data availability statements, or supplementary materials included in this article.