

Abstract
Flexible decision-making, a defining feature of human cognition, is typically thought of as a canonical pFC function. Recent work suggests that the striatum may participate as well; however, its role in this process is not well understood. We recorded activity of neurons in both the ventral (VS) and dorsal (DS) striatum while rhesus macaques performed a version of the Wisconsin Card Sorting Test, a classic test of flexibility. Our version of the task involved a trial-and-error phase before monkeys could identify the correct rule on each block. We observed changes in firing rate in both regions when monkeys switched rules. Specifically, VS neurons demonstrated switch-related activity early in the trial-and-error period when the rule needed to be updated, and a portion of these neurons signaled information about the switch context (i.e., whether the switch was intradimensional or extradimensional). Neurons in both VS and DS demonstrated switch-related activity at the end of the trial-and-error period, immediately before the rule was fully established and maintained, but these signals did not carry any information about switch context. We also observed associative learning signals (i.e., specific responses to options associated with rewards in the presentation period before choice) that followed the same pattern as switch signals (early in VS, later in DS). Taken together, these results endorse the idea that the striatum participates directly in cognitive set reconfiguration and suggest that single neurons in the striatum may contribute to a functional handoff from the VS to the DS during reconfiguration processes.
INTRODUCTION
Many of the decisions we make on a daily basis are routine. When driving to work, for example, most people take the same route every day. However, if faced with a construction detour, we can no longer follow the previously maintained set of directions. Instead, we must develop a new mental set of directions, switch our behavior based on this set of directions, and then maintain it. This process of mental adjustment is often referred to as cognitive set reconfiguration (alternatively referred to as attentional set shifting) and is a primary component of healthy human cognition. However, the neural mechanisms underlying this process are not well understood.
Cognitive set reconfiguration is typically associated with pFC function (Kamigaki, Fukushima, Tamura, & Miyashita, 2012; Sawada et al., 2012; Buckley et al., 2009; Mansouri, Matsumoto, & Tanaka, 2006; Konishi, Jimura, Asari, & Miyashita, 2003; Nakahara, 2002; Omori et al., 1999; Konishi et al., 1998; Dias, Robbins, & Roberts, 1996; Milner, 1963, 1982). In contrast, the striatum has often been implicated in simpler functions, such as responding to rewards, reinforcement learning, and the establishment and maintenance of habits (Tricomi, Balleine, & University of Rochester O’Doherty, 2009; Graybiel, 2008; Balleine, Delgado, & Hikosaka, 2007; Delgado, 2007; Yin & Knowlton, 2006; Pagnoni, Zink, Montague, & Berns, 2002; Delgado, Nystrom, Fissell, Noll, & Fiez, 2000; Jog, 1999; Schultz, Apicella, Scarnati, & Ljungberg, 1992; Apicella, Ljungberg, Scarnati, & Schultz, 1991). Nonetheless, a small but growing body of work suggests that the striatum may contribute to higher-order cognitive functions as well. Recent work, for example, demonstrates a role for the ventral striatum (VS) in the updating of internal representations of task requirements, even in the absence of reward or feedback (Hampshire et al., 2016), and a role as a “working memory gate” in which the VS filters task-relevant and task-irrelevant information during working memory processes (Hazy, Frank, & O’Reilly, 2007; O’Reilly & Frank, 2006). Moreover, some research suggests that both the VS and the dorsal striatum (DS) may contribute to cognitive set reconfiguration but may play somewhat different roles. For example, inactivation of the VS in rodents (specifically the core region of the nucleus accumbens) impairs both the acquisition and maintenance of new strategies (Floresco, Ghods-Sharifi, Vexelman, & Magyar, 2006), whereas inactivation of the DS impairs only the maintenance of new strategies (Ragozzino, Ragozzino, Mizumori, & Kesner, 2002). Taken together, these studies suggest that, whereas the VS may contribute to cognitive set reconfiguration by forming and maintaining task requirements, the DS may contribute primarily during the maintenance phase, after task requirements have been determined.
Although these studies implicate the VS and DS in cognitive set reconfiguration, direct single neuron evidence is lacking. Such evidence is important because it is possible that other measures may be a consequence of aggregated activity. On the basis of the possible role of the striatum in gating processes (Hazy et al., 2007; O’Reilly & Frank, 2006) and the potential presence of “switch neurons” in the brain (i.e., neurons or groups of neurons, which may gate neural activity to mediate flexible behavior; Vassiliades & Christodoulou, 2016), we hypothesized that single neurons within the VS and DS might exhibit overt switch signals (a modulation of neural activity after changes in task requirements) and that these neurons may carry information about task context, similar to those that have been found in the cortex (Kamigaki, Fukushima, & Miyashita, 2009). On the basis of rodent inactivation studies (Floresco et al., 2006; Ragozzino et al., 2002), we also hypothesized that switch signals might arise in the VS during the updating of task representations and in the DS when task-relevant actions are executed and maintained. To test these hypotheses, we used a version of the Wisconsin Card Sorting Task (WCST) in which subjects actively sample from the environment to determine the correct one of six rules after a rule switch and recorded single VS and DS neurons while two rhesus macaques performed the task.
METHODS
Surgical Procedures
All animal procedures were approved by the University Committee on Animal Resources at the University of Rochester and were designed and conducted in compliance with the Public Health Service’s Guide for the Care and Use of Animals. Two male rhesus macaques (Macaca mulatta) served as subjects. We used standard electrophysiological techniques as described previously (Strait, Blanchard, & Hayden, 2014).
A small prosthesis for holding the head was used. Animals were habituated to laboratory conditions and then trained to perform oculomotor tasks for liquid reward. A Cilux recording chamber (Crist Instruments) was placed over the striatum. Position was verified by MRI with the aid of a Brainsight system (Rogue Research, Inc.). Animals received appropriate analgesics and antibiotics after all procedures. Throughout both behavioral and physiological recording sessions, the chamber was kept sterile with regular antibiotic washes and sealed with sterile caps.
Recording Sites
We approached VS and DS through a standard recording grid (Crist Instruments). We defined VS as lying within the coronal planes situated between 28.02 and 20.66 mm rostral to interaural plane, the horizontal planes situated between 0 and 8.01 mm from the ventral surface of striatum, and the sagittal planes between 0 and 8.69 mm from the medial wall. We defined the DS as the regions of striatum dorsal to the VS within the same coronal planes (Figure 1C). Our recordings were made from a central region within these zones. We confirmed recording location before each recording session using our Brainsight system with structural MRIs taken before the experiment. Neuro-imaging was performed at the Rochester Center for Brain Imaging, on a Siemens 3-T MAGNETOM Trio Tim using 0.5-mm voxels. We confirmed recording locations by listening for characteristic sounds of white and gray matter during recording, which in all cases matched the loci indicated by the Brainsight system. The Brainsight system typically offers an error of < 1 mm in the horizontal plane and <2 mm in the z direction.
Figure 1.
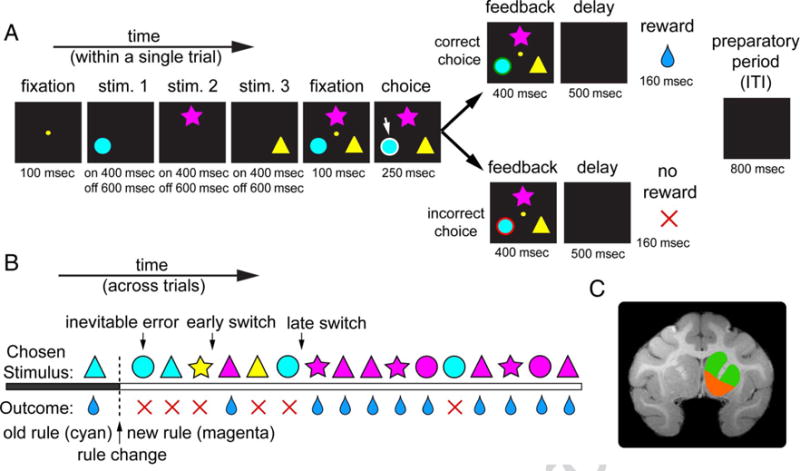
Task and recording locations. (A) Timeline of WCST. Three colored shape stimuli were presented in sequence and then simultaneously; monkeys reacquired central fixation and then chose one stimulus with a saccade. Correct choices yielded a green outline followed by a reward. Incorrect choices yielded a red outline followed by no reward. Between each trial, there was an 800-msec ITI, which we call the preparatory period. (B) Example block. In this example, the correct rule is magenta. Early switch trials are defined as the postfeedback period after an error and immediately before the first correct trial of the block. Late switch trials are defined as the postfeedback period after an error and immediately before the first correct trial in a series of at least four consecutively correct trials. Nonswitch trials are defined as all trials other than early or late switch trials. (C) MRI of Monkey C. Recordings were made in VS (highlighted in orange) and DS (highlighted in green). Details of recording site are given in the Methods section. Stim. = stimulus.
Electrophysiological Techniques
Single electrodes (Frederick Haer & Co.; impedance range = 0.8–4 MΩ) were lowered using a microdrive (NAN Instruments) until waveforms between one and three neuron (s) were isolated. Individual action potentials were isolated on a Plexon system (Plexon Inc., Dallas, TX). Neurons were selected for study solely on the basis of the quality of isolation; we never preselected based on task-related response properties.
We recorded activity during this task from 307 striatal neurons, 103 in the VS (47 from Monkey B and 56 from Monkey C) and 204 in the DS (77 from Monkey B and 127 from Monkey C).
Eye Tracking and Reward Delivery
Eye position was sampled at 1000 Hz by an infrared eye-monitoring camera system (SR Research). Stimuli were controlled by a computer running MATLAB (The MathWorks, Natick, MA) with Psychtoolbox and Eyelink Toolbox. Visual stimuli were presented on a computer monitor placed 57 cm from the animal and centered on its eyes. A standard solenoid valve controlled the duration of juice delivery. The relationship between solenoid open time and juice volume was established and confirmed before, during, and after recording.
Behavioral Task
Monkeys performed an analog of the WCST based on that developed by Moore, Killiany, Herndon, Rosene, and Moss (2005). This task uses stimuli that are nearly identical to those commonly used in human versions of the WCST, with two dimensions (color and shape) and six specific rules (three shapes: circle, star, and triangle; three colors: cyan, magenta, and yellow; Figure 1A). On each trial, three stimuli were presented asynchronously, with each stimulus presented at the top, bottom left, or bottom right of the screen. The color, shape, position, and order of stimuli were fully randomized. Each stimulus was presented for 400 msec and was followed by a 600-msec blank period. Monkeys were free to fixate upon the stimuli when they appeared.
We found that monkeys made at least one saccade to presented stimuli most of the time 64.40% for the presentation of Stimulus 1, 63.18% for the presentation of Stimulus 2, and 55.99% for the presentation of Stimulus 3). However, because monkeys did not always look at presented stimuli, we restricted our analysis of neural activity during the presentation period (see below) to trials in which monkeys looked at the stimuli. After the stimuli were presented separately, all three stimuli appeared simultaneously with a central fixation spot in the middle of the stimuli. The monkey was required to fixate on the central dot for 100 msec and then indicate its choice by shifting gaze to its preferred stimulus and maintaining fixation on it for 250 msec. Failure to maintain gaze for 250 msec did not lead to the end of the trial but instead returned the monkey to a choice state; thus, monkeys were free to change their mind if they did so within 250 msec (although, in our observations, they seldom did so). After a successful 250-msec fixation, visual feedback was provided. Correct choices were followed by positive visual feedback (a green outline around the chosen stimulus), whereas incorrect choices were followed by negative feedback (a red outline around the chosen stimulus). After visual feedback, there was a 500-msec delay period in which the screen was blank. After the delay period, correct choices were followed by a liquid (water) reward. Incorrect choices were followed by no reward. All trials were separated by an 800-msec ITI, which we refer to as the preparatory period for the next trial. During this time, the screen was blank, and monkeys’ gaze was unconstrained.
In each block, monkeys were required to learn and respond according to one of six specific rules (cyan, magenta, yellow, circle, star, or triangle). Because there were six rules, monkeys were required to use a trial-and-error learning process to determine the correct rule after a rule change. Rule changes occurred after 10, 15, 20, or 30 consecutive correct trials and were not explicitly cued. Block size was fixed within a session but varied occasionally across sessions. Most sessions were conducted with a block size of 15 (85.67%), whereas a minority of sessions were conducted with a block size of 10 (0.0065%), 20 (4.89%), or 30 (8.79%). Because rule switches were not cued, monkeys typically responded incorrectly on the first trial of each block (the inevitable error trial). After the inevitable error trial, monkeys began a trial-and-error process of discovering the new rule.
On each block (besides the first block of each session), subjects completed either an intradimensional (ID) or extradimensional (ED) switch to the new rule. ID switches refer to instances when subjects switched from a rule in one dimension (e.g., cyan) to a rule in the same dimension (e.g., magenta), whereas ED switches refer to instances when subjects switched from a rule in one dimension (e.g., cyan) to a rule in the alternative dimension (e.g., circle).
We assessed behavioral performance by examining the proportion of perseverative and regressive errors on each block. Both perseverative and regressive errors were defined as instances when monkeys responded incorrectly and chose a stimulus that was consistent with the rule during the previous block; however, perseverative errors refer to errors that occurred before the point of rule acquisition, whereas regressive errors refer to errors that occurred after rule acquisition. The point of rule acquisition was defined as the first correct trial in a series of four consecutive correct trials (the late switch point, defined in more detail below).
The proportion of perseverative and regressive errors on ID and ED blocks was compared using a two-way ANOVA with the factors Block type (ID or ED) and Error type (perseverative or regressive), followed by post hoc Fisher’s least significant difference (LSD) tests.
Analysis of Switch-related Neural Activity
We examined switch-related neural activity during the 1420-msec postfeedback period after feedback (i.e., the combined duration of the delay, reward, and preparatory periods) and before the start of switch and nonswitch trials. We analyzed this period because monkeys likely reconfigured their cognitive rule set on switch trials during this period. Nonswitch trials were defined as all trials other than switch trials. The two types of switch trials are defined below.
We identified two points in the block when monkeys likely reconfigured (i.e., switched) their cognitive rule set. The first point occurred early during the trial-and-error portion of the block, whereas the second occurred at the end of the trial-and-error period, immediately before monkeys acquired the new rule. We defined the first point (which we will call the “early switch point”) as the postfeedback period after an incorrect choice and immediately before the start of the first correct trial (Figure 1B). We chose this trial because subjects had received information regarding the correct rule (i.e., feedback indicating that neither the color nor the shape of the previously chosen option is the new rule) and thus likely switched their cognitive set in preparation for the next trial but had not yet begun consistently responding according to the new rule. To ensure that early switch points occurred at a point before subjects acquired the new rule, we excluded early switch points that were also identified as late switch points. To identify the point where monkeys switched to a new rule, the “late switch point,” we examined series of subjects’ correct trials at various points after a rule change. Specifically, we examined their accuracy on the trial immediately after the first instance of completing one, two, three, four, five, or six consecutive correct trials (Figure 2C). We found that performance was better after completing at least two consecutive correct trials compared with one correct trial (p < .0001, Fisher’s LSD test), after completing three consecutive correct trials compared with two consecutive correct trials (p = .0007, Fisher’s LSD test), and after completing three consecutive correct trials compared with four consecutive correct trials (p = .0300, Fisher’s LSD test). Once they completed four consecutive correct trials, however, their performance did not improve from four to five consecutive correct trials (p = .0984, Fisher’s LSD test) or from five to six consecutive correct trials (p = .1572, Fisher’s LSD test). On the basis of these findings, we reasoned that monkeys had likely fully switched to the new rule when they completed at least four consecutive correct trials. We therefore defined the late switch point as the postfeedback period after an incorrect choice and immediately before the first trial in the first series of at least four consecutive correct trials in the block (Figures 1B and 2C).
Figure 2.
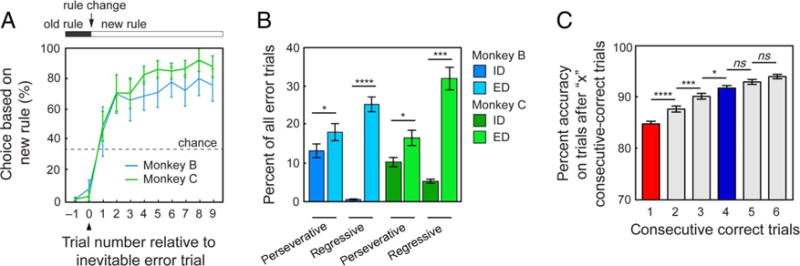
Behavioral results. (A) Average proportion of choices based on the new rule relative to the inevitable error trial. Error bars indicate SEMs. (B) Average proportion of perseverative and regressive errors on each block. Error bars indicate SEMs. *p < .05; ***p < .001; ****p < .001, Fisher’s LSD test. (C) Average percent accuracy on the trial immediately after the first occurrence of one, two, three, four, five, or six consecutive correct trials after a rule change. Error bars indicate SEMs. *p < .05; ***p < .001; ****p < .001, Fisher’s LSD test.
For all analyses examining early and late switch points, we excluded four cells from the set of DS data and six cells from the set of VS data. We excluded these cells because there were fewer than three ID and/or ED early switch trials per session when these cells were recorded.
Task-related activity during the postfeedback period was determined using ANOVA with the factors Trial type (switch or nonswitch), Block type (ID or ED), Trial outcome (reward or no reward), and Next trial outcome (reward or no reward). In these analyses, Trial outcome refers to the outcome during the reward period during the postfeedback period, whereas Next trial outcome refers to the outcome during the reward period on the following trial. For both switch and nonswitch trials, Block type was defined based on whether the switch from the previous to the current block was ID or ED. Although we were interested in the effects of Trial type, Block type, and their interaction, we included Trial outcome and Next trial outcome in our ANOVA model to control for the potential influence of reward- or error-related activity. Because current trial outcome and next trial outcome were not fully crossed with trial type in this model (i.e., switch trials always consisted of a non-rewarded trial followed by a rewarded trial), we used a nested ANOVA in which current and next trial outcomes were nested in trial type. A nested ANOVA measures the effects of a factor while partialling out the effects of a nesting factor. Thus, by utilizing a nested ANOVA in which current and next trial outcomes were nested in trial type, our model includes an estimate of the effects of current and next trial outcomes, which thus serves as control for reward outcome-related effects. We conducted these analyses separately for early and late switch points. On the basis of the ANOVA results, we classified task-related activity into three types. The first type showed a significant main effect (p < .05) of Trial type, whereas the second type showed a significant main effect (p < .05) of Block type, and the third showed a significant interaction (p < .05) between Trial type and Block type. Post hoc comparisons (Fisher’s LSD test) were conducted if the interaction was significant (p < .05). We refer to neurons with a main effect of Trial type as general switch signaling neurons and neurons with an interaction between Trial type and Block type as context-specific switch signaling neurons. In this study, we focused on both general and context-specific switch-related activity.
To determine if the proportion of cells demonstrating a significant switch-related effect (a main effect of Trial type or a significant interaction between Trial type and Block type) was significantly above chance, we conducted binomial tests and adjusted the p value using a Bonferroni correction for two comparisons. We corrected for two comparisons because we analyzed activity at both early and late switch points. We chose to maintain an alpha of .05 and multiply the resultant p values by 2 as a way of implementing the Bonferroni correction. Thus, the p values reported in this manuscript have been adjusted, where appropriate. To determine if proportions of cells demonstrating an effect were significantly different across VS and DS, we conducted chi-square tests. To determine if proportions of cells demonstrating an effect were significantly different across early and late switch points, we conducted McNemar’s tests.
To examine the percent of variance explained by each switch-related effect across the populations of VS and DS neurons, we calculated the average partial η2. Partial η2 is a measure of effect size in ANOVA, which measures the proportion of variance attributable to a factor after partialling out other factors from the nonerror variance. Partial η2 is calculated as
where SSfactor is the variation attributable to the factor (sum of squares for the factor) and SSerror is the error variation (sum of squares error). To compare the average partial η2 for switch-related effects at early and late switch points and in VS and DS, we used a two-way ANOVA with the factors Switch period (early and late) and Brain region (VS and DS), followed by post hoc Fisher’s LSD tests.
Analysis of Associative Learning-related Neural Activity
To examine associative learning-related activity, we calculated the average firing rate during each of the three stimulus presentation epochs on all correct trials. We defined the stimulus presentation epoch as the 1000-msec period consisting of 400 msec when the stimulus was on the screen and the following 600 msec when the stimulus was off the screen. We then used a two-way t test to compare the average firing rate during all epochs across all correct trials in which the correct stimulus was presented to the average firing rate during all epochs across all correct trials in which the correct stimulus was not presented.
To examine the magnitude of correct stimulus selectivity, we calculated Hedge’s g, a measure of effect size similar to Cohen’s d. Hedge’s g is recommended when groups have different sizes and was also developed to remove a positive bias affecting Cohen’s d (Hedges, 1981). Because the sample sizes for the presentation of incorrect stimuli were always larger than the sample sizes for the presentation of correct stimuli (because each trial consisted of one correct stimulus and two incorrect stimuli), we chose to calculate effect size using Hedge’s g, rather than Cohen’s d. Hedge’s g is calculated as
where M1 and M2 are the means of each group and SDpooled is the pooled standard deviation, calculated as
where n1 and n2 are the sample sizes for each group and SD1 and SD2 are the standard deviations for each group.
To visualize correct stimulus selectivity across time within trials and across trials within blocks, we calculated Hedge’s g for each neuron using a 200-msec window, slid in 10-msec steps, and also across a two-trial window, slid in one-trial steps over the first 10 correct trials in each block, collapsed across blocks. We then averaged across neurons to obtain the average selectivity for the populations of VS and DS neurons. To examine selectivity statistically, we first determined the average time of maximum selectivity within trials in each region (averaged across all correct trials) and analyzed a 200-msec period surrounding that time (100 msec before and 100 msec after). Using these analysis epochs, we calculated the average selectivity (Hedge’s g) on the first 10 correct trials in each block and performed a linear regression of the average selectivity against correct trial number in block.
To compare selectivity in VS and DS before and after late switch points, we again analyzed selectivity during a 200-msec period surrounding the average time of maximum selectivity. We then compared selectivity across switch periods and brain regions using a two-way ANOVA with the factors Switch period (pre-late switch and post-late switch) and Brain region (VS and DS), followed by post hoc Fisher’s LSD tests.
General Statistical Methods
PSTHs were constructed by aligning spike rasters to the onset of visual feedback and averaging firing rates across multiple trials. Firing rates were calculated in 10-msec bins. For display, example cell PSTHs were smoothed using a Gaussian kernel (σ = 50 msec). Figures depicting the average proportion of cells demonstrating a significant effect and the average effect size (partial η2 and Hedge’s g) across time within the trial were constructed by calculating each measure for each cell, using a 500-msec sliding window, slid in 10-msec steps. We then averaged across neurons to obtain an average measure for the populations of VS and DS cells.
For all population analyses reported, we made us of all cells that had enough trials, rather than a subpopulation of significantly modulated cells. All statistical analyses were carried out by using GraphPad Prism version 6 (GraphPad Software) and MATLAB release 2012b (The MathWorks, Natick, MA).
RESULTS
Behavioral Performance
After a 2- to 3-month period of training, both subjects were able to reliably learn new rules and maintain a high level of accuracy once new rules were acquired (Figure 2A). Once training was complete, we collected data during 178 individual recording sessions (n = 53 sessions for Subject B and n = 125 sessions for Subject C). Subjects completed an average of 633.43 ± 250.02 (mean ± SEM) trials per session and an average of 32.44 ± 14.31 blocks per session.
On the first trial of each block, subjects almost always chose according to the previously relevant rule (Figure 2A). Because the block transition was not explicitly cued, we called this the “inevitable error trial” (Figure 1B). On blocks where the new rule happened to match the previous one by chance (one sixth of blocks), the first trial did not produce an error, and monkeys did not change strategy, so we treated these for purposes of analysis as 30-trial blocks. Moreover, because there were three stimuli on each trial, with two dimensions each, occasionally (one third of blocks), the correct stimulus on the first trial was consistent with the previously relevant rule. We therefore specified in our definition of the inevitable error trial that it referred to the first trial on which choosing according to the previous rule would produce an error.
On each block (besides the first block of each session), subjects completed either an ID or ED switch to the new rule. We found that subjects tended to make a greater proportion of perseverative errors (failing to switch to a new rule) and regressive errors (switching back to an old rule after successfully discovering a new one; see Methods) on ED switches compared with that of ID switches (Monkey B: perseverative p = .0471, regressive p < .0001; Monkey C: perseverative p = .0204, regressive p < .0001; Figure 2B).
To perform well on the WCST, monkeys need to use a trial-and-error process to determine newly relevant rules. We were interested in examining two points when monkeys switched strategies during the trial-and-error period of each block: one point early during the trial-and-error period (the early switch point) and one point at the end of the trial-and-error period, immediately before monkeys acquired the new rule (the late switch point). We defined early switch points as the postfeedback period after an incorrect choice and immediately before the first correct trial of the block and late switch points as the postfeedback period after an incorrect choice and immediately before the first trial in the first series of at least four consecutive correct trials in the block (see Methods, Figures 1B and 2C).
On average, subjects completed 14.98 ± 5.62 early switches and 24.06 ± 9.92 late switches per session. Before early switch trials, monkeys completed 2.34 ± 0.47 trials (2.63 ± 0.42 for Monkey B and 2.25 ± 0.43 for Monkey C), and before late switch trials, monkeys completed an average of 5.11 ± 1.48 (6.54 ± 1.27 for Monkey B and 4.41 ± 0.90 for Monkey C). These numbers include the inevitable error trial.
Neurons in Both the VS and DS Demonstrate Switch-related Activity
We first characterized neural responses associated with switch trials. To do this, we compared firing rates on non-switch trials (all trials besides early and late switch trials) with those obtained on early switch trials (i.e., the first correct trial after a switch). Then, in a separate analysis, we compared nonswitch trials with late switch trials (the first correct trial in a series of at least four consecutive correct trials). We analyzed firing rate activity during the postfeedback period separately for each cell using ANOVA (see Methods).
Our assessment of switch-related activity focused on both preponderance and effect size during the postfeedback period, measured by the proportion of cells demonstrating a significant effect and the proportion of variance explained (partial η2) by the main effect of Trial type and the interaction between Trial type and Block type.
Figure 3A shows an example of a VS neuron demonstrating general switch-related activity at both early and late switch points. The average firing rate response for this neuron was significantly greater on early switch trials than on nonswitch trials, for both ID switches (red line and dark gray dotted line, p = .0429, Fisher’s LSD test) and ED switches (orange line and light gray dotted line, p = .0001, Fisher’s LSD test). Activity was significantly greater on late switch trials than on nonswitch trials, for both ID switches (dark blue line and light gray dotted line, p < .0001) and ED switches (light blue line and light gray dotted line, p = .0001). The neurons showed no response difference for ID versus ED switches, whether looking at early switch points (red and orange lines, p = .2384) or late switch points (dark blue and light blue lines, p = .1505).
Figure 3.
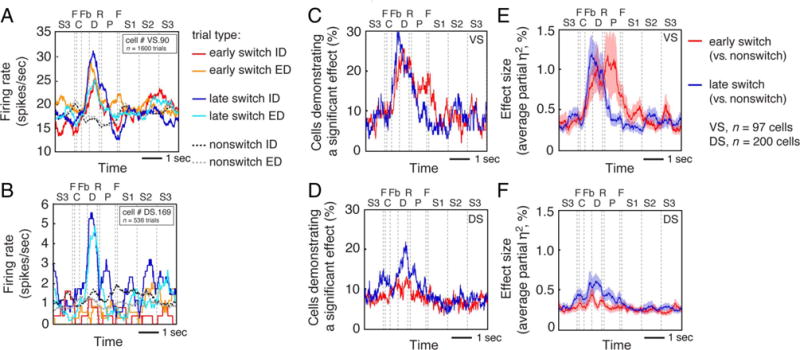
(A) Average response of a single VS neuron demonstrating general switch-related activity (i.e., a main effect of Trial type [switch or nonswitch]) at early and late switch points. Red and orange lines indicate ID and ED switch trials at early switch points, blue and light blue lines indicate ID and ED switch trials at late switch points, and dark and light gray dotted lines indicate ID and ED nonswitch trials. C = choice; Fb = feedback; D = delay; R = reward; P = preparatory period (ITI); F = fixation; S1 = first stimulus appearance; S2 = second stimulus appearance; S3 = third stimulus appearance. (B) Average response of a single DS neuron demonstrating general switch-related activity at late switch points. Same conventions as in A. (C) Proportion of VS cells demonstrating general switch-related activity at early (red line) and late (blue line) switch points. (D) Proportion of DS cells demonstrating general switch-related activity at early (red line) and late (blue line) switch points. (E) Proportion of variance explained (partial η2) by the main effect of Trial type across the population of VS cells at early (red line) and late (blue line) switch points. (F) Proportion of variance explained (partial η2) by the main effect of Trial type across the population of DS cells at early (red line) and late (blue line) switch points. Effect size measures reflect averages across all cells (excluding six from VS and four from DS that were excluded because of an insufficient number of trials).
Figure 3B shows an example of general switch-related activity in a DS neuron. In contrast to the neuron in Figure 3A, this neuron demonstrated switch-related modulation at late, but not early, switch points. Specifically, this cell demonstrated significantly greater firing rate activity on late switch trials than on nonswitch trials, for both ID switches (dark blue line and dark gray dotted line, p = .0135) and ED switches (light blue line and light gray dotted line, p = .0425), but no difference in firing rate activity on early switch trials compared with non-switch trials, for ID switches (red line and dark gray dotted line, p = .2492) or ED switches (orange line and light gray dotted line, p = .4513). Similar to the cell shown in Figure 3A, the average firing rate response for this neuron was not different when the monkey completed ID switches compared with ED switches at early switch points (red and orange lines, p = .9589) or late switch points (dark blue and light blue lines, p = .1633).
Switch-related activity was more common than would be expected by chance in both VS and DS. Specifically, we calculated the average proportion of cells demonstrating a significant effect across the entire 1420-msec postfeedback epoch, rather than focusing on the peak of the response. We found that, for the early switch, 29.90% of VS neurons (n = 29/97 cells, Bonferroni adjusted p < .0001, corrected for two comparisons, binomial test) and 12.00% of DS neurons (n = 24/200 cells, Bonferroni adjusted p < .0001, corrected for two comparisons, binomial test) demonstrated general switch-related activity. At late switch points, 24.74% of VS neurons (n = 24/97 cells, p < .0001) and 20.50% of DS neurons (n = 41/200 cells, p < .0001) did so.
Figure 3C and D shows the proportion of significant cells in the VS and DS across time within trials. Whereas the proportions of VS neurons demonstrating general switch-related activity at early and late switch points were not different from each other (n = 29/97 and n = 24/97; p = .3691, McNemar’s test), the proportion of DS neurons demonstrating general switch activity at late switch points was significantly greater than the proportion of DS neurons demonstrating general switch-related activity at early switch points (n = 24/200 and n = 41/200; p = .0095, McNemar’s test). We also found that the proportion of neurons demonstrating significant general switch-related activity was significantly greater in VS compared with that in DS at early switch points (n = 29/97 and n = 24/200; p = .0002, chi-square test), but not at late switch points (n = 24/97 and n = 42/200; p = .0002, chi-square test).
Figure 3E and F shows the average proportion of variance explained (partial η2) by the main effect of Trial type in the VS and DS across time within trials. To compare the average partial η2 across VS and DS, we performed a two-way ANOVA with the factors Brain region (VS and DS) and Switch period (early and late) on the average partial η2 during the postfeedback period. This analysis revealed a significant interaction between Brain region and Switch period (p = .0022). Post hoc comparisons revealed a significantly greater partial η2 during the postfeedback period at early compared with late switch points across the population of VS neurons (p = .0217, Fisher’s LSD test) and a significantly greater average partial η2 at late switch points compared with early switch points across the population of DS neurons (p = .0387, Fisher’s LSD test; Figure 5A). From these data, we conclude that switches affect firing rates in both VS and DS and that switching effects are observed during early periods of trial-and-error learning in VS but arise only later at the point of rule acquisition in DS.
Figure 5.
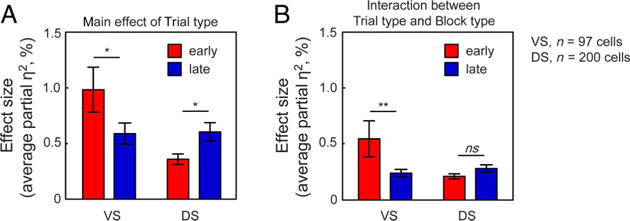
(A) Proportion of variance explained (partial η2) by the main effect of Trial type at early (red bars) and late (blue bars) switch points in the VS and DS. Bar graph shows the mean partial η2 (±SEM) during the postfeedback period. *p < .05. (B) Proportion of variance explained (partial η2) by the interaction between Trial type and Block type at early (red bars) and late (blue bars) switch points in the VS and DS. Bar graph shows the mean partial η2 (±SEM) during the postfeedback period. **p < .01.
Context-specific Switch Signals Arise during the Early Trial-and-Error Period in VS but Not in DS
We next investigated context-specific switching activity (i.e., encoding of switches specific to either ED or ID switches but not both). Context-specific switching is important because it provides a natural control for many confounding factors that could potentially provide alternative explanations for switching-related activity, such as differential reward expectations or the value of information.
Figure 4A shows an example of a VS neuron that has context-specific switch-related activity at early switch points. This cell’s firing rate on early switch trials was greater than that on nonswitch trials for ID switches (red line and dark gray dotted line, p < .0001, Fisher’s LSD test) but not for ED switches (orange line and light gray dotted line, p = 3364). It had no difference in firing rate activity on late switch trials compared with non-switch trials for either ID switches (dark blue line and dark gray dotted line, p = .3690) or ED switches (light blue line and light gray dotted line, p = .4800).
Figure 4.
(A) Average response of a single VS neuron demonstrating context-specific switch-related activity (an interaction between Trial type [switch or nonswitch] and Block type [ID or ED]) at early switch points. Lines for ID and ED switches include the average of both types of ID switches (color to color and shape to shape) and both types of ED switches (color to shape and shape to color). Same conventions as in Figure 3A and B. (B) Proportion of VS cells demonstrating context-specific switch-related activity at early (red line) and late (blue line) switch points. (C) Proportion of DS cells demonstrating context-specific switch-related activity at early (red line) and late (blue line) switch points. (D) Proportion of variance explained (partial η2) by the interaction between Trial type and Block type across the population of VS cells at early (red line) and late (blue line) switch points. (E) Proportion of variance explained (partial η2) by the interaction between Trial type and Block type across the population of DS cells at early (red line) and late (blue line) switch points. Effect size measures reflect averages across all cells (excluding six from VS and four from DS that were excluded because of an insufficient number of trials).
Figure 4B and C shows the proportion of significant cells in the VS and DS across time within trials. The proportion of neurons demonstrating context-specific switch-related activity was greater than chance in the VS at early switch points (11.34% of VS neurons, n = 11/97 cells; Bonferroni corrected p = .0066, binomial test) but not at late switch points (5.15% of VS neurons, n = 5/97 cells, Bonferroni corrected p = .7140). These proportions were not significant in DS at either early (4.50% of DS neurons, n = 9/200 cells, Bonferroni corrected p = 1.0906) or late (7.50% of DS neurons, n = 15/200 cells, Bonferroni corrected p = .0887) switch points.
Although the proportion of VS neurons demonstrating context-specific switch-related activity at early switch points was not significantly greater than the proportion at late switch points (n = 11/97 and n = 5/97; p = .1336, McNemar’s test), the proportion of neurons modulated is not a very sensitive statistic. We therefore explored a more sensitive one, the average proportion of variance explained (partial η2). Figure 4D and E shows the average partial η2 for the interaction between Trial type and Block type for all VS and DS neurons across time within trials. To compare the average partial η2 across VS and DS, we again performed a two-way ANOVA with the factors Brain region (VS and DS) and Switch period (early and late) on the average partial η2 during the postfeedback period. This quantity was significantly greater at early switch points than at late switch points in VS (p = .0021, Fisher’s LSD test; Figure 5B). In contrast, we observed no such differences in DS. Specifically, there was no difference in the proportion of neurons demonstrating context-specific switch-related activity and no difference in the proportion of variance explained at early or late switch points in the DS (n = 9/200 and n = 15/200; p = .2008, McNemar’s test; p = .4147, Fisher’s LSD test). Among the population of cells demonstrating context-specific switch-related activity in the VS, we found that an equal proportion of neurons exhibited stronger responses on ID switches (n = 7/11 cells) compared with the proportion of neurons that demonstrated stronger responses on ED switches (n = 5/11 cells; these proportions are not different, p = .3918, chi-square test).
Taken together with our findings regarding general switch-related activity, the abovementioned results suggest that, during the early trial-and-error period of the block, VS neurons, but not DS neurons, signal switches and that a portion of these cells carry information about the rule context (i.e., whether the switch is ID or ED). In contrast, during the later period of the block, both regions signal a switch to the new rule, but these signals provide no information regarding the switch context.
Because subjects committed a greater proportion of perseverative errors on ED versus ID switches, it is possible that our results could be explained by differences in neural activity related to perseverative versus non-perseverative errors during the trial-and-error period. To address this possibility, we examined neural responses to perseverative and nonperseverative errors during the trial-and-error period in both VS and DS. We did this by conducting two-way t tests on the average firing rate activity during the postfeedback period on trials during the trial-and-error period for both error types. We did not find evidence that either region differentiates the two error types. Specifically, we found that 5.15% of VS neurons (n = 5/97 cells) differentiated between perseverative and nonperseverative errors (this proportion was not above chance: p = .3570, binomial test) and 2.50% of VS neurons (n = 5/200 cells) differentiated between perseverative and nonperseverative errors (this proportion was not above chance: p = .9377, binomial test). Even among our originally identified context-dependent switch signaling cells, only one VS cell and one DS cell differentiated between the two types of errors. These results suggest that the effects of error type are not particularly strong and are therefore unlikely to account for the effects we observe in regard to context-specific switch signals.
Because it is possible to analyze this data set using a reduced ANOVA model rather than a nested ANOVA model, we conducted additional analyses to determine whether our results were biased based on our choice of a nested model. Specifically, we reexamined the proportion of cells demonstrating a significant effect of Trial type and/or a significant interaction between Block type and Trial type using a reduced ANOVA model with the following terms: Trial type, Block type, Trial outcome, Next trial outcome, Trial type × Block type, Block type × Trial outcome, Block type × Next trial outcome, and Block type × Trial outcome × Next trial outcome. This model yielded nearly identical results compared with our original model. Specifically, in our original nested ANOVA model, we found the following proportions of cells modulated in VS: 29.90% (early switch, main effect of Trial type), 24.74% (late switch, main effect of Trial type), 11.34% (early switch, interaction between Trial type and Block type), and 5.15% (late switch, interaction between Trial type and Block type). Using the new reduced ANOVA model, we found similar proportions: 26.80% (early switch, main effect of Trial type), 25.78% (late switch, main effect of Trial type), 11.34% (early switch, interaction between Trial type and Block type), and 8.25% (late switch, interaction between Trial type and Block type). We also found similar results between the two models in the DS. Specifically, in our original nested ANOVA model, we found the following proportions of cells modulated in DS: 12.00% (early switch, main effect of Trial type), 20.50% (late switch, main effect of Trial type), 4.50% (early switch, interaction between Trial type and Block type), and 7.50% (late switch, interaction between Trial type and Block type). Using the new reduced ANOVA model, we found the following: 12.50% (early switch, main effect of Trial type), 23.00% (late switch, main effect of Trial type), 7.50% (early switch, interaction between Trial type and Block type), and 8.50% (late switch, interaction between Trial type and Block type).
Do Striatal Neurons Represent Switches to Newly Relevant Dimensions, Independent of Whether the Switch Is ID or ED?
Our analyses thus far suggest that context-dependent switch signals exist in the VS at early, but not late, switch points. However, neurons might represent the newly relevant dimension more strongly at late switch points, given that monkeys had fully switched away from the previously relevant rule at this point. Thus, we examined this possibility by running our ANOVA analyses again but replacing our Block type factor (i.e., ID and ED) with the dimension of the newly relevant rule (i.e., color or shape). We found that a significant number of VS cells demonstrated an interaction between Trial type and the newly relevant dimension at early (13.40% of VS neurons, n = 13/97 cells; Bonferroni corrected p = .0006, binomial test) but not late (8.25% of VS neurons, n = 8/97 cells; Bonferroni corrected p = .1079, binomial test) switch points, whereas a significant number of DS cells demonstrated an interaction between Trial type and the newly relevant dimension at late (8.50% of DS neurons, n = 17/200 cells; Bonferroni corrected p = .0242, binomial test) but not early (7.50% of DS neurons, n = 15/200 cells; Bonferroni corrected p = .0888, binomial test) switch points. However, we did not find a significant difference between the proportion of cells or the percent of variance explained at early and late switch points in VS (n = 13/97 and n = 8/97; p = .2752, McNemar’s test; p = .5893, Fisher’s LSD test) or in DS (n = 15/200 and n = 17/200; p = .7055, McNemar’s test; p = .6652, Fisher’s LSD test). Moreover, we did not find a significant difference between VS and DS in regard to the proportion of significant cells or the percent of variance explained at early switch points (n = 13/97 and n = 8/97; p = .2752, chi-square test; p = .1680, Fisher’s LSD test) or at late switch points (n = 13/97 and n = 8/97; p = .2752, chi-square test; p = .6781, Fisher’s LSD test). These data suggest that striatal neurons do not represent the new rule dimension more strongly at late switch points, nor is there any difference in encoding of the new rule dimension at either switch points across VS and DS.
Neurons in Both the VS and DS Demonstrate Associative Learning-related Activity
We next wanted to know how striatal responses relate to learning. Therefore, we examined the neural response to the three probe stimuli at the beginning of each trial (Figure 1). We predicted that, if neurons reflect stimulus-reward learning, they would show modulated responses to correct stimuli as they appear in the sequence (i.e., correct stimulus selectivity).
Figure 6A shows the responses of an example neuron with these effects. This figure includes all correct trials, including those before and after learning. This neuron responded weakly to options as they appeared in sequence but responded strongly when the correct option appeared. To assess this response statistically, we calculated the average firing rate during each of the three stimulus presentation epochs on all correct trials. We defined the stimulus presentation epoch as the 1000-msec period consisting of 400 msec when the stimulus was on the screen and the following 600 msec when the stimulus was off the screen. We then used a two-way t test to compare the average firing rate during all epochs in which the correct stimulus was presented with the average firing rate during all epochs in which the correct stimulus was not presented. This cell demonstrated a significantly greater firing rate on epochs in which the correct stimulus was presented compared with epochs in which the correct stimulus was not presented (p < .0001). This cell is illustrative of the pattern we observed in the populations of VS and DS neurons.
Figure 6.
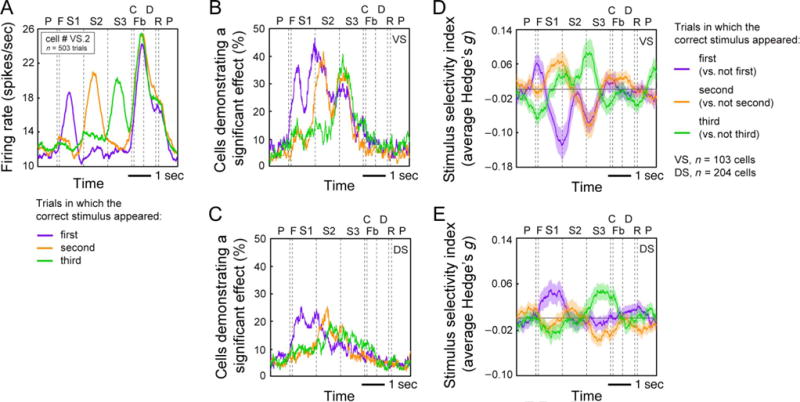
(A) Average response of a single VS neuron demonstrating selectivity for the presentation of the correct stimulus during the first (purple line), second (orange line), and third (green line) presentation epochs. (B) Proportion of VS cells demonstrating selectivity for the presentation of the correct stimulus. Same conventions as in A. (C) Proportion of DS cells demonstrating selectivity for the presentation of the correct stimulus. Same conventions as in A. (D) Proportion of variance explained (Hedge’s g) by the presentation of the correct stimulus during the first, second, and third presentation epochs across the population of VS cells. Same conventions as in A. (E) Proportion of variance explained (Hedge’s g) by the presentation of the correct stimulus during the first, second, and third presentation epochs across the population of DS cells. Same conventions as in A.
A significant proportion of cells in both the VS and DS demonstrated modulation associated with the presentation of the correct stimulus (VS: 23.30%, n = 24/103 cells, p < .0001, binomial test; DS: 24.51%, n = 50/204 cells, p < .0001, binomial test). This proportion did not differ between the VS and DS (p = .8151, chi-square test). Figure 6B and C shows the proportion of significant cells across time within trials and separated into trials in which the first, second, or third option was the correct stimulus. This analysis revealed a peak in the proportion of significant cells not only during the epoch in which the correct stimulus was presented but also during the epoch after the presentation of the correct stimulus. For example, in trials when the correct stimulus was presented during the first epoch, the proportion of VS cells demonstrating a significant effect peaked during both the first and second epochs (Figure 6B, purple line). On the basis of our observations of single cell firing patterns, we reasoned that this population-level effect was likely because of a significant decrease in firing rate after the presentation of the correct stimulus, rather than a significant increase in firing rate. We therefore examined the average magnitude of correct stimulus selectivity using Hedge’s g (an effect size measure similar to Cohen’s d; see Methods), which allowed us to account for the direction of the effect. The average selectivity across time within trials for the entire population is shown in Figure 6D and E. This analysis revealed a decrease in firing rate after the presentation of the correct option, rather than an increase, as we expected. We therefore used Hedge’s g to examine selectivity across trials in our remaining analyses.
Associative Learning-related Activity Appears Early in the VS, during Periods of Trial-and-Error Learning, and Later in the DS, Once the New Rule Is Known
Our central hypothesis is that VS is relatively specialized for early switching and that DS is relatively specialized for late switching. We therefore hypothesized that learned associations would arise in VS early in the block (after early switch points and before late switch points) and in DS late in the block (after late switch points).
To examine the time course of associative learning activity in VS and DS across trials within blocks, we examined the magnitude of correct stimulus selectivity (Hedge’s g) on correct trials throughout the block. Figure 7A and B shows the average selectivity for the presentation of the correct stimulus (compared with the presentation of incorrect stimuli) across the first 10 correct trials in the block. We found that correct stimulus selectivity appeared to peak later in the block in DS than in VS. To assess this effect statistically, we first determined the average time of maximum selectivity within trials in each region (averaged across all correct trials) and analyzed a 200-msec period surrounding that time (100 msec before and 100 msec after). We found that correct stimulus selectivity peaked 340 msec after the start of the stimulus presentation period in VS and 520 msec after the start of the stimulus presentation period in DS. Using these analysis epochs, we calculated the average selectivity (Hedge’s g) on the first 10 correct trials and performed a linear regression of the average selectivity against correct trial number. We found a significant relationship between average selectivity and correct trial number in DS (p = .0201, R2 = .5114) but not in VS (p = .2778, R2 = .1449).
Figure 7.
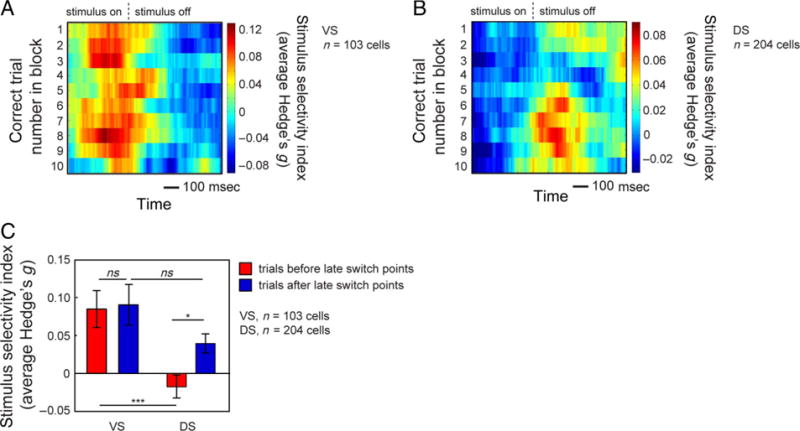
(A) Average proportion of variance explained (Hedge’s g) by the presentation of the correct stimulus (compared with epochs in which the correct stimulus was not presented) for the population of VS neurons. Heat plots were constructed by calculating Hedge’s g for each neuron using a 200-msec window, slid in 10-msec steps, and also across a two-trial window, slid in one-trial steps over the first 10 correct trials in each block, collapsed across blocks. We then averaged across neurons to obtain the average selectivity for the population. (B) Average proportion of variance explained (Hedge’s g) by the presentation of the correct stimulus (compared with epochs in which the correct stimulus was not presented) for the population of DS neurons. Heat plots were constructed the same as in A. (C) Average proportion of variance explained (Hedge’s g) by the presentation of the correct stimulus before late switch points (red) and after late switch points (blue) for the populations of VS and DS neurons. The analysis epoch for each region consists of a 200-msec period surrounding the average time of maximum selectivity. Bar graph shows the mean Hedge’s g (±SEM) during these epochs. *p < .05, ***p < .001.
To examine the relation between correct stimulus selectivity and switch-related activity more directly, we examined correct stimulus selectivity before and after late switch points (Figure 7C). We again defined our analysis epochs as the 200-msec period surrounding the average time of maximum selectivity within trials. We then calculated the average selectivity on all correct trials before late switch points and all correct trials after late switch points for both VS and DS. We did not examine trials before early switch points because the early switch point was defined as the first correct trial (after an error) in the block and we restricted our analysis to correct trials only. We found no difference in the magnitude of selectivity before or after late switch points in the VS (p = .8532, Fisher’s LSD test) but found a significant increase in the magnitude of selectivity after late switch points compared with before late switch points in DS (p = .0103, Fisher’s LSD test). We also found a significantly greater magnitude of selectivity in VS compared with DS before late switch points (p = .0001, Fisher’s LSD test) and no difference in the magnitude of selectivity in VS and DS after late switch points (p = .0585, Fisher’s LSD test).
The abovementioned results indicate that VS neurons begin to demonstrate associative learning signals during the early trial-and-error period of the block, whereas DS neurons begin to demonstrate associative learning signals later in the block, once the new rule is fully acquired. Thus, the emergence of associative learning signals in VS and DS appears to be consistent with the timing of switch signals in each region.
DISCUSSION
In this study, we examined how the striatum contributes to cognitive flexibility using a monkey version of a well-known test of cognitive set reconfiguration—the WCST. We found that VS and DS neurons both show reliable changes in firing rate activity during the postfeedback period immediately before switches. This finding affirms the theory that striatum contributes prominently to switching and more generally to executive control—a function, in primates and humans, that is traditionally associated with cortical regions and not the striatum (Kamigaki et al., 2012; Sawada et al., 2012; Buckley et al., 2009; Mansouri et al., 2006; Konishi et al., 1998, 2003; Nakahara, 2002; Omori et al., 1999; Dias et al., 1996; Milner, 1963, 1982). We also found that VS and DS neurons signal switches at distinct but overlapping points during cognitive set reconfiguration. VS neurons signal switches at an early point when the correct rule is not yet known and also at a later point when the correct rule is established, whereas DS neurons preferentially signal switches only at the later point of rule establishment.
Our findings are consistent with the theory that the VS is not simply a “reward center” (a pervasive and traditional view of VS function) but instead also plays an important role in the refinement of action selection. Specifically, in a comprehensive review of the topic, Floresco (2015) argues that the VS facilitates goal-directed behaviors through the refinement of action selection, particularly in situations that are uncertain or ambiguous. Our finding that VS neurons signal switches during trial-and-error learning processes (a point at which the correct rule is uncertain) endorses this view of VS function and argues against a purely reward-centric view of VS.
In VS, we found that switch signals are often context-specific during the early trial-and-error stage of learning. In other words, neurons demonstrate switch-related activity when a switch is ID (a switch from one color rule to another color rule or from one shape rule to another shape rule) but not ED (a switch from a color rule to a shape rule or from a shape rule to a color rule), or vice versa. The context specificity is important because it provides a control for arousal, attention, and reward expectations and any other factor that correlates with switching (this argument was developed by Kamigaki et al., 2009). It also provides some suggestions about how switching is implemented by the striatum: Context-specific switch-related activity might reflect the process of redirecting attention to the appropriate dimension after a rule change occurs. Our results thus suggest that neurons in the striatum do not carry a single general abstract switch signal but instead carry a specific switch signal, which can presumably constrain future models of how the striatum contributes to switching.
We also found that an equal number of context-specific switch signaling neurons in the VS preferred ID or ED switches at early switch points. Although previous work has indicated that inactivation of the VS in rodents impairs switching from one strategy to an alternative strategy (Floresco et al., 2006), our study is the first, to our knowledge, to demonstrate that a proportion of VS neurons preferentially signal ID or ED switches in primates. Moreover, the similarity between our data and previous work in rodents is important because of the potential psychological differences in switching between primates and rodents, a topic that is not fully understood. Our results thus provide a reason for optimism that the rodent studies may translate readily to humans.
Our data are also consistent with the anatomical position of the striatum within corticostriatal circuits. Previous work has shown that distinct pathways in the BG are involved in releasing movement (direct pathway) or inhibiting movement (indirect pathway; Mink, 1996). Recent studies suggest that similar mechanisms may mediate the gating of relevant and irrelevant information into working memory—whereas the direct pathway enables the integration of task-relevant information, the indirect pathway inhibits the integration of task-irrelevant information (Hazy et al., 2007; O’Reilly & Frank, 2006). Although highly speculative, our findings may be consistent with this idea. Specifically, it may be the case that VS participates in filtering task-relevant and task-irrelevant contexts (i.e., whether the switch is ID or ED) during the early phases of trial-and-error learning. More research would be needed, however, to address this possibility directly. In particular, it is important to know how striatal neurons represent relevant and irrelevant information across a number of task variables (e.g., rule categories, specific rule types, discrete stimuli, and spatial positions) and how these representations change with learning and with different levels of reward expectation. Ongoing work in our laboratory aims to address these questions.
Our findings are also consistent with inactivation studies in rodents indicating that inactivation of the DS disrupts the ability to maintain new strategies, whereas inactivation of the VS disrupts the ability to eliminate irrelevant response strategies and the ability to maintain new strategies (Floresco et al., 2006; Ragozzino et al., 2002). Importantly, our results extend upon inactivation studies by suggesting that behavioral impairments after inactivation may be because of differential contributions of VS and DS to flexible decision-making that are apparent at the level of single neuron activity. Moreover, our results reveal more specifically how the VS and DS may contribute to switching; whereas the VS appears to contribute at an early point when the set context must be established and a later point when the rule is acquired, the DS appears to contribute only at the later point of rule acquisition.
Future studies are needed to determine how striatal switch signaling cells might interact with other brain regions to mediate reconfiguration processes. For example, it is not clear how context-dependent switch signals in the striatum are related to those that have been found in the parietal cortex (Kamigaki et al., 2009), nor is it clear how striatal switch signals are related to neurons that demonstrate rule modulation during reconfiguration in the dorsolateral pFC (Mansouri et al., 2006). We are also particularly interested in ascertaining the relationship between striatal regions and their cortical projections, especially the OFC and dorsal ACC. Our previous studies demonstrate that both of these regions have well-established roles in task switching, cognitive control, and economici choices (Heilbronner & Hayden, 2016; Blanchard, Hayden, & Bromberg-Martin, 2015; Blanchard, Strait, & Hayden, 2015; Blanchard & Hayden, 2014). Direct comparisons of neural activity in the striatum and cortical regions using the same task may further clarify specific striatal contributions to cognition.
An alternative interpretation of our results is that seeming switch signals reflect errors, rather than switching. However, this interpretation is not likely given that we took several steps to minimize the influence of reward outcome responses. Nevertheless, if switch signals are a specific type of error signal, rather than a switch signal per se, our results still provide meaningful insight into the role of VS and DS in cognitive set reconfiguration. To our knowledge, differential representations of context-specific error signals across striatal subregions have not been previously observed. Thus, if these signals are error-related signals, this would not affect our interpretation of the data.
Our analysis of associative learning-related activity provides further insight into the neural mechanisms underlying cognitive set reconfiguration. Consistent with previous work, we find that associative learning signals are present in both the VS and DS (Pasupathy & Miller, 2005; Setlow, Schoenbaum, & Gallagher, 2003). Moreover, we find that neural signals reflecting learned stimulus-reward associations appear early in the block in VS and later in the block in DS. These results are consistent with our findings regarding switch signals and provide further support for the idea that VS contributes to early identification of new rules, whereas DS contributes later, once new rules are known.
A previous study by our laboratory showed encoding of economic variables in VS (Strait, Sleezer, & Hayden, 2015). Although this study is consistent with a value-centric view of VS function, we do not think it is inconsistent with the present one. Indeed, in another study, we found encoding of spatial information—relevant for control but not pure value variables—in VS neurons (Strait et al., 2016). Moreover, those two studies demonstrated a large overlap in function between VS and its cortical inputs (Strait et al., 2014). The present results suggest that this overlap may likewise extend to executive functions. Indeed, a previous study suggests that the posterior cingulate cortex, an area with a strong economic role, may also contribute to executive functions (Hayden, Smith, & Platt, 2010). Together, these findings raise the speculative possibility that executive control may largely overlap with economic function and may not be as distinct as is commonly believed.
Conclusions
Taken together, our findings support previous work suggesting that the VS and DS contribute to different components of behavioral flexibility. Thus, our data provide a neural basis for a theory heretofore based on behavioral observations following rodent brain inactivations (Floresco et al., 2006; Ragozzino et al., 2002). Moreover, to our knowledge, our study is the first to implicate the VS in set shifting in primates and the first to find a link between the appearance of switch signals and the appearance of associative learning-related signals in the striatum.
Our results may also provide insight into the neural pathology underlying disorders characterized by impaired flexibility and striatal dysfunction. In drug addiction, for example, individuals are often impaired in their ability to behave flexibly, both in real-world situations (e.g., an inability to alter drug-related thoughts and behaviors) and in laboratory tests of flexibility (Beveridge, Gill, Hanlon, & Porrino, 2008; Ersche, Roiser, Robbins, & Sahakian, 2008; Fillmore & Rush, 2006). Given our current findings, it is possible that addictive drugs impair both the early establishment and later maintenance of non-drug-related behaviors, which may be because of a loss of switch signals in the striatum. Further research is needed to determine if striatal switch signals are disrupted after prolonged drug exposure.
Acknowledgments
This research was supported by an R01 (DA038106) and a Brain and Behavior Research Foundation NARSAD award to B. Y. H. and by an NIH Training Fellowship (T32-EY007125) to B. J. S. We thank Stan Floresco for useful discussions, Meghan Castagno and Tommy Blanchard for assistance in data collection and analysis, and Marc Mancarella for general laboratory assistance.
References
- Apicella P, Ljungberg T, Scarnati E, Schultz W. Responses to reward in monkey dorsal and ventral striatum. Experimental Brain Research. 1991;85:491–500. doi: 10.1007/BF00231732. [DOI] [PubMed] [Google Scholar]
- Balleine BW, Delgado MR, Hikosaka O. The role of the dorsal striatum in reward and decision-making. Journal of Neuroscience. 2007;27:8161–8165. doi: 10.1523/JNEUROSCI.1554-07.2007. [DOI] [PMC free article] [PubMed] [Google Scholar]
- Beveridge TJ, Gill KE, Hanlon CA, Porrino LJ. Parallel studies of cocaine-related neural and cognitive impairment in humans and monkeys. Philosophical Transactions of the Royal Society of London, Series B: Biological Sciences. 2008;363:3257–3266. doi: 10.1098/rstb.2008.0102. [DOI] [PMC free article] [PubMed] [Google Scholar]
- Blanchard TC, Hayden BY. Neurons in dorsal anterior cingulate cortex signal postdecisional variables in a foraging task. Journal of Neuroscience. 2014;34:646–655. doi: 10.1523/JNEUROSCI.3151-13.2014. [DOI] [PMC free article] [PubMed] [Google Scholar]
- Blanchard TC, Hayden BY, Bromberg-Martin ES. Orbitofrontal cortex uses distinct codes for different choice attributes in decisions motivated by curiosity. Neuron. 2015;85:602–614. doi: 10.1016/j.neuron.2014.12.050. [DOI] [PMC free article] [PubMed] [Google Scholar]
- Blanchard TC, Strait CE, Hayden BY. Ramping ensemble activity in dorsal anterior cingulate neurons during persistent commitment to a decision. Journal of Neurophysiology. 2015;114:2439–2449. doi: 10.1152/jn.00711.2015. [DOI] [PMC free article] [PubMed] [Google Scholar]
- Buckley MJ, Mansouri FA, Hoda H, Mahboubi M, Browning PGF, Kwok SC, et al. Dissociable components of rule-guided behavior depend on distinct medial and prefrontal regions. Science. 2009;325:52–58. doi: 10.1126/science.1172377. [DOI] [PubMed] [Google Scholar]
- Delgado MR. Reward-related responses in the human striatum. Annals of the New York Academy of Sciences. 2007;1104:70–88. doi: 10.1196/annals.1390.002. [DOI] [PubMed] [Google Scholar]
- Delgado MR, Nystrom LE, Fissell C, Noll DC, Fiez JA. Tracking the hemodynamic responses to reward and punishment in the striatum. Journal of Neurophysiology. 2000;84:3072–3077. doi: 10.1152/jn.2000.84.6.3072. [DOI] [PubMed] [Google Scholar]
- Dias R, Robbins TW, Roberts AC. Primate analogue of the Wisconsin Card Sorting Test: Effects of excitotoxic lesions of the prefrontal cortex in the marmoset. Behavioral Neuroscience. 1996;110:872. doi: 10.1037//0735-7044.110.5.872. [DOI] [PubMed] [Google Scholar]
- Ersche KD, Roiser JP, Robbins TW, Sahakian BJ. Chronic cocaine but not chronic amphetamine use is associated with perseverative responding in humans. Psychopharmacology. 2008;197:421–431. doi: 10.1007/s00213-007-1051-1. [DOI] [PMC free article] [PubMed] [Google Scholar]
- Fillmore MT, Rush CR. Polydrug abusers display impaired discrimination-reversal learning in a model of behavioural control. Philosophical Transactions of the Royal Society of London, Series B: Biological Sciences. 2006;20:24–32. doi: 10.1177/0269881105057000. [DOI] [PubMed] [Google Scholar]
- Floresco SB. The nucleus accumbens: An interface between cognition, emotion, and action. Annual Review of Psychology. 2015;66:25–52. doi: 10.1146/annurev-psych-010213-115159. [DOI] [PubMed] [Google Scholar]
- Floresco SB, Ghods-Sharifi S, Vexelman C, Magyar O. Dissociable roles for the nucleus accumbens core and shell in regulating set shifting. Journal of Neuroscience. 2006;26:2449–2457. doi: 10.1523/JNEUROSCI.4431-05.2006. [DOI] [PMC free article] [PubMed] [Google Scholar]
- Graybiel AM. Habits, rituals, and the evaluative brain. Annual Review of Neuroscience. 2008;31:359–387. doi: 10.1146/annurev.neuro.29.051605.112851. [DOI] [PubMed] [Google Scholar]
- Hampshire A, Hellyer PJ, Parkin B, Hiebert N, MacDonald P, Owen AM, et al. Network mechanisms of intentional learning. Neuroimage. 2016;127:123–134. doi: 10.1016/j.neuroimage.2015.11.060. [DOI] [PMC free article] [PubMed] [Google Scholar]
- Hayden BY, Smith DV, Platt ML. Cognitive control signals in posterior cingulate cortex. Frontiers in Human Neuroscience. 2010;4:223. doi: 10.3389/fnhum.2010.00223. [DOI] [PMC free article] [PubMed] [Google Scholar]
- Hazy TE, Frank MJ, O’Reilly RC. Towards an executive without a homunculus: Computational models of the prefrontal cortex/basal ganglia system. Philosophical Transactions of the Royal Society of London, Series B: Biological Sciences. 2007;362:1601–1613. doi: 10.1098/rstb.2007.2055. [DOI] [PMC free article] [PubMed] [Google Scholar]
- Hedges LV. Distribution theory for glass’s estimator of effect size and related estimators. Journal of Educational and Behavioral Statistics. 1981;6:107–128. [Google Scholar]
- Heilbronner SR, Hayden BY. Dorsal anterior cingulate cortex: A bottom-up view. Annual Review of Neuroscience. 2016;39 doi: 10.1146/annurev-neuro-070815-013952. [DOI] [PMC free article] [PubMed] [Google Scholar]
- Jog MS. Building neural representations of habits. Science. 1999;286:1745–1749. doi: 10.1126/science.286.5445.1745. [DOI] [PubMed] [Google Scholar]
- Kamigaki T, Fukushima T, Miyashita Y. Cognitive set reconfiguration signaled by macaque posterior parietal neurons. Neuron. 2009;61:941–951. doi: 10.1016/j.neuron.2009.01.028. [DOI] [PubMed] [Google Scholar]
- Kamigaki T, Fukushima T, Tamura K, Miyashita Y. Neurodynamics of cognitive set shifting in monkey frontal cortex and its causal impact on behavioral flexibility. Journal of Cognitive Neuroscience. 2012;24:2171–2185. doi: 10.1162/jocn_a_00277. [DOI] [PubMed] [Google Scholar]
- Konishi S, Jimura K, Asari T, Miyashita Y. Transient activation of superior prefrontal cortex during inhibition of cognitive set. Journal of Neuroscience. 2003;23:7776–7782. doi: 10.1523/JNEUROSCI.23-21-07776.2003. [DOI] [PMC free article] [PubMed] [Google Scholar]
- Konishi S, Nakajima K, Uchida I, Kameyama M, Nakahara K, Sekihara K, et al. Transient activation of inferior prefrontal cortex during cognitive set shifting. Nature Neuroscience. 1998;1:80–84. doi: 10.1038/283. [DOI] [PubMed] [Google Scholar]
- Mansouri FA, Matsumoto K, Tanaka K. Prefrontal cell activities related to monkeys’ success and failure in adapting to rule changes in a Wisconsin Card Sorting Test analog. Journal of Neuroscience. 2006;26:2745–2756. doi: 10.1523/JNEUROSCI.5238-05.2006. [DOI] [PMC free article] [PubMed] [Google Scholar]
- Milner B. Effects of different brain lesions on card sorting: The role of the frontal lobes. Archives of Neurology. 1963;9:90. [Google Scholar]
- Milner B. Some cognitive effects of frontal-lobe lesions in man. Philosophical Transactions of the Royal Society of London, Series B: Biological Sciences. 1982;298:211–226. doi: 10.1098/rstb.1982.0083. [DOI] [PubMed] [Google Scholar]
- Mink JW. The basal ganglia: Focused selection and inhibition of competing motor programs. Progress in Neurobiology. 1996;50:381–425. doi: 10.1016/s0301-0082(96)00042-1. [DOI] [PubMed] [Google Scholar]
- Moore TL, Killiany RJ, Herndon JG, Rosene DL, Moss MB. A non-human primate test of abstraction and set shifting: An automated adaptation of the Wisconsin Card Sorting Test. Journal of Neuroscience Methods. 2005;146:165–173. doi: 10.1016/j.jneumeth.2005.02.005. [DOI] [PubMed] [Google Scholar]
- Nakahara K. Functional MRI of macaque monkeys performing a cognitive set-shifting task. Science. 2002;295:1532–1536. doi: 10.1126/science.1067653. [DOI] [PubMed] [Google Scholar]
- Omori M, Yamada H, Murata T, Sadato N, Tanaka M, Ishii Y, et al. Neuronal substrates participating in attentional set-shifting of rules for visually guided motor selection: A functional magnetic resonance imaging investigation. Neuroscience Research. 1999;33:317–323. doi: 10.1016/s0168-0102(99)00022-x. [DOI] [PubMed] [Google Scholar]
- O’Reilly R, Frank M. Making working memory work: A computational model of learning in the prefrontal cortex and basal ganglia. Neural Computation. 2006;18:283–328. doi: 10.1162/089976606775093909. [DOI] [PubMed] [Google Scholar]
- Pagnoni G, Zink CF, Montague PR, Berns GS. Activity in human ventral striatum locked to errors of reward prediction. Nature Neuroscience. 2002;5:97–98. doi: 10.1038/nn802. [DOI] [PubMed] [Google Scholar]
- Pasupathy A, Miller EK. Different time courses of learning-related activity in the prefrontal cortex and striatum. Nature. 2005;433:873–876. doi: 10.1038/nature03287. [DOI] [PubMed] [Google Scholar]
- Ragozzino ME, Ragozzino KE, Mizumori SJY, Kesner RP. Role of the dorsomedial striatum in behavioral flexibility for response and visual cue discrimination learning. Behavioral Neuroscience. 2002;116:105. doi: 10.1037//0735-7044.116.1.105. [DOI] [PMC free article] [PubMed] [Google Scholar]
- Sawada Y, Nishio Y, Suzuki K, Hirayama K, Takeda A, Hosokai Y, et al. Attentional set-shifting deficit in Parkinson’s disease is associated with prefrontal dysfunction: An FDG-PET study. PLoS One. 2012;7:e38498. doi: 10.1371/journal.pone.0038498. [DOI] [PMC free article] [PubMed] [Google Scholar]
- Schultz W, Apicella P, Scarnati E, Ljungberg T. Neuronal activity in monkey ventral striatum related to the expectation of reward. Journal of Neuroscience. 1992;12:4595–4610. doi: 10.1523/JNEUROSCI.12-12-04595.1992. [DOI] [PMC free article] [PubMed] [Google Scholar]
- Setlow B, Schoenbaum G, Gallagher M. Neural encoding in ventral striatum during olfactory discrimination learning. Neuron. 2003;38:625–636. doi: 10.1016/s0896-6273(03)00264-2. [DOI] [PubMed] [Google Scholar]
- Strait CE, Blanchard TC, Hayden BY. Reward value comparison via mutual inhibition in ventromedial prefrontal cortex. Neuron. 2014;82:1357–1366. doi: 10.1016/j.neuron.2014.04.032. [DOI] [PMC free article] [PubMed] [Google Scholar]
- Strait CE, Sleezer BJ, Blanchard TC, Azab H, Castagno MD, Hayden BY. Neuronal selectivity for spatial position of offers and choices in five reward regions. Journal of Neurophysiology. 2016;115:1098–1111. doi: 10.1152/jn.00325.2015. [DOI] [PMC free article] [PubMed] [Google Scholar]
- Strait CE, Sleezer BJ, Hayden BY. Signatures of value comparison in ventral striatum neurons. PLoS Biology. 2015;13:e1002173. doi: 10.1371/journal.pbio.1002173. [DOI] [PMC free article] [PubMed] [Google Scholar]
- Tricomi E, Balleine BW, O’Doherty JP. A specific role for posterior dorsolateral striatum in human habit learning. European Journal of Neuroscience. 2009;29:2225–2232. doi: 10.1111/j.1460-9568.2009.06796.x. [DOI] [PMC free article] [PubMed] [Google Scholar]
- Vassiliades V, Christodoulou C. Behavioral plasticity through the modulation of switch neurons. Neural Networks. 2016;74:35–51. doi: 10.1016/j.neunet.2015.11.001. [DOI] [PubMed] [Google Scholar]
- Yin HH, Knowlton BJ. The role of the basal ganglia in habit formation. Nature Reviews Neuroscience. 2006;7:464–476. doi: 10.1038/nrn1919. [DOI] [PubMed] [Google Scholar]