



ABSTRACT
Macrophages are the predominant infiltrate in the corneas of mice that have been ocularly infected with herpes simplex virus 1 (HSV-1). However, very little is known about the relative roles of M1 (classically activated or polarized) and M2 (alternatively activated or polarized) macrophages in ocular HSV-1 infection. To better understand these relationships, we assessed the impact of directed M1 or M2 activation of RAW264.7 macrophages and peritoneal macrophages (PM) on subsequent HSV-1 infection. In both the RAW264.7 macrophage and PM in vitro models, HSV-1 replication in M1 macrophages was markedly lower than in M2 macrophages and unstimulated controls. The M1 macrophages expressed significantly higher levels of 28 of the 32 tested cytokines and chemokines than M2 macrophages, with HSV-1 infection significantly increasing the levels of proinflammatory cytokines and chemokines in the M1 versus the M2 macrophages. To examine the effects of shifting the immune response toward either M1 or M2 macrophages in vivo, wild-type mice were injected with gamma interferon (IFN-γ) DNA or colony-stimulating factor 1 (CSF-1) DNA prior to ocular infection with HSV-1. Virus replication in the eye, latency in trigeminal ganglia (TG), and markers of T cell exhaustion in the TG were determined. We found that injection of mice with IFN-γ DNA, which enhances the development of M1 macrophages, increased virus replication in the eye; increased latency; and also increased CD4, CD8, IFN-γ, and PD-1 transcripts in the TG of latently infected mice. Conversely, injection of mice with CSF-1 DNA, which enhances the development of M2 macrophages, was associated with reduced virus replication in the eye and reduced latency and reduced the levels of CD4, CD8, IFN-γ,and PD-1 transcripts in the TG. Collectively, these results suggest that M2 macrophages directly reduce the levels of HSV-1 latency and, thus, T-cell exhaustion in the TG of ocularly infected mice.
IMPORTANCE Our findings demonstrate a novel approach to further reducing HSV-1 replication in the eye and latency in the TG by modulating immune components, specifically, by altering the phenotype of macrophages. We suggest that inclusion of CSF-1 as part of any vaccination regimen against HSV infection to coax responses of macrophages toward an M2, rather than an M1, response may further improve vaccine efficacy against ocular HSV-1 replication and latency.
KEYWORDS: macrophages, infectivity, latency, exhaustion, HSV-1, CSF-1, IFN-γ, polarized, primary infection, reactivation
INTRODUCTION
Macrophage infiltrates play key roles in the immune defense system and are a central component of the innate immune system (1–4). Macrophages exhibit a wide variety of critically important functions, including phagocytosis, cytokine/chemokine secretion, and tumor cytotoxicity (5, 6). Resident macrophages are not detectable in the corneas of naive mice (7, 8), and we have confirmed the lack of resident macrophages in the corneas of uninfected mice by immunostaining using anti-F4/80, as well as anti-CD11b, antibodies (9–11). However, following ocular infection of naive mice with herpes simplex virus 1 (HSV-1), macrophages are readily detectable in the cornea and appear to be the dominant immune cell infiltrate in the eye (11–14). The most effective vaccines against ocular HSV-1 infection in mice completely block macrophages infiltrating into the eyes, whereas the least efficacious vaccines are associated with the persistence of very high levels of infiltrating macrophages (9). Some reports suggest that macrophages exacerbate HSV-1-associated corneal disease (13, 15), while other studies suggest that macrophages protect against it (12, 16). The presence of CD11b+ cells in the cornea correlates with enhanced HSV-1-induced blepharitis, but not corneal scarring, whereas the presence of F4/80+ cells in the cornea correlates with increased corneal scarring (14). Both the extent of the infiltrates and their characteristics can be altered by vaccination against HSV-1 infection (11, 14).
Although it is evident that macrophages likely play a central role in acute and chronic HSV-1 infection, it also is apparent that they can act to either exacerbate or protect against these processes (16–20). We have shown previously that following ocular infection of immunized mice, macrophages are the most abundant infiltrates in the mouse cornea (9, 14). We also have shown that depletion of macrophages increases virus replication in the eyes and trigeminal ganglia (TG) of immunized mice following primary ocular HSV-1 infection (16). Furthermore, we have shown that due to stimulation of macrophages, immunization of mice with a recombinant HSV-1 expressing murine interleukin 12p35 (IL-12p35) was more effective in preventing eye disease and reducing virus replication and latency in the eye than immunization with HSV-1 recombinant viruses expressing IL-2, IL-4, gamma interferon (IFN-γ), or IL-12p40 (21–24). However, depletion of macrophages caused demyelination in the brains, spinal cords, and optic nerves of mice ocularly infected with different strains of wild-type (WT) HSV-1 (25). Macrophages can alter their phenotype on activation by environmental signals (26). The polarization is often viewed on a simplified linear scale, on which M1 (classically polarized) macrophages represent one extreme and M2 (alternatively polarized) macrophages represent the other (26), with the phenotype of polarized macrophages representing a delicate equilibrium between the M1 and M2 profiles (27). M1 macrophages, after induction by proinflammatory mediators, produce significant amounts of proinflammatory cytokines (tumor necrosis factor alpha [TNF-α], IFN-γ, IL-6, and IL-12) and generate reactive oxygen species, including nitric oxide, through activation of inducible nitric oxide synthase (iNOS) (28, 29). In contrast, M2 macrophages, which are induced by exposure to IL-4, IL-13, IL-10 or glucocorticoids, do not secrete high levels of proinflammatory cytokines but produce high levels of anti-inflammatory cytokines (IL-10, transforming growth factor β [TGF-β], and IL-1 receptor antagonist), as well as the enzyme arginase 1 (ARG1) (28, 30). Thus, M2 macrophages are believed to participate in the blockade of inflammatory responses and to promote tissue repair/angiogenesis, as well as TH2 immune responses (29). The corneal disease associated with ocular HSV-1 infection is thought to be mediated by the cytokines and chemokines released from cells that infiltrate the cornea in response to the infection (11, 31, 32). In mice, the longer it takes for the immune system to clear the virus from the eye and the higher the virus load in the eye, the more extensive and protracted the consequent ocular disease (33). The most efficient way to decrease latency and thus subsequent recurrent infections and loss of vision associated with HSV-1 ocular infections is to reduce the virus load in the eye and to accelerate virus clearance in the eye. The responses of the M1 and M2 macrophages to HSV-1 infection are not known. The studies reported here were undertaken to examine these responses and to test the hypothesis that shifting the phenotype of macrophages from that of proinflammatory (M1) macrophages to that of anti-inflammatory (M2) macrophages will play a positive role in control of HSV-1 infection in vitro and in vivo. Macrophage colony-stimulating factor (M-CSF) (also known as colony-stimulating factor 1 [CSF-1]) plays a major role in the development of a number of macrophage populations (34, 35) and is involved in stimulation, proliferation, differentiation, and survival of cells belonging to the monocyte-macrophage lineage (36). It has been shown that administration of M-CSF resulted in a high level of cytotoxic T lymphocyte (CTL) enhancement (37) and improved tumor rejection (38, 39), as well as development of the M2 phenotype (40). In contrast, IFN-γ has immunomodulatory effects on CD4+ TH2 and CD8+ TC2 cells, macrophages, NK cells, and B cells (41, 42), as well as on the development of M1 macrophages (43). Depletion studies have shown that IFN-γ is critical for the antiviral activities of macrophages in vivo (44, 45). Thus, to selectively shift macrophages to the M1 phenotype, we used IFN-γ, and to shift macrophages to the M2 phenotype, we used CSF-1. The macrophage populations generated through these polarization protocols are referred to as M1 and M2 macrophages here. We report that (i) M1 macrophages are refractory to HSV-1 replication in vitro compared to M2 or unpolarized macrophages; (ii) HSV-1-infected M1 macrophages secrete more inflammatory cytokines and chemokines than M2 macrophages or unpolarized macrophages; (iii) injection of mice, prior to ocular HSV-1 infection, with IFN-γ DNA significantly increased the amounts of virus replication in the eye and latency in the TG, whereas injection of mice with CSF-1 DNA reduced virus replication in the eye and the amount of latent virus in TG; (iv) higher latency in IFN-γ DNA-injected mice correlated with greater T cell exhaustion than latency in TG from CSF-1 DNA-injected mice; and (v) the discrepancy between the in vitro and the in vivo studies could be due to the presence of immune cells in vivo.
RESULTS
Effect of macrophage polarization phenotype on HSV-1 replication in RAW264.7 cells and PM.
We reported previously that bone marrow-derived macrophages isolated from wild-type mice are refractory to HSV-1 infection independently of the strain of mouse or virus (46). Here, we generated M1 and M2 macrophages from RAW264.7 cells and mouse peritoneal macrophages (PM). The macrophage cell line RAW264.7, which was derived from C57BL/6 mice following transformation by Abelson leukemia virus, is well characterized and is used extensively to study macrophage functions in vitro (47). The RAW264.7 cells were treated with IFN-γ and lipopolysaccharide (LPS) to generate M1 macrophages and with IL-4 to generate M2 macrophages, as described in detail in Materials and Methods. NOS2 is a marker of M1 macrophage activation, and ARG1 is a marker of M2 activation (48–50). We confirmed that M1 activation significantly increased the levels of NOS2 mRNA expression compared to the unpolarized controls (Fig. 1A) and that M2 polarization increased the expression of ARG1 mRNA compared to the unpolarized controls. While the levels of ARG 1 mRNA in M1 cells were significantly higher than in unpolarized macrophages, they were significantly lower than in the M2 cells (P < 0.05) (Fig. 1B). To determine whether the M1 and M2 phenotypes of the macrophages were altered by HSV-1 infection, the unpolarized M1 and M2 macrophages were mock infected or infected with wild-type HSV-1 strain McKrae (10 PFU/cell) 24 h after their activation. The levels of NOS2 mRNA were similar in the infected and mock-infected M1 cells (Fig. 1A). The levels of NOS2 expression were significantly higher in the infected M1 cells than in the infected, unpolarized cells (P < 0.05) (Fig. 1A), but the levels in infected M2 cells and the uninfected cells were similar. Virus infection had no effect on ARG1 mRNA expression in unpolarized, M1, or M2 macrophages (Fig. 1B).
FIG 1.
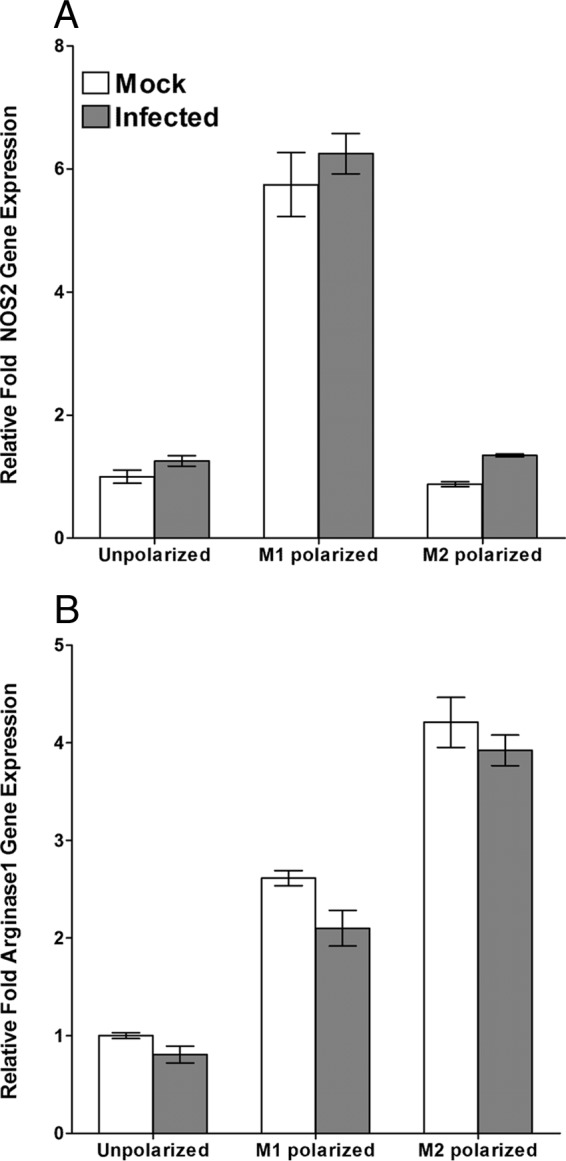
Validation of macrophage polarization in vitro. RAW264.7 cells were polarized into M1 and M2 phenotypes as described in Materials and Methods. M1, M2, and unpolarized control macrophages were infected with 10 PFU per cell of HSV-1 strain McKrae or mock treated for 24 h. Infected and mock-infected cells were harvested, total RNA was isolated, and TaqMan RT-PCR was performed using NOS2- and ARG1-specific primers as described in Materials and Methods. Expression of NOS2 and ARG1 mRNAs was normalized to that of GAPDH RNA. (A) NOS2 mRNA expression. (B) ARG1 mRNA expression. Each point represents the mean ± standard deviation (SD) (n = 3).
To determine whether the replication of HSV-1 differed in the M1 and M2 macrophages, the treated and unpolarized macrophages were infected with wild-type HSV-1 strain McKrae as described above, and the amount of infectious virus was analyzed using a standard plaque assay at 12, 24, or 48 h postinfection (p.i.). The replication of HSV-1 in M1 macrophages was markedly lower than that seen in M2 or unpolarized macrophages at all time points (Fig. 2A). In contrast, the replication pattern in the M2 macrophages was similar to that of the unpolarized macrophages (Fig. 2A). These results suggested that M1 macrophages are either less permissive of HSV-1 infection or less supportive of HSV-1 replication than M2 or unpolarized macrophages.
FIG 2.
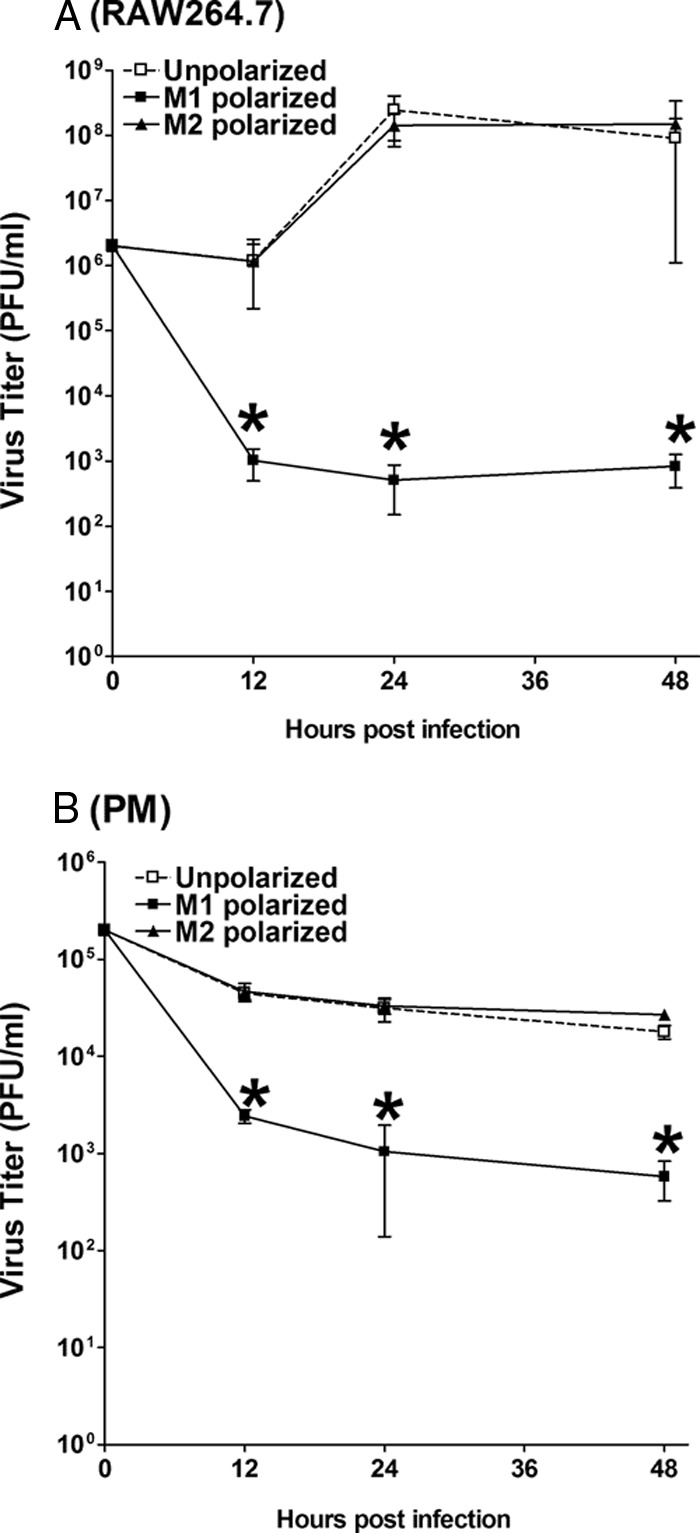
Effect of M1 or M2 macrophage polarization on HSV-1 replication in vitro. RAW264.7 cells and PM from female C57BL/6 mice that had been treated with zymosan were treated with either IFN-γ and LPS to generate M1 macrophages or IL-4 to generate M2 macrophages for 24 h as described in Materials and Methods. The cells were then infected with HSV-1 strain McKrae (10 PFU/cell) for 1 h, and the infected cells were harvested at 12, 24, and 48 h p.i. The virus titer was determined using a standard plaque assay on RS cells. Each point represents the mean ± SD from three separate experiments. (A) RAW264.7 cells. (B) PM. *, P ≤ 0.05.
On examination of the effects of the conditions used for the generation of the M1 macrophages, we found that the virus titers in HSV-1-infected macrophages that had been stimulated with either IFN-γ alone or LPS alone were similar (Fig. 3) (P > 0.05), and in both cases, the virus titers were lower than in the infected unpolarized RAW264.7 cells (Fig. 3) (P < 0.05). The infected macrophages that had been stimulated with a combination of IFN-γ and LPS had significantly lower virus titers than those that had been stimulated with either IFN-γ alone or LPS alone (Fig. 3) (P < 0.01). Thus, both LPS and IFN-γ reduced virus titers in infected cells, suggesting that the reduced virus infectivity is not due to the antiviral function of IFN-γ. In addition, during infection, no IFN-γ or LPS was added to the media.
FIG 3.
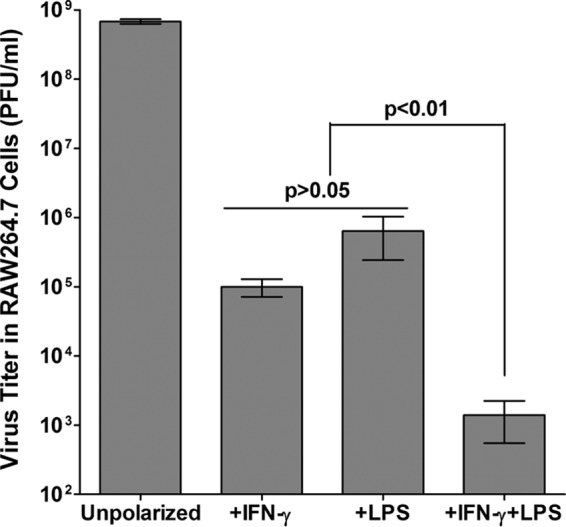
Generation of M1 macrophages in the presence and absence of IFN-γ. M1 macrophages are routinely generated in the presence of both IFN-γ and LPS. M1 macrophages were generated from RAW264.7 cells by treatment with IFN-γ alone or LPS alone and compared with cells generated in the presence of both IFN-γ and LPS. Unstimulated cells were used as controls. The M1 macrophages and unstimulated control macrophages were infected with 10 PFU per cell of HSV-1 strain McKrae for 24 h. The virus yield was determined for each treatment by standard plaque assays as described in Materials and Methods. Each bar represents the mean ± SD (n = 3).
Before extending the studies to analyses of PM, we tested whether the methods used to expand the PM population in vivo affected virus replication in M1 or M2 polarized PM. Both zymosan and thioglycolate are used routinely to expand the PM population but are known to induce mild (zymosan) to strong (thioglycolate) inflammatory conditions (51, 52). C57BL/6 mice were treated with zymosan or thioglycolate, and the PM were isolated as described in Materials and Methods, differentially polarized into M1 or M2 macrophages, and then infected with HSV-1 (10 PFU/cell) for 24 h. No significant differences in the levels of virus replication were found among the unpolarized cells derived from zymosan-treated, thioglycolate-treated, or unpolarized PM (Fig. 4, unpolarized); no significant differences were detected among M1 cells derived from the zymosan-treated, thioglycolate-treated, or unpolarized PM (Fig. 4, M1); and no significant differences were detected among M2 cells derived from zymosan-treated, thioglycolate-treated, or unpolarized PM (Fig. 4, M2). Although thioglycolate treatment resulted in the best PM yield, it induced strong inflammatory responses in the treated mice, whereas zymosan treatment generated a satisfactory PM yield and only a mild inflammatory response (data not shown). Thus, in all subsequent experiments, we used zymosan to expand the population of PM.
FIG 4.
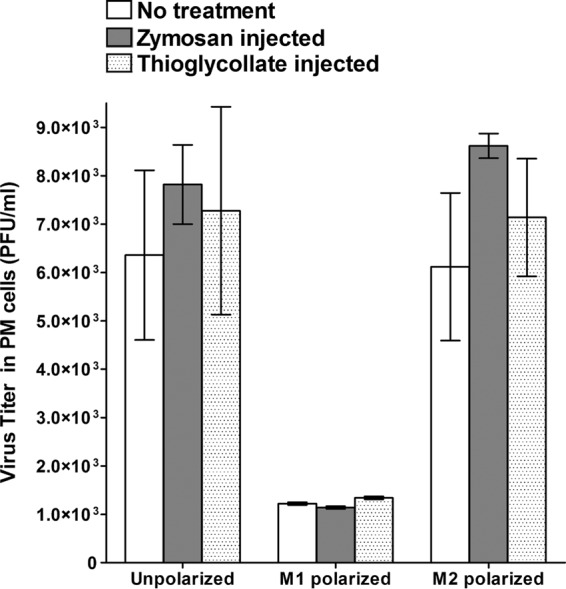
Effects of zymosan and thioglycolate on HSV-1 replication in PM. Mice were treated with zymosan or thioglycolate or left unpolarized as described in Materials and Methods. PM from treated mice were harvested, and M1 and M2 macrophages were generated as described in Materials and Methods. Unstimulated PM were used as controls. The M1, M2, and unstimulated control macrophages were infected with 10 PFU per cell of HSV-1 strain McKrae or mock infected for 24 h. The cells were then harvested, and the virus yield was determined for each treatment by standard plaque assays as described in Materials and Methods. Each bar represents the mean ± SD (n = 3).
PM harvested from zymosan-treated C57BL/6 mice were exposed to macrophage activation stimuli and infected with HSV-1 using the protocol described above. Similar to RAW264.7 cells, the virus titers from cells obtained 12 h to 48 h p.i. were lower in the M1 PM than in the unpolarized PM or M2 PM (Fig. 2B). Notably, in the cells that were analyzed at 12 h p.i., the virus titers in the M1 macrophages were approximately 100-fold lower than the virus titers in the unpolarized or M2 macrophages (Fig. 2B) (P < 0.01 for all). Overall, these results suggest that M1-polarized RAW264.7 cells and PM are significantly more refractory to HSV-1 replication than their unpolarized or M2-polarized counterparts in vitro.
Effects of HSV-1 receptors on virus infectivity in M1 and M2 cells in vitro.
To explore the mechanism(s) that may result in lower virus replication in the RAW264.7- and PM-derived M1 cells, we first tested whether there were alterations in the HSV-1 receptors in the M1 macrophages that could affect infectivity. HSV-1 utilizes several routes of entry to initiate the infection of cells, including herpesvirus entry mediator (HVEM) (TNFRSF14), Nectin-1, Nectin-2, 3-O-sulfated heparan sulfate (3-OS-HS), and paired immunoglobulin-like type 2 receptor (PILRα) (53–55). This apparent redundancy of HSV-1 receptors may contribute to the ability of HSV-1 to infect many different cell types (53, 55–59). M1 and M2 macrophages were generated from RAW264.7 cells and PM and infected with HSV-1 (10 PFU/cell) for 24 h or mock infected as described above. The levels of HVEM, nectin-1, nectin-2, 3-OS-HS, and PILRα mRNAs were then determined by quantitative real-time PCR (qRT-PCR) analysis. Overall, the results showed considerable variability in the expression of the HSV-1 receptors between M1 macrophages and M2 macrophages and also between M1 and M2 macrophages generated from RAW264.7 cells and PM (Fig. 5). The levels of HVEM mRNA were similar in the infected and mock-infected M1 macrophages generated from RAW264.7 cells, and the levels of HVEM mRNA were higher in these cells than in the infected and mock-infected unpolarized RAW264.7 cells or M2 macrophages generated from RAW264.7 cells (Fig. 5A, RAW264.7). The levels of HVEM mRNA were lower in the mock-infected M1 and M2 macrophages generated from PM than in their mock-infected RAW264.7 counterparts (Fig. 5A, PM). In contrast to the M1 and M2 macrophages generated from RAW264.7 cells, infection suppressed the levels of HVEM mRNA in the M1 and M2 macrophages generated from PM, and the differences between the infected and mock-infected PM were statistically significant (Fig. 5A, PM; P < 0.05). The levels of nectin-1 mRNA expression in M1 cells derived from RAW264.7 cells with and without infection were significantly lower than in the unpolarized RAW264.7 cells or M2 macrophages generated from RAW264.7cells (Fig. 5B, RAW264.7). Mock-infected unpolarized PM had significantly higher nectin-1 mRNA expression than the mock-infected M1 and M2 PM (Fig. 5B, PM; P < 0.05). The expression of nectin-1 mRNA was lower in all the infected PM than in their uninfected counterparts (Fig. 5B, PM; P < 0.05). With regard to nectin-2 mRNA levels, no significant differences were found among the RAW264.7-derived polarized macrophages (Fig. 5C, RAW264.7) or PM-derived polarized macrophages (Fig. 5C, PM). The levels of nectin-2 mRNA in M1 macrophages generated from PM with and without infection were similar to each other and were higher than in any of the other groups of RAW264.7- or PM-derived cells (Fig. 5C, Nectin-2). The levels of PILRα mRNA were high in the unpolarized RAW264.7 cells and the M1 macrophages generated from the RAW264.7 cells, and infection had no effect on the levels of expression in these cells. The levels of PILRα mRNA were significantly lower in the mock-infected M2 macrophages generated from RAW264.7 cells and were not detectable in the infected M2 macrophages generated from the RAW264.7 cells (Fig. 5D, RAW264.7). The levels of PILRα in the mock-infected PM were significantly higher than in the infected, unpolarized PM, as well as significantly higher in both the M1 and M2 PM irrespective of their infection status (Fig. 5D, PM; P < 0.05). However, infection had no effect on the levels of PILRαR mRNA in the M1 or M2 PM compared with their unpolarized counterparts (Fig. 5D, PM; P < 0.05). 3-OS-HS mRNA was detected in the mock-infected, unpolarized RAW264.7 cells but was not detectable in the mock-infected or infected M1 or M2 macrophages generated from RAW264.7 cells (Fig. 5E, RAW264.7). In contrast, the uninfected M1 macrophages generated from PM had high levels of 3-OS-HS mRNA expression, but it was undetectable in the mock-infected unpolarized and M2 macrophages generated from PM (Fig. 5E, PM). Infection increased the levels of 3-OS-HS mRNA expression in the unpolarized and M2 macrophages generated from PM (Fig. 5E, PM). Thus, both activation of the macrophages and infection affected the expression of the HSV-1 receptors, and in some cases, these effects appeared to reflect an interaction between the two processes. However, no clear patterns emerged that would suggest an association between these effects and the lower virus replication in the M1 macrophages than in the M2 macrophages or unpolarized cells.
FIG 5.

Effects of M1 or M2 polarization on the expression of major HSV-1 receptors. M1 and M2 macrophages were generated from RAW264.7 cells and PM as described in Materials and Methods. M1, M2, and unpolarized control macrophages were infected with HSV-1 strain McKrae (10 PFU per cell) or mock infected for 24 h. Infected and mock-infected cells were harvested, the total RNA was isolated, and TaqMan RT-PCR was carried out using HVEM-, Nectin-1-, Nectin-2-, PILRα-, and 3-OS-HS-specific primers as described in Materials and Methods. Expression of each gene was normalized to that of GAPDH mRNA. Each point represents the mean ± SD (n = 3). (A) HVEM mRNA. (B) Nectin-1 mRNA. (C) Nectin-2 mRNA. (D) PILRα mRNA. (E) 3-OS-HS mRNA.
Differences in chemokine and cytokine expression in M1 and M2 macrophages.
To explore the potential roles of cytokines and/or chemokines, M1 and M2 macrophages were generated from RAW264.7 cells and PM and infected with HSV-1 strain McKrae (10 PFU/cell) as described above. The culture media from the wells containing the infected and mock-infected cells were collected at 24 h p.i., and the levels of cytokines and chemokines in the culture media were determined using Illumina mouse 32-plex panels. The results for the RAW264.7-derived cells are shown in Table 1, and the results for the PM-derived cells are shown in Table 2.
TABLE 1.
Selected cytokine/chemokine levels in M1 and M2 RAW264.7 cell lines before and after infection with HSV-1a
| No. | Cytokine or chemokine | Level (pg/ml) (mean ± SD) |
|||||
|---|---|---|---|---|---|---|---|
| Unactivated macrophages |
M1 |
M2 |
|||||
| Mock | Infected | Mock | Infected | Mock | Infected | ||
| 1 | G-CSF | 103.5 ± 2.5 | 96.4 ± 8.9 | 4,569.5 ± 297.7 | 5,519.5 ± 770.0 | 162.1 ± 14.8 | 181.8 ± 21.8 |
| 2 | Eotaxin | 8.8 ± 0.5 | 14.4 ± 3.1 | 18.4 ± 1.4 | 21.7 ± 2.8 | 9.8 ± 0.7 | 10.3 ± 2.1 |
| 3 | GM-CSF | 17.3 ± 0.2 | 11.2 ± 5.1 | 26.9 ± 5.0 | 21.0 ± 18.2 | 7.1 ± 8.4 | 13.2 ± 7.9 |
| 4 | IFN-γ | 2.7 ± 0.9 | 5.9 ± 2.3 | 48.3 ± 5.9 | 51.6 ± 5.6 | 3.3 ± 1.0 | 3.1 ± 0.3 |
| 5 | IL-1α | 19.0 ± 6.4 | 30.1 ± 6.2 | 101.3 ± 8.4 | 116.1 ± 26.4 | 27.5 ± 3.8 | 27.3 ± 8.4 |
| 6 | IL-1β | 13.2 ± 2.3 | 10.7 ± 5.7 | 24.6 ± 2.8 | 27.8 ± 7.0 | 11.0 ± 4.5 | 16.1 ± 1.6 |
| 7 | IL-2 | <1.7 (BDb) | 2.8 ± 0.6 | 2.8 ± 0.4 | 3.2 ± 1.0 | 2.0 | 1.8 |
| 8 | IL-4 | <2.4 (BD) | <2.4 (BD) | <2.4 (BD) | <2.4 (BD) | 9.2 ± 0.5 | 12.6 ± 0.4 |
| 9 | IL-3 | <2.5 (BD) | 8.2 ± 1.0 | 2.7 | 3.3 ± 0.5 | <2.5 (BD) | 7.9 ± 0.6 |
| 10 | IL-5 | 1.5 | 2.1 ± 0.9 | 18.8 ± 3.9 | 13.9 ± 5.5 | 1.5 ± 0.3 | 4.2 ± 0.2 |
| 11 | IL-6 | 5.7 ± 0.2 | 13.5 ± 0.2 | 2,594.5 ± 149.2 | 3,972.5 ± 644.2 | 13.0 ± 1.9 | 18.4 ± 1.0 |
| 12 | IL-7 | 6.5 ± 0.3 | 4.3 ± 2.2 | 8.6 ± 0.5 | 9.7 ± 0.6 | 5.4 ± 3.1 | 6.2 ± 0.4 |
| 13 | IL-9 | 43.0 ± 23.9 | 86.0 ± 17.7 | 133.5 ± 6.2 | 134.5 ± 2.4 | 55.0 ± 6.0 | 68.1 ± 18.2 |
| 14 | IL-10 | 335.2 ± 9.1 | 346.3 ± 24.1 | 770.1 ± 53.3 | 902.3 ± 104.2 | 329.2 ± 32.4 | 352.5 ± 12.2 |
| 15 | IL-12 (p40) | 4.9 ± 0.3 | 6.9 ± 2.8 | 8.8 ± 1.6 | 6.4 ± 2.5 | 5.6 ± 0.7 | 3.9 ± 0.5 |
| 16 | IL-12 (p70) | 2.2 ± 0.3 | 8.6 ± 0.9 | 20.2 ± 4.7 | 12.7 ± 5.7 | 4.6 ± 0.3 | 9.1 ± 0.7 |
| 17 | LIF | 0.7 ± 0.0 | 4.0 ± 0.5 | 6.1 ± 0.3 | 7.4 ± 0.6 | 2.2 ± 0.3 | 4.3 ± 0.2 |
| 18 | IL-13 | 46.6 ± 0.5 | 45.5 ± 20.9 | 157.1 ± 40.5 | 169.9 ± 3.4 | 48.2 ± 11.3 | 39.5 ± 2.0 |
| 19 | LIX | 41.2 ± 31.8 | 37.7 ± 10.1 | 84.9 ± 22.2 | 86.5 ± 25.3 | 58.2 ± 32.2 | 35.0 ± 2.0 |
| 20 | IL-15 | 49.6 ± 16.3 | 56.8 ± 10.5 | 61.6 ± 8.5 | 54.9 ± 6.2 | 45.7 ± 19.1 | 46.8 ± 13.5 |
| 21 | IL-17 | <3.9 (BD) | <3.9 (BD) | 4.9 ± 0.8 | 5.0 ± 1.3 | <3.9 (BD) | <3.9 (BD) |
| 22 | IP-10 | 111.6 ± 12.2 | 559.0 ± 14.4 | 5,342.5 ± 1,389.5 | 3,658.0 ± 806.1 | 215.5 ± 11.9 | 663.9 ± 41.9 |
| 23 | KC | <0.9 (BD) | 5.1 ± 0.4 | 41.6 ± 3.5 | 37.4 ± 5.9 | <0.9 (BD) | 7.8 ± 0.7 |
| 24 | MCP-1 | 125.3 ± 8.3 | 296.4 ± 12.8 | 5,259.5 ± 456.1 | 4,907.5 ± 842.2 | 332.4 ± 19.5 | 515.5 ± 1.6 |
| 25 | MIP-1α | 5,148.5 ± 755.9 | 4,630.0 ± 46.7 | 8,874.5 ± 324.6 | 9,674.0 ± 1,452.4 | 7,451.0 ± 301.2 | 7,034.0 ± 41.0 |
| 26 | MIP-1β | 4,437.0 ± 550.1 | 4,982.5 ± 135.1 | 14,787.0 ± 5,078.4 | 12,433.5 ± 4,280.1 | 5,668.0 ± 207.9 | 6,378.5 ± 41.7 |
| 27 | M-CSF | 3.1 ± 1.7 | 3.6 ± 0.3 | 10.3 ± 2.1 | 7.0 ± 0.1 | 3.0 ± 0.8 | 3.9 ± 0.8 |
| 28 | MIP-2 | 313.4 ± 24.6 | 413.0 ± 12.7 | 981.8 ± 37.0 | 1,244.5 ± 95.5 | 390.5 ± 55.6 | 384.0 ± 15.5 |
| 29 | MIG | <15.7 (BD) | <15.7 (BD) | 586.3 ± 30.0 | 514.7 ± 64.0 | <5.7 (BD) | <15.7 (BD) |
| 30 | RANTES | 4.3 ± 0.8 | 15.7 ± 1.1 | 274.5 ± 36.3 | 251.1 ± 50.1 | 6.7 ± 0.1 | 16.9 ± 0.2 |
| 31 | VEGF | 37.6 ± 4.3 | 53.6 ± 1.1 | 660.6 ± 7.2 | 633.4 ± 74.0 | 27.0 ± 2.4 | 32.8 ± 0.9 |
| 32 | TNF-α | 12.6 ± 0.7 | 71.3 ± 2.8 | 64.8 ± 4.9 | 85.5 ± 12.9 | 14.1 ± 1.8 | 49.7 ± 2.0 |
Cytokine and chemokine levels in the culture media were analyzed using mouse 32-plex panels. Details of the experimental procedures are described in Materials and Methods. Briefly, cells were exposed to either IFN-γ with LPS or IL-4 and allowed to undergo M1 and M2 activation, respectively. After 24 h of exposure, the cells were infected with 10 PFU/cell of HSV-1 strain McKrae for 1 h at 37°C, washed with PBS, and incubated for an additional 24 h in fresh medium.
BD, below detection level.
TABLE 2.
Selected cytokine/chemokine levels in M1 and M2 PM before and after infection with HSV-1a
| No. | Cytokine or chemokine | Level (pg/ml) (mean ± SD) |
|||||
|---|---|---|---|---|---|---|---|
| Unactivated macrophages |
M1 |
M2 |
|||||
| Mock | Infected | Mock | Infected | Mock | Infected | ||
| 1 | G-CSF | 3.3 ± 0.2 | 97.2 ± 9.5 | 1,393.5 ± 146.4 | 2,296.0 ± 50.9 | 5.5 ± 0.8 | 74.5 ± 22.5 |
| 2 | Eotaxin | <3.9 (BDb) | 7.7 ± 2.5 | 12.7 ± 3.3 | 18.0 ± 1.6 | 31.9 ± 1.7 | 25.4 ± 8.6 |
| 3 | GM-CSF | 4.8 | 6.0 ± 2.3 | 13.7 ± 2.8 | 20.0 ± 6.1 | 11.1 ± 5.2 | 31.4 ± 2.9 |
| 4 | IFN-γ | 1.7 | 2.6 ± 1.6 | >21,464 (ADc) | >21,464 (AD) | 3.7 ± 0.7 | 2.6 ± 0.536 |
| 5 | IL-1α | 4.8 | 20.2 ± 3.4 | 180.5 ± 3.6 | 196.5 ± 8.2 | 9.7 ± 1.6 | 23.9 ± 13.3 |
| 6 | IL-1β | 8.3 | 23.9 | 19.0 ± 15.6 | 17.4 ± 5.3 | 23.7 ± 1.0 | 17.2 ± 7.1 |
| 7 | IL-2 | <1.7 (BD) | 1.7 | <1.7 (BD) | 3.4 ± 0.9 | 2.0 | 5.1 |
| 8 | IL-4 | <2.4 (BD) | <2.4 (BD) | <2.4 (BD) | <2.4 (BD) | >13,537 (AD) | >13,537 (AD) |
| 9 | IL-3 | <2.54 (BD) | <2.54 (BD) | <2.54 (BD) | 2.9 ± 0.5 | <2.5 (BD) | <2.5 (BD) |
| 10 | IL-5 | <0.5 (BD) | 2.3 ± 1.5 | 4 ± 0.6 | 7.0 ± 1.4 | 4.9 ± 1.3 | 7.6 ± 0.5 |
| 11 | IL-6 | 82.9 ± 39.3 | 112.34 ± 22.8 | 1,975.5 ± 368.4 | 4,336.0 ± 343.6 | 302.0 ± 17.6 | 302.1 ± 72.2 |
| 12 | IL-7 | 3.1 | 4.6 ± 1.3 | 5.7 ± 0.4 | 7.0 ± 3.5 | 3.1 ± 0.5 | 3.5 ± 0.9 |
| 13 | IL-9 | <2.7 (BD) | 16.5 | 61.7 ± 11.1 | 111.9 ± 14.5 | 26.7 ± 9.8 | 47.6 ± 17.5 |
| 14 | IL-10 | 5.4 | 11.2 ± 4.3 | 29.3 ± 1.6 | 40.1 ± 10.4 | 30.8 ± 0.9 | 21.6 ± 4.5 |
| 15 | IL-12 (p40) | 4.2 | 4.0 ± 2.2 | 10.3 ± 1.0 | 12.7 ± 0.01 | 4.8 ± 0.5 | 4.4 ± 2.2 |
| 16 | IL-12 (p70) | <0.6 (BD) | 2.6 ± 1.8 | 11.6 ± 2.3 | 19.1 ± 4.8 | 4.8 ± 2.1 | 13.0 ± 2.1 |
| 17 | LIF | 13.9 ± 8.1 | 14.4 ± 1.8 | 10.9 ± 0.9 | 10.2 ± 0.2 | 18.0 ± 0.5 | 14.8 ± 3.4 |
| 18 | IL-13 | 25.0 ± 2.2 | 43.5 ± 10.2 | 134.4 ± 17.3 | 185.4 ± 8.1 | 51.5 ± 14.6 | 104.2 ± 22.6 |
| 19 | LIX | <16.0 (BD) | <16.0 (BD) | 125.6 ± 39.5 | 154.6 ± 3.2 | <16.0 (BD) | 43.9 ± 30.0 |
| 20 | IL-15 | <2.0 (BD) | 8.4 | 20.5 ± 1.7 | 33.7 ± 5.4 | 19.8 | 23.0 ± 7.1 |
| 21 | IL-17 | <3.8 (BD) | <3.8 (BD) | <3.8 (BD) | <3.8 (BD) | <3.8 (BD) | <3.8 (BD) |
| 22 | IP-10 | 8.1 ± 3.1 | 1,893.5 ± 183.1 | 2,966.0 ± 9.9 | 5,769.0 ± 879.6 | 19.8 ± 0.2 | 2,379.5 ± 661.1 |
| 23 | KC | 20.2 ± 13.7 | 524.2 ± 73.3 | 1,443.5 ± 75.7 | 1,961.5 ± 9.2 | 98.8 ± 0.9 | 410.4 ± 117.5 |
| 24 | MCP-1 | 54.4 ± 19.5 | 522.8 ± 60.9 | 418.2 ± 38.2 | 778.3 ± 21.9 | 721.9 ± 60.1 | 1,343.5 ± 212.8 |
| 25 | MIP-1α | 7.8 | 476.4 ± 78.4 | 88.0 ± 12.6 | 419.3 ± 10.0 | 15.3 ± 0.1 | 204.4 ± 37.4 |
| 26 | MIP-1β | 15.8 ± 11.5 | 1,778.0 ± 330.9 | 134.7 ± 8.0 | 1,132.0 ± 17.0 | 26.9 ± 0.3 | 999.4 ± 200.2 |
| 27 | M-CSF | 2.3 | 6.6 ± 2.5 | 8.5 ± 3.4 | 11.8 ± 2.8 | 5.7 ± 4.9 | 5.8 ± 1.6 |
| 28 | MIP-2 | 49.7 | 673.9 ± 119.1 | 3,480.0 ± 284.3 | 4,319.0 ± 74.9 | 52.3 ± 15.0 | 417.1 ± 82.9 |
| 29 | MIG | <15.7 (BD) | <15.7 (BD) | 1,246.5 ± 130.8 | 1,425.0 ± 28.3 | <15.7 (BD) | <15.7 (BD) |
| 30 | RANTES | <1.1 (BD) | 43.0 ± 7.9 | 2,110.0 ± 84.8 | 2,938.5 ± 347.2 | 3.7 ± 0.1 | 23.8 ± 4.9 |
| 31 | VEGF | 41.1 ± 24.8 | 19.2 ± 2.1 | 195.5 ± 34.7 | 252.0 ± 6.7 | 21.0 ± 1.2 | 30.4 ± 10.9 |
| 32 | TNF-α | 3.2 | 62.9 ± 6.9 | 177.2 ± 20.4 | 270.7 ± 5.1 | 6.6 ± 1.0 | 43.3 ± 8.9 |
Cytokine and chemokine levels in the culture media were analyzed using mouse 32-plex panels. PM from wild-type C57BL/6 mice were used in the experiment. Details of the experimental procedures are described in Materials and Methods. Briefly, cells were exposed to either IFN-γ with LPS or IL-4 and allowed to undergo M1 and M2 activation, respectively. After 24 h of exposure, the cells were infected with 10 PFU/cell of HSV-1 strain McKrae for 1 h at 37°C, washed with PBS, and incubated for an additional 24 h in fresh medium.
BD, below detection level.
AD, above detection level.
As shown in Table 1, in the RAW264.7-derived cells, except for IFN-γ, which was added to the media, levels of IL-4, and IL-3, granulocyte colony-stimulating factor (G-CSF), eotaxin, granulocyte-macrophage colony-stimulating factor (GM-CSF), IL-1α, IL-1β, IL-2, IL-5, IL-6, IL-7, IL-9, IL-10, IL-12 (p40), IL-12 (p70), LIF, IL-13, LIX, IL-15, IL-17, IP-10, KC, monocyte chemoattractant protein 1 (MCP-1), MIP-1α, MIP-1β, M-CSF, MIP-2, MIG, RANTES, vascular endothelial growth factor (VEGF), and TNF-α were higher in M1 than in M2 macrophages under both uninfected and infected conditions. IL-3 was the only cytokine that was expressed at higher levels in the infected M2 macrophages than in the infected M1 macrophages. As shown in Table 2, in both uninfected and infected PM, the levels of G-CSF, IL-1α, IL-6, IL-9, IL-12 (p40), IL-12 (p70), IL-13, LIX, IP-10, KC, MIP-1α, MIP-1β, M-CSF, MIP-2, MIG, RANTES, VEGF, and TNF-α were higher in the supernatants of the M1 macrophages than in those of the M2 macrophages. In both the uninfected and infected cells, the levels of eotaxin, LIF, and MCP-1 were higher in the M2 macrophages than in the M1 macrophages. IL-10 and IL-15 were higher in the infected but not the uninfected M1 macrophages than in the M2 macrophages. In contrast, the levels of GM-CSF were higher in the infected, but not in the uninfected, M1 macrophages than in the M2 macrophages.
The above-described results suggested that the M1 macrophages secreted more cytokines and chemokines than the M2 macrophages, which potentially could contribute to the lower virus replication in the M1-polarized cells. As interferons have potent immunomodulatory and antiviral functions (60–62), we also looked at the possible contribution of type I IFNs (IFN-α and IFN-β) to these differences. PM were used to generate M1 and M2 macrophages, which were then mock infected or infected with HSV-1 (10 PFU/cell) for 24 h, as described above. The mRNA levels of IFN-α and IFN-β in the cells were determined by qRT-PCR analysis as described in Materials and Methods. The levels of IFNα mRNA were significantly higher in the infected, unpolarized PM and the M2 macrophages than in their mock-infected counterparts (Fig. 6A) (P < 0.0001), whereas no significant difference was found between the levels of IFNα mRNA in the infected and mock-infected M1 macrophages (Fig. 6A) (P > 0.05). The patterns of IFNβ mRNA expression were similar to those of IFNα mRNA (compare Fig. 6A with B).
FIG 6.
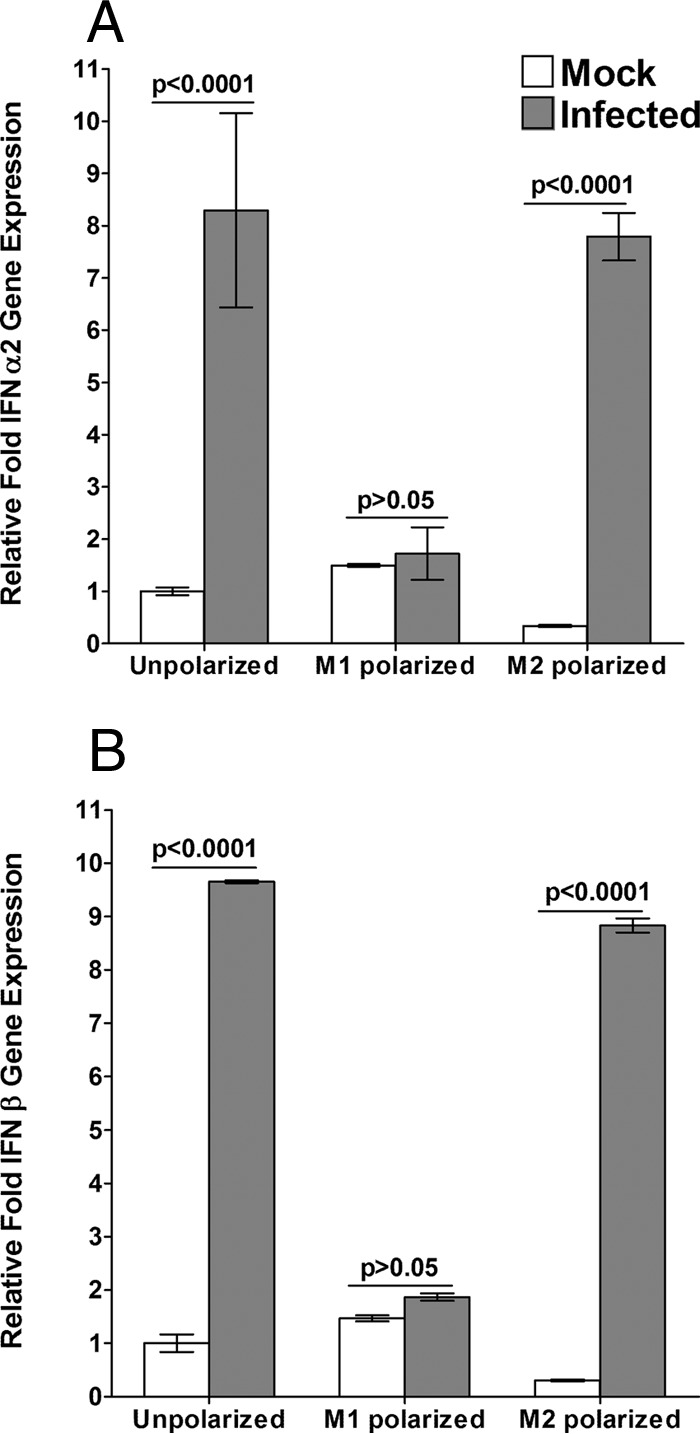
Expression of IFN-α and IFN-β in M1 and M2 macrophages. PM were isolated from C57BL/6 mice, and M1 and M2 macrophages were derived and infected with HSV-1 or mock infected as for Fig. 5. Total RNA from infected and mock-infected cells was isolated, and TaqMan RT-PCR was performed using IFN-α- and IFN-β-specific primers as described in Materials and Methods. Expression of each gene was normalized to that of GAPDH mRNA. Each point represents the mean ± SD (n = 3). (A) IFN-α mRNA. (B) IFN-β mRNA.
In summary, these results suggested that the M1 macrophages exhibited higher secretion of a significant number of cytokines and chemokines than the M2 macrophages. This may explain the lower virus replication in the M1 macrophages than in the M2 macrophages. However, the lack of an apparent association of specific patterns of expression of type I IFNs with HSV-1 infection of the M1 macrophages suggests that this family of cytokines does not play a critical role in defining virus replication in these cells.
Effects of CSF-1 and IFN-γ injections on shifting the activation status of macrophages in vivo.
Our in vitro studies with RAW264.7 cells and PM described above showed that M1 macrophages are more resistant to HSV-1 replication than M2 macrophages and also produce more inflammatory chemokines and cytokines. Due to the critical role that macrophages play in orchestrating immune responses, there is increasing interest in using signals that are known to polarize macrophages in order to improve vaccine efficacy. Previously, we found that treatment of mice with either FMS (i.e., McDonough feline sarcoma viral [v-fms] oncogene homolog)-like tyrosine kinase 3 ligand (Flt3L) DNA or GM-CSF DNA increases the number of dendritic cells (DCs) (63). We therefore decided to determine if we could shift the immune response in vivo using inducers of M1 versus M2 macrophages. IFN-γ is known to shift macrophages toward an M1 phenotype, whereas CSF-1 shifts them toward an M2 phenotype (50). The mice were injected intramuscularly (i.m.) with CSF-1 DNA, IFN-γ DNA, or vector DNA three times, as described in detail in Materials and Methods, and then ocularly infected with HSV-1 strain McKrae. Macrophages were harvested from the peritoneal cavity and spleens of the mice prior to infection (day 0) and on days 3 and 7 p.i. The cells were then stained with anti-F4/80 antibody to detect any changes in the total macrophage population, with anti-Ly6C to detect M1 macrophages, and with anti-CD206 antibodies to detect M2 macrophages (64–66) and analyzed using flow cytometry.
Before ocular infection, the percentages of F4/80+ cells in the PM population were higher in the IFN-γ-treated mice than in the vector control group (64% versus 59%) or CSF-1 DNA-treated mice (64% versus 45%) (Fig. 7A, day 0). The percentages of F4/80+ cells in the PM had declined in IFN-γ DNA-treated mice by day 3 p.i. (Fig. 7A, day 3 p.i.) and then increased again on day 7 (Fig. 7A, day 7 p.i.) but remained unaltered in the vector-treated and CSF-1 DNA-treated mice through day 7 p.i. (Fig. 7A, day 3 p.i. and day 7 p.i.). M1 macrophages were undetectable in the PM of mice treated with CSF-1 DNA, IFN-γ DNA, or vector control at any of the time points (Fig. 7B). The percentages of M2 macrophages were higher in the CSF-1 DNA-treated mice than in the vector control group or the IFN-γ DNA-treated mice prior to ocular infection and remained higher on day 3 p.i. (Fig. 7B, day 0 and day 3 p.i.). However, by day 7 p.i., the percentages of M2 macrophages were similar in the CSF-1 DNA-treated and IFN-γ DNA-treated mice (Fig. 7B, day 7 p.i.).
FIG 7.


Flow cytometry analysis of macrophages isolated from CSF-1- and IFN-γ-injected mice. Mice were injected intramuscularly three times with CSF-1 DNA, IFN-γ DNA, or vector DNA as described in Materials and Methods. Macrophages from the peritoneal cavity (PM) and spleen (SP) of each group were harvested prior to infection (day 0) and on days 3 and 7 post-ocular infection with HSV-1 strain McKrae (2 × 10⁵ PFU/eye). The cells were stained with FITC-F4/80, Pacific Blue-Ly6C, and allophycocyanin (APC)-CD206 antibodies and subjected to flow cytometry analysis. (A) PM, F4/80+. (B) PM, F4/80+ Ly6C+ CD206+. (C) SP, F4/80+. (D) SP, F4/8+ Ly6C+ CD206+.
In contrast to the differences in the levels of F4/80+ cells in PM from CSF-1 DNA- or IFN-γ DNA-treated mice, the percentages of F4/80+ cells in the spleens of the mice were similar in the CSF-1 DNA-, IFN-γ DNA-, and vector-treated mice before infection and on days 3 and 7 p.i. (Fig. 7C). Prior to infection, the percentages of M1 cells in the spleens of the CSF-1 DNA- and vector control-treated mice were similar (Fig. 7D, day 0) (10% versus 11%), whereas they were significantly higher in the spleens of the IFN-γ DNA-treated mice than in those of the CSF-1 DNA-treated mice (Fig. 7D, day 0) (32% versus 10%). By day 3 p.i., the numbers of M1 macrophages increased in both the CSF-1 DNA-treated and vector-treated mice but declined in the IFN-γ DNA-treated mice (Fig. 7D, day 3 p.i.). However, by day 7 p.i., the numbers of M1 macrophages decreased in both the CSF-1 DNA- and vector-treated mice while it increased in the IFN-γ DNA-treated mice (Fig. 7D, day 7 p.i.). The populations of M2 macrophages in the spleens of injected mice were similar in the CSF-1 DNA-, IFN-γ DNA-, and vector-treated mice on day 0 and day 3 p.i. (Fig. 7D, day 0 and day 3 p.i.). In contrast, the numbers of M2 macrophages on day 7 p.i. in CSF-1 DNA-treated mice were the same as on days 0 and 3 p.i., while the size of this population had declined in IFN-γ DNA-treated mice (Fig. 7D, day 7 p.i.).
Collectively, these results indicated the following. (i) Injection of mice with IFN-γ DNA increased the population of F4/80+ cells in the peritoneum but had no significant effect on this population in the spleen. In contrast, injection of CSF-1 DNA had no significant effect on this population in either the peritoneum or the spleen. (ii) Injection of mice with CSF-1 increased the M2 macrophage population in the peritoneum, but no M1 macrophages were detectable. (iii) Injection of mice with IFN-γ DNA generated M1 macrophages, whereas injection of CSF-1 DNA generated M2 macrophages in the spleen. (iv) Infection increased the population of M1 macrophages while decreasing the population of M2 macrophages in vivo. Overall, we observed a tissue-specific effect of DNA immunization, as well as HSV-1 infection, on the activation profile of macrophages, indicating that a shift to M1 or M2 can be generated in vivo.
Effects of CSF-1 and IFN-γ injection on clearance of virus from eyes.
We next tested if macrophage polarization protocols can affect the course of ocular HSV-1 infection. Ten mice per group were administered CSF-1 DNA, IFN-γ DNA, or vector DNA, or were mock treated as described in Materials and Methods. Three weeks after the third injection, the mice were infected intraocularly with HSV-1 strain McKrae (2 × 10⁵ PFU/eye). Tear films were collected daily from both eyes on days 1 to 6 p.i., and the amount of virus in each eye was determined by standard plaque assays. As shown in Fig. 8, all the mice that were administered DNA had lower peak virus titers per eye than the mock-injected mice on days 2 and 3 p.i. (Fig. 8) (P < 0.01). The levels of virus titers in the eyes of mice that were administered vector DNA were similar to the levels in the mock-injected mice (Fig. 8). The peak virus titer per eye on days 2, 3, 5, and 6 p.i. was significantly lower in mice administered CSF-1 DNA than in mice administered IFN-γ DNA (P < 0.05; Student's t test), as was the range of virus titers (0 to 1,160 PFU/eye versus 0 to 3,040 PFU/eye) (data not shown). Taken together with our other results, these findings suggest that administration of CSF-1 DNA is more effective than administration of IFN-γ DNA in promoting clearance of HSV-1 from the eyes of infected mice.
FIG 8.
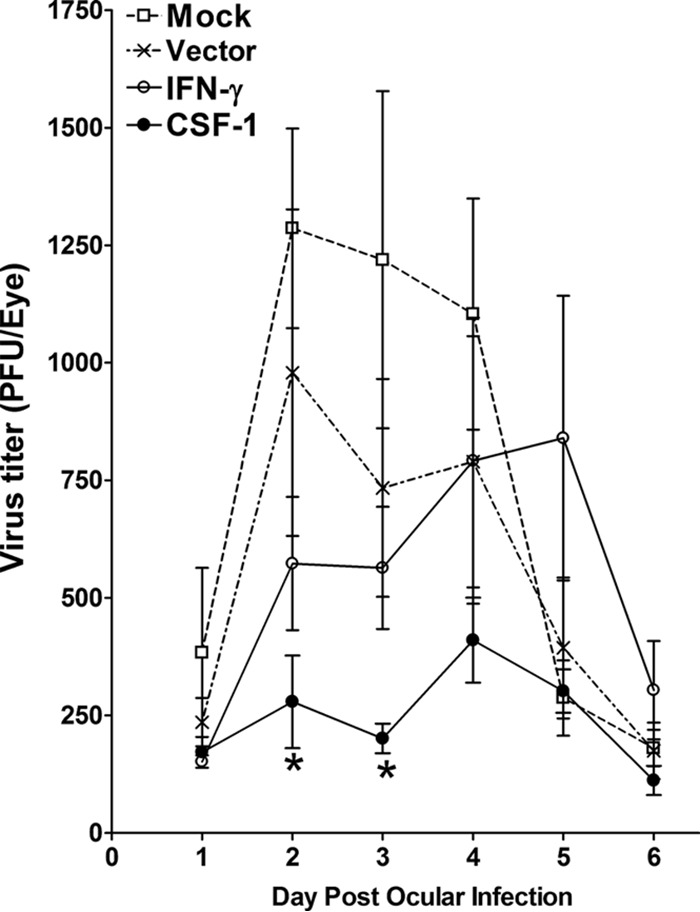
Virus titers in the eyes of ocularly infected mice that had been injected with CSF-1 or IFN-γ DNA. Mice were injected intramuscularly three times with CSF-1 DNA, IFN-γ DNA, or vector DNA as for Fig. 7 or mock treated. Three weeks after the third injection, the mice were intraocularly infected with HSV-1 strain McKrae (2 × 10⁵ PFU/eye). The presence of infectious virus in the eyes of injected mice was monitored daily by collecting tear films from 10 mice (20 eyes) as described in Materials and Methods. Each bar represents the average peak virus titer from 20 eyes ± SEM. *, P ≤ 0.05.
Effects of CSF-1 or IFN-γ injection on establishment of latent infection.
To determine if altering M1 or M2 levels affected latency, the TG from the four groups of mice that were used for eye swab experiments as described above (Fig. 8) were harvested 28 days p.i. The amounts of latency-associated transcripts (LAT) in the TG of individual mice were determined. As shown in Fig. 9, the levels of latency were similar in the mice administered vector DNA and the mock-injected mice (P = 0.9). The amounts of LAT RNA in the TG were significantly lower in the CSF-1 DNA-treated mice than in the IFN-γ DNA-treated mice (P < 0.0001) and significantly lower than in the mice that were administered vector DNA or the mock-injected mice (P < 0.0001). In contrast, the levels of LAT mRNA were significantly higher in the IFN-γ DNA-treated mice than in the mice that were administered vector DNA or the mock-injected mice (P = 0.003). Thus, shifting the phenotype of the macrophages to M2 by CSF-1 DNA injection reduced the amount of latency in infected mice, whereas IFN-γ DNA injection enhanced latency.
FIG 9.
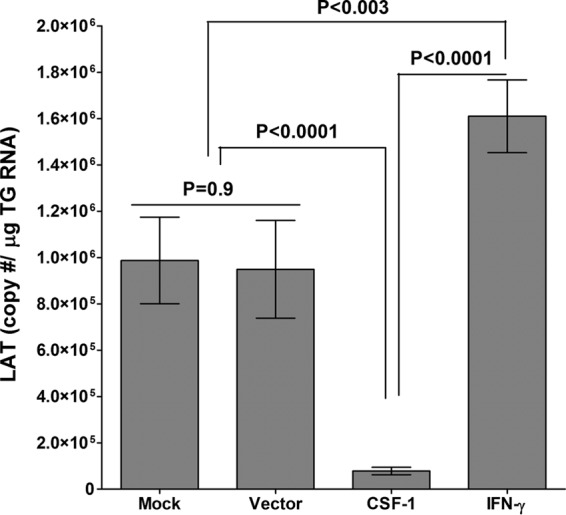
Effect of CSF-1 or IFN-γ on HSV-1 latency in TG of latently infected mice. Mice were injected with CSF-1 DNA, IFN-γ DNA, or vector DNA or mock treated and ocularly infected with HSV-1 strain McKrae as for Fig. 8. On day 28 p.i., TG were harvested and quantitative RT-PCR was performed on each individual mouse TG. In each experiment, an estimated relative copy number of LAT was calculated using standard curves generated from pGEM-5317. Briefly, the DNA template was serially diluted 10-fold so that 5 μl contained from 103 to 1011 copies of LAT and then subjected to TaqMan PCR with the same set of primers. By comparing the normalized threshold cycle of each sample to the threshold cycle of the standard, the copy number for each reaction was determined. GAPDH expression was used as an internal control. Each point represents the mean ± SEM from 20 TG.
Effects of CSF-1 or IFN-γ injection on levels of CD4, CD8, IFN-γ, and PD-1 mRNAs in the TG of latently infected mice.
Previously, we found that latent infection with wild-type HSV-1 increases the levels of LAT RNA, CD8 mRNA, and PD-1 mRNA in the TG (67). We also found increased numbers of PD-1-positive CD8 T cells (i.e., exhausted CD8 T cells) in the TG of mice that were latently infected with LAT+ virus compared to those infected with LAT− virus (68). Moreover, PD-1−/− mice exhibited significantly lower levels of HSV-1 latency than WT mice (68). As our current data suggested higher latency in IFN-γ DNA-treated mice than in CSF-1 DNA-treated mice, we examined the associations between the effects of higher LAT expression in the IFN-γ DNA-treated mice and T cell exhaustion markers and related cytokines in the TG of latently infected mice. The relative levels of mRNAs for T cell subtypes (CD4 and CD8), a marker of exhaustion (PD-1), and a cytokine that may be altered by exhaustion (IFN-γ) were determined by real-time PCR of total TG extracts. The results are presented in Fig. 7 as the fold increase (or decrease) compared to the baseline mRNA levels in TG from uninfected naive mice. In the TG of mice administered IFN-γ DNA, the levels of CD4 (Fig. 10A), CD8 (Fig. 10B), IFN-γ (Fig. 10C), and PD-1 (Fig. 10D) mRNAs were all elevated compared to those of mice that were administered CSF-1 DNA. The levels of all of these mRNAs were significantly higher in the TG from mice that were administered IFN-γ DNA than in the TG from mice administered CSF-1 DNA (P < 0.0001). These results suggest that there are both increased numbers of T cells and increased T cell exhaustion, as indicated by the increased expression of the PD-1 exhaustion marker, in the TG from latently infected mice that had been pretreated with IFN-γ DNA compared with those that had been pretreated with CSF-1 DNA.
FIG 10.

Effects of injection of CSF-1 DNA and IFN-γ DNA on various other transcripts in TG of latently infected mice. TG from the latently infected mice, as shown in Fig. 9, were individually isolated on day 28 p.i., and quantitative RT-PCR was performed using total RNA from TG as described in Materials and Methods. CD4, CD8α, PD-1, and IFN-γ mRNA expression in naive mice was used as a baseline control to estimate the relative expression of each transcript in TG of latently infected mice. GAPDH mRNA expression was used to normalize the relative expression of each transcript. Each point represents the mean ± SEM from 20 TG. (A) CD4 mRNA. (B) CD8α mRNA. (C) IFN-γ mRNA. (D) PD-1 mRNA.
DISCUSSION
HSV-1 infections are among the most frequent serious viral eye infections in the United States and can cause eye disease ranging in severity from blepharitis, conjunctivitis, and dendritic keratitis to disciform stromal edema, necrotizing stromal keratitis, and blindness (69–71). In our published studies, we have shown that macrophages contribute to the greater efficacy of the DNA vaccine than the protein vaccine in protecting against the effects of ocular HSV-1 infection (16). Macrophages are involved in the production of IL-12 (72, 73), a cytokine reported to be involved in stimulation of both T cells and NK cells (74), including stimulation of cytotoxic activity, proliferation, and promotion of TH1 development and IFN-γ and TNF-α production (75, 76). IL-12 has also been shown to differentiate TH0 cells into a TH1 response (77, 78) and consequently to upregulate IL-2 production. Thus, macrophages play a major role in regulating many facets of the immune response and play a central role in the balance and efficiency of the immune response to HSV-1 infection and vaccination. Their phenotypes, based on secretion of proinflammatory and anti-inflammatory molecules, are divided into M1 and M2 (27). However, very little is known regarding what role, if any, M1 and M2 macrophages play in control of HSV-1 infection. It is of fundamental importance to understand the regulatory mechanisms controlling the polarization and balance of macrophage subsets, as different macrophage subsets are likely to lead to significantly distinct biological consequences in response to HSV-1 infection. In this study, we have shown that M1 macrophages derived from both the RAW264.7 cell line and PM of C57BL/6 mice were refractory to HSV-1 replication compared to M2 macrophages or unpolarized macrophages. These results are consistent with the report that the yields of HSV-1 from M1 macrophages derived from the murine J774A.1 macrophage line were lower than the yields from the unpolarized macrophages and M2 macrophages (79). We also showed that after infection M1 macrophages derived from either RAW264.7 cells or PM produce significantly larger amounts of proinflammatory cytokines and chemokines than the M2 macrophages, which is consistent with previous reports (26, 28–30). These proinflammatory cytokines and chemokines most likely contribute to the lower virus replication in M1 cells than in M2 or unpolarized cells. Other potential contributing factors are M1 macrophage polarization-induced growth arrest and decreases in the pH of the medium (80).
The spectrum of macrophage polarization is well described in vitro, and there is now increasing evidence that macrophage polarization, or at least a polarization-like event, may also occur in vivo (29, 50). However, the contribution of the findings gained from in vitro observations to induction of disease in vivo is problematic due to the complexity of the in vivo systems and discrepancies between in vitro and in vivo conditions (81). It was therefore important to assess whether shifting the macrophage responses toward the M1 or M2 phenotype had any positive effect on virus replication and latency in vivo. As IFN-γ is primarily associated with the generation of M1 macrophages (48) whereas CSF-1 generates M2 macrophages (49), we used CSF-1 to push the macrophage response toward an M2 response and IFN-γ to push it toward an M1 response. Our results suggested that mice that were treated with CSF-1 DNA exhibited both reduced virus replication in the eye and reduced latency compared to mice treated with IFN-γ DNA. In line with this study, it was previously shown that IFN-γ is secreted during the progression of herpetic stromal keratitis (HSK), and its neutralization significantly reduced the severity of the disease (82). These results are also consistent with a report that M2 macrophages confer protection against HIV infection in vitro compared with M1 macrophages (83). Overall, our studies indicated that a decrease in LAT expression in TG, and hence a decrease in latency, appeared to be associated with administration of CSF-1 DNA and a shift to an M2 response, whereas an increase in latency was associated with administration of IFN-γ DNA injection and thus an M1 response. Treatment of PM from C3H/HeN mice with CSF-1 has been shown to reduce the replication of vesicular stomatitis virus (VSV) and to increase the survival of the infected cells in vitro (26).
Persistent or latent infections are characterized by varying degrees of functional impairment of virus-specific T cell responses, leading to inability of the host to eliminate the pathogen (84). In this study, we have shown that increased expression of CD4, CD8, IFN-γ, and PD-1 mRNAs was associated with IFN-γ DNA injection. Previously, we reported that the presence of LAT caused subclinical reactivation and higher expression of CD4, CD8, IFN-γ, and PD-1 transcripts (68). We also found that exhaustion of CD8+ T cells in the presence of LAT was the major factor leading to an increase in latency and that the CD8+ T cell impairment was associated with upregulation of PD-1 gene expression. Previously, we reported that higher latency is independent of primary virus replication in the eye and TG (85, 86). Furthermore, we reported that there is no absolute correlation between the primary virus titer in the eye, the level of viral DNA in latent TG, and time to reactivation (87). In addition, in the current study, we have demonstrated that increased latency is associated with higher expression of transcripts associated with CD4 and IFN-γ expression. Similarly, other investigators have shown that IFN-γ participates in upregulation of PD-1 expression and thus inhibition of T cell effector functions (88). It has been shown that TG-resident CD8 T cells block HSV-1 reactivation from latency and that these cells are necessary for maintaining viral latency (89, 90). Additionally, CD8 T cells can actively suppress viral reactivation through release of IFN-γ (91). In the current study, we found that the IFN-γ-treated mice exhibited higher latency, as well as higher CD4, CD8, and IFN-γ expression, suggesting that the higher latency may be due to higher levels of CD8 and IFN-γ expression. However, the mice that had been administered IFN-γ also had higher levels of PD-1 expression, which suggests that the CD8 T cells may not be functional. This would be in line with our previous study that showed that CD8 T cells do not play a role in maintaining latency (68, 92).
Based on these studies, it can be speculated that the lower levels of PD-1 transcripts in the mice with high numbers of M2 macrophages may serve as an important autoprotective mechanism to preserve the integrity of T cells. This would lead to a more efficient surveillance capacity and an ability of T cells to clear infectious virus more efficiently, thus leading to a reduction in latency. This, however, is in contrast to our observations that Flt3L increases latency and PD-1 expression due to an increase in CD8α+ DCs (63, 93), whereas GM-CSF reduced latency by enhancing CD8α− DCs (63). Notably, in addition to its effect on DCs, GM-CSF also has been reported to be an M1 stimulus (40). Similarly, we found that the level of latency in the GM-CSF-treated mice was similar to that in IFN-γ-treated mice and that GM-CSF was significantly less effective in reducing latency than CSF-1 (data not shown). Thus, the results of the current study suggest that CSF-1 treatment, and thus M2 macrophages, may be more effective in reducing HSV-1 latency than IFN-γ treatment, at least in mice. This is consistent with our published studies showing that the phenotype of the macrophages affects virus replication and eye disease in ocularly infected mice (9, 16). The concept that treatment with IFN-γ to push the macrophage responses toward an M1 response may act to exacerbate HSV-1 latency rather than playing a protective role in mice is consistent with reports of the deleterious effects of the M1 macrophage population on IFN-γ treatment of atherosclerosis in mice (94). In addition, it has been reported that treatment of multiple sclerosis patients with recombinant IFN-γ exacerbated the disease (95). Similarly, we have shown that the central nervous system (CNS) demyelination observed in HSV IL-2-infected mice was exacerbated on coinfection with recombinant HSV IFN-γ (96). These exacerbations of disease may be associated with shifting the response toward M1 macrophages, thereby enhancing the production of proinflammatory cytokines and recruitment of fresh immune cells that exacerbate the disease. Indeed, the symptoms of HSV-induced Bechet disease in mice were ameliorated when the M1/M2 ratio was decreased (97). The roles of M1 and M2 macrophages in protective responses and disease are not universal, however, and may depend on both the disease process and the organism. For example, M1 macrophages have bactericidal potential (98, 99), whereas M2 macrophages promote antiparasitic functions, as well as tissue repair and remodeling (100). Both M1 and M2 macrophages have been implicated in HIV infections, with M1 macrophages inhibiting replication of HIV at the early preintegration stage, whereas M2 macrophages inhibit HIV replication at the postintegration step (101). With regard to our current in vivo studies, M1 macrophages did not appear to affect either the primary or latent phase of infection, but M2 macrophages affected both stages of infection. The lack of efficacy of the M1 macrophages in the in vivo studies differed from our observation of reduced virus replication in the M1 macrophages in the experiments carried out in vitro. One potential explanation for this discrepancy in the results generated using in vitro and in vivo approaches may be the absence of other immune cells in vitro. The secretion of proinflammatory cytokines/chemokines by the M1 macrophages is likely to have a profound effect on the recruitment and activation of other immune cells in vivo.
Human studies have shown that the innate immune response reduces the severity of HSV-1 keratitis and its complications (102). The corneal macrophages are the first line of defense against the infection (103, 104) and control infection in a nonspecific manner (4). These cells are part of healthy, as well as diseased, corneas (105). However, no clinical study is available to support the idea that macrophages are infected by HSV-1. In the present study, we have shown that HSV-1 infection of macrophages, at both acute and latent phases, is dependent upon the state of cell polarization. We propose that ocular infection of HSV-1 can be controlled by manipulating the polarization state of the macrophages.
In summary, we present the results of the first study of the effects of macrophage polarization on HSV-1 replication in vitro and in vivo. We demonstrate that (i) lower virus replication in vitro was associated with an M1 macrophage phenotype, possibly due to higher proinflammatory responses, while reduced virus replication in vivo was correlated with an M2 phenotype, possibly due to the presence of other immune cells; (ii) the M1 macrophage phenotype was correlated with higher virus replication in the eye, higher latency, and higher T cell exhaustion in vivo; and (iii) the M2 phenotype is associated with reduced virus replication in the eye, decrease in latency, decrease in the numbers of T cells, decrease in T cell exhaustion, and lower IFN-γ expression in vivo. Thus, these findings suggest that CSF-1 might be a useful adjuvant for use as part of an anti-HSV-1 vaccine. Any vaccination strategy that stimulates the wrong subpopulation of macrophages may hinder rather than improve overall vaccine efficacy against HSV infection, as we have shown previously for DCs (63, 106).
MATERIALS AND METHODS
Viruses, cells, and mice.
Plaque-purified virulent HSV-1 strain McKrae (wild type) or green fluorescent protein-positive (GFP+) HSV was grown in rabbit skin (RS) cell monolayers in minimal essential medium (MEM) containing 5% fetal calf serum (FCS), as described previously (85, 86). The RAW264.7 mouse macrophage line was obtained from the American Type Culture Collection (ATCC) (Manassas, VA) and was cultured in Dulbecco's modified Eagle's medium (DMEM) supplemented with 10% FCS. Female C57BL/6 mice were purchased from Jackson Laboratories (Bar Harbor, ME). All animal procedures adhered to the Association for Research in Vision and Ophthalmology (ARVO) Statement for the Use of Animals in Ophthalmic and Vision Research and to institutional animal care and use guidelines.
Peritoneal macrophages.
PM were harvested from C57BL/6 mice after expansion by treatment of the mice with zymosan or thioglycolate (Sigma-Aldrich, St. Louis, MO). The mice were administered 200 μl of 2-mg/ml zymosan in sterile, 0.9% (wt/vol) saline solution or 3% thioglycolate solution in one intraperitoneal injection. The peritoneal fluid was harvested 72 h later and cultured overnight in DMEM in 24-well plates. The medium was then removed, and the cells were washed twice with phosphate-buffered saline (PBS) to remove any floating cells. Adherent cells were recovered by gentle scraping and subjected to the M1 and M2 macrophage activation protocols.
Activation of macrophages in vitro.
The RAW264.7 cells or PM were seeded at 2 × 10⁵ cells/well in a 24-well plate in DMEM. After overnight incubation, the medium was replaced with either fresh medium alone, medium containing 50 ng/ml of murine IFN-γ (Peprotech, Rocky Hill, NJ) and 100 ng/ml of LPS (Sigma-Aldrich, St. Louis, MO) for generation of M1 macrophages, or medium containing 10 ng/ml of murine IL-4 (Peprotech, NJ) for generation of M2 macrophages. The cells were incubated under these conditions for 24 h prior to infection with HSV-1.
Infection of macrophages in vitro.
The monolayers of RAW264.7 cells or PM that were unpolarized or M1 or M2 polarized were infected with 10 PFU/cell of McKrae or GFP+ HSV at 37°C. One hour later, the infected cells were washed 3 times with PBS, and fresh DMEM was added to each well. Virus was harvested at 0, 12, 24, and 48 h p.i. by two cycles of freeze-thawing of the cell monolayers with culture medium. The virus titer was determined using a standard plaque assay on RS cells.
Luminex xMAP immunoassay (magnetic-bead kits).
Luminex assays were performed in the Immune Assessment Core at the University of California, Los Angeles (UCLA). Mouse 32-plex magnetic cytokine/chemokine kits were purchased from EMD Millipore (Billerica, MA) and used according to the manufacturer's instructions. Monolayers of unpolarized M1 or M2 macrophages from either RAW264.7 cells or PM were infected with 10 PFU/cell of McKrae or mock infected for 24 h as described above. Media from the infected and mock-infected cells were collected, and 25 μl of 1:2-diluted samples was mixed with 25 μl magnetic beads and allowed to incubate overnight at 4°C with shaking. After washing the plates twice with wash buffer in a Biotek ELx405 washer, 25 μl of biotinylated detection antibody was added and incubated for 1 h at room temperature. Streptavidin-phycoerythrin conjugate (25 μl) was then added to the reaction mixture and incubated for another 30 min at room temperature. Following two washes, beads were resuspended in sheath fluid, and fluorescence was quantified using a Luminex 200TM instrument.
DNA injection.
pUNO1-mCSF-1 and pUNO1-mIFN-γ expression plasmids were purchased from InvivoGen (San Diego, CA). The plasmids were purified using a cesium chloride gradient. Purified DNA (100 μg in a total volume of 50 μl PBS) was injected i.m. into each quadriceps using a 27-gauge needle on day 0, day 14, and day 28, as described previously (63, 107). For negative controls, mice were injected with either diluent or empty-vector DNA. There were 10 mice per group in each experiment.
Ocular infection.
Three weeks after the third DNA injection, the mice were infected ocularly with 2 × 10⁵ PFU per eye of HSV-1 strain McKrae delivered as an eye drop in 2 μl of tissue culture medium as described previously (32). Corneal scarification was not performed prior to infection.
Flow cytometry analysis.
Before ocular infection and on days 3 and 7 post-ocular infection, the PM and spleens of DNA-injected mice were harvested. Single-cell suspensions of the spleens were prepared as described previously (108, 109). The PM or spleen cells (2 × 10⁶) were stained with FC receptor antibody (BD Biosciences), and subsequently, fluorescein isothiocyanate (FITC)-anti-mouse F4/80 antibody (BioLegend, San Diego, CA), propidium iodide (PI) (BD Biosciences), Alexa Fluor 647-anti mouse Ly6c antibody (BioLegend), and Pacific Blue-anti mouse CD206 antibody (BioLegend). The stained cells were washed 2 times in PBS with 1% bovine serum albumin (BSA), and then 5 × 10⁵ cells were acquired using a BD LSR II flow cytometer (BD Biosciences, San Jose, CA). The results were analyzed using BD FACS Diva software (BD Biosciences).
RNA extraction, cDNA synthesis, and TaqMan qRT-PCR assay.
For cultured cells, total RNA extraction was carried out the using an RNeasy minikit (Qiagen, Valencia, CA) according to the manufacturer's protocol. For RNA extraction from TG, tissues were collected 4 weeks after infection, immersed in TRIzol reagent (Applied Biosystems, Foster City, CA), and stored at −80°C until they were processed. Total RNA extraction was carried out according to the manufacturer's protocol. Following RNA extraction, 1 μg of total RNA was reverse transcribed using a high-capacity cDNA reverse transcription kit (Applied Biosystems, CA) according to the manufacturer's protocol. The mRNA expression levels of the genes of interest were evaluated using TaqMan Gene Expression assays (Applied Biosystems, CA). The TaqMan assays used in this study were (i) NOS2; assay ID (Thermo Fisher), Mm00440502_m1; amplicon size, 66 bp; (ii) ARG1; Mm00475988_m1; 65 bp; (iii) HVEM (TNFRSF14); Mm00619239_m1; 65 bp; (4) nectin-1 (PVRL1); Mm00445392_m1; 71 bp; (v) nectin-2 (PVRL2);, Mm00436144_m1; 65 bp; (vi) PILR-α; Mm04211819_m1; 77 bp; (vii) HS-3-O-ST (HS3ST3B1); Mm03052977_s1; 97 bp; (viii) IFN-γ; Mm00801778_m1; 101 bp; (ix) PD-1; Mm00435532_m1; 65 bp; (x) CD4 Mm00442754_m1; 78 bp; (xi) CD8α; Mm01182108_m1; 67 bp; (xii) IFN-α (IFN2A); Mm00833961; 158 bp; (xiii) IFN-β; Mm00439552; 69 bp; and (xiv) GAPDH (glyceraldehyde-3-phosphate dehydrogenase); Mm99999915_g1; 107 bp. The custom-made LAT assay used the following primers and probe: forward primer, 5′-GGGTGGGCTCGTGTTACAG-3′; reverse primer, 5′-GGACGGGTAAGTAACAGAGTCTCTA-3′; and probe, 5′- 6-carboxyfluorescein (FAM)-ACACCAGCCCGTTCTTT-3′ (amplicon size, 81 bp, corresponding to LAT nucleotides [nt] 119553 to 119634). GAPDH was used as a loading control in all experiments. qRT-PCR was performed using an ABI ViiA 7 sequence detection system (Applied Biosystems) in 384-well plates. Real-time PCR was performed in triplicate for each tissue sample. The threshold cycle (CT) values, which represent the PCR cycle at which there is a noticeable increase in the reporter fluorescence above baseline, were determined using SDS 2.2 software. Copy numbers of LAT RNA were calculated using a standard curve generated using pGEM5317-LAT, as described previously (86, 106, 110).
Statistical analysis.
For all statistical tests, P values less than or equal to 0.05 were considered statistically significant and are denoted by a single asterisk in the figures. A two-tailed Student t test with unequal variances was used to compare the differences between two experimental groups. All experiments were repeated at least three times.
REFERENCES
- 1.Macatonia SE, Hsieh CS, Murphy KM, O'Garra A. 1993. Dendritic cells and macrophages are required for Th1 development of CD4+ T cells from alpha beta TCR transgenic mice: IL-12 substitution for macrophages to stimulate IFN-gamma production is IFN-gamma-dependent. Int Immunol 5:1119–1128. doi: 10.1093/intimm/5.9.1119. [DOI] [PubMed] [Google Scholar]
- 2.Morahan PS, Morse SS, McGeorge MG. 1980. Macrophage extrinsic antiviral activity during herpes simplex virus infection. J Gen Virol 46:291–300. doi: 10.1099/0022-1317-46-2-291. [DOI] [PubMed] [Google Scholar]
- 3.Ramirez MC, Sigal LJ. 2002. Macrophages and dendritic cells use the cytosolic pathway to rapidly cross-present antigen from live, vaccinia-infected cells. J Immunol 169:6733–6742. doi: 10.4049/jimmunol.169.12.6733. [DOI] [PubMed] [Google Scholar]
- 4.Sit MF, Tenney DJ, Rothstein JL, Morahan PS. 1988. Effect of macrophage activation on resistance of mouse peritoneal macrophages to infection with herpes simplex virus types 1 and 2. J Gen Virol 69:1999–2010. doi: 10.1099/0022-1317-69-8-1999. [DOI] [PubMed] [Google Scholar]
- 5.Young HA, Hardy KJ. 1995. Role of interferon-gamma in immune cell regulation. J Leukoc Biol 58:373–381. [PubMed] [Google Scholar]
- 6.Peters JH, Gieseler R, Thiele B, Steinbach F. 1996. Dendritic cells: from ontogenetic orphans to myelomonocytic descendants. Immunol Today 17:273–278. doi: 10.1016/0167-5699(96)80544-5. [DOI] [PubMed] [Google Scholar]
- 7.Brissette-Storkus CS, Reynolds SM, Lepisto AJ, Hendricks RL. 2002. Identification of a novel macrophage population in the normal mouse corneal stroma. Invest Ophthalmol Vis Sci 43:2264–2271. [PMC free article] [PubMed] [Google Scholar]
- 8.Hamrah P, Liu Y, Zhang Q, Dana MR. 2003. The corneal stroma is endowed with a significant number of resident dendritic cells. Invest Ophthalmol Vis Sci 44:581–589. doi: 10.1167/iovs.02-0838. [DOI] [PubMed] [Google Scholar]
- 9.Ghiasi H, Hofman FM, Wallner K, Cai S, Perng G, Nesburn AB, Wechsler SL. 2000. Corneal macrophage infiltrates following ocular herpes simplex virus type 1 challenge vary in BALB/c mice vaccinated with different vaccines. Vaccine 19:1266–1273. doi: 10.1016/S0264-410X(00)00298-X. [DOI] [PubMed] [Google Scholar]
- 10.Ghiasi H, Wechsler SL, Cai S, Nesburn AB, Hofman FM. 1998. The role of neutralizing antibody and T-helper subtypes in protection and pathogenesis of vaccinated mice following ocular HSV-1 challenge. Immunology 95:352–359. doi: 10.1046/j.1365-2567.1998.00602.x. [DOI] [PMC free article] [PubMed] [Google Scholar]
- 11.Ghiasi H, Wechsler SL, Kaiwar R, Nesburn AB, Hofman FM. 1995. Local expression of tumor necrosis factor alpha and interleukin-2 correlates with protection against corneal scarring after ocular challenge of vaccinated mice with herpes simplex virus type 1. J Virol 69:334–340. [DOI] [PMC free article] [PubMed] [Google Scholar]
- 12.Tumpey TM, Chen SH, Oakes JE, Lausch RN. 1996. Neutrophil-mediated suppression of virus replication after herpes simplex virus type 1 infection of the murine cornea. J Virol 70:898–904. [DOI] [PMC free article] [PubMed] [Google Scholar]
- 13.Berra A, Rodriguez A, Heiligenhaus A, Pazos B, Van Rooijen N, Foster CS. 1994. The role of macrophages in the pathogenesis of HSV-1 induced chorioretinitis in BALB/c mice. Invest Ophthalmol Vis Sci 35:2990–2998. [PubMed] [Google Scholar]
- 14.Ghiasi H, Hofman FM, Cai S, Perng GC, Nesburn AB, Wechsler SL. 1999. Vaccination with different HSV-1 glycoproteins induces different patterns of ocular cytokine responses following HSV-1 challenge of vaccinated mice. Vaccine 17:2576–2582. doi: 10.1016/S0264-410X(99)00056-0. [DOI] [PubMed] [Google Scholar]
- 15.Thomas J, Gangappa S, Kanangat S, Rouse BT. 1997. On the essential involvement of neutrophils in the immunopathologic disease: herpetic stromal keratitis. J Immunol 158:1383–1391. [PubMed] [Google Scholar]
- 16.Mott K, Brick DJ, van Rooijen N, Ghiasi H. 2007. Macrophages are important determinants of acute ocular HSV-1 infection in immunized mice. Invest Ophthalmol Vis Sci 48:5605–5615. doi: 10.1167/iovs.07-0894. [DOI] [PubMed] [Google Scholar]
- 17.Yan XT, Tumpey TM, Kunkel SL, Oakes JE, Lausch RN. 1998. Role of MIP-2 in neutrophil migration and tissue injury in the herpes simplex virus-1-infected cornea. Invest Ophthalmol Vis Sci 39:1854–1862. [PubMed] [Google Scholar]
- 18.Tumpey TM, Cheng H, Cook DN, Smithies O, Oakes JE, Lausch RN. 1998. Absence of macrophage inflammatory protein-1alpha prevents the development of blinding herpes stromal keratitis. J Virol 72:3705–3710. [DOI] [PMC free article] [PubMed] [Google Scholar]
- 19.Esiri MM, Drummond CW, Morris CS. 1995. Macrophages and microglia in HSV-1 infected mouse brain. J Neuroimmunol 62:201–205. doi: 10.1016/0165-5728(95)00123-8. [DOI] [PubMed] [Google Scholar]
- 20.Ikeda S, Negishi T, Nishimura C. 1985. Enhancement of non-specific resistance to viral infection by muramyldipeptide and its analogs. Antiviral Res 5:207–215. doi: 10.1016/0166-3542(85)90025-7. [DOI] [PubMed] [Google Scholar]
- 21.Osorio Y, Ghiasi H. 2003. Comparison of adjuvant efficacy of herpes simplex virus type 1 recombinant viruses expressing TH1 and TH2 cytokine genes. J Virol 77:5774–5783. doi: 10.1128/JVI.77.10.5774-5783.2003. [DOI] [PMC free article] [PubMed] [Google Scholar]
- 22.Osorio Y, Ghiasi H. 2005. Recombinant herpes simplex virus type 1 (HSV-1) codelivering interleukin-12p35 as a molecular adjuvant enhances the protective immune response against ocular HSV-1 challenge. J Virol 79:3297–3308. doi: 10.1128/JVI.79.6.3297-3308.2005. [DOI] [PMC free article] [PubMed] [Google Scholar]
- 23.Osorio Y, Wechsler SL, Nesburn AB, Ghiasi H. 2002. Reduced severity of HSV-1-induced corneal scarring in IL-12-deficient mice. Virus Res 90:317–326. doi: 10.1016/S0168-1702(02)00249-6. [DOI] [PubMed] [Google Scholar]
- 24.Osorio Y, Sharifi BG, Perng GC, Ghiasi NS, Ghiasi H. 2002. The role of TH1 and TH2 cytokines in HSV-1-induced corneal scarring. Ocul Immunol Inflamm 10:105–116. doi: 10.1076/ocii.10.2.105.13982. [DOI] [PubMed] [Google Scholar]
- 25.Mott KR, Gate D, Zandian M, Allen SJ, Rajasagi NK, Van Rooijen N, Chen SC, Arditi M, Rouse BT, Flavell RA, Town T, Ghiasi H. 2011. Macrophage IL-12p70 signaling prevents HSV-1-induced CNS autoimmunity triggered by autoaggressive CD4+ Tregs. Invest Ophthalmol Vis Sci 52:2321–2333. doi: 10.1167/iovs.10-6536. [DOI] [PMC free article] [PubMed] [Google Scholar]
- 26.Mosser DM, Edwards JP. 2008. Exploring the full spectrum of macrophage activation. Nat Rev Immunol 8:958–969. doi: 10.1038/nri2448. [DOI] [PMC free article] [PubMed] [Google Scholar]
- 27.Van Ginderachter JA, Movahedi K, Hassanzadeh Ghassabeh G, Meerschaut S, Beschin A, Raes G, De Baetselier P. 2006. Classical and alternative activation of mononuclear phagocytes: picking the best of both worlds for tumor promotion. Immunobiology 211:487–501. doi: 10.1016/j.imbio.2006.06.002. [DOI] [PubMed] [Google Scholar]
- 28.Gordon S. 2003. Alternative activation of macrophages. Nat Rev Immunol 3:23–35. doi: 10.1038/nri978. [DOI] [PubMed] [Google Scholar]
- 29.Gordon S, Martinez FO. 2010. Alternative activation of macrophages: mechanism and functions. Immunity 32:593–604. doi: 10.1016/j.immuni.2010.05.007. [DOI] [PubMed] [Google Scholar]
- 30.Cao Y, Brombacher F, Tunyogi-Csapo M, Glant TT, Finnegan A. 2007. Interleukin-4 regulates proteoglycan-induced arthritis by specifically suppressing the innate immune response. Arthritis Rheum 56:861–870. doi: 10.1002/art.22422. [DOI] [PubMed] [Google Scholar]
- 31.Easty DL, Shimeld C, Claoue CM, Menage M. 1987. Herpes simplex virus isolation in chronic stromal keratitis: human and laboratory studies. Curr Eye Res 6:69–74. doi: 10.3109/02713688709020071. [DOI] [PubMed] [Google Scholar]
- 32.Ghiasi H, Kaiwar R, Nesburn AB, Slanina S, Wechsler SL. 1994. Expression of seven herpes simplex virus type 1 glycoproteins (gB, gC, gD, gE, gG, gH, and gI): comparative protection against lethal challenge in mice. J Virol 68:2118–2126. [DOI] [PMC free article] [PubMed] [Google Scholar]
- 33.Koelle DM, Ghiasi H. 2005. Prospects for developing an effective vaccine against ocular herpes simplex virus infection. Curr Eye Res 30:929–942. doi: 10.1080/02713680500313153. [DOI] [PubMed] [Google Scholar]
- 34.Wiktor-Jedrzejczak W, Urbanowska E, Aukerman SL, Pollard JW, Stanley ER, Ralph P, Ansari AA, Sell KW, Szperl M. 1991. Correction by CSF-1 of defects in the osteopetrotic op/op mouse suggests local, developmental, and humoral requirements for this growth factor. Exp Hematol 19:1049–1054. [PubMed] [Google Scholar]
- 35.Tanaka S, Takahashi N, Udagawa N, Tamura T, Akatsu T, Stanley ER, Kurokawa T, Suda T. 1993. Macrophage colony-stimulating factor is indispensable for both proliferation and differentiation of osteoclast progenitors. J Clin Invest 91:257–263. doi: 10.1172/JCI116179. [DOI] [PMC free article] [PubMed] [Google Scholar]
- 36.Chitu V, Stanley ER. 2006. Colony-stimulating factor-1 in immunity and inflammation. Curr Opin Immunol 18:39–48. doi: 10.1016/j.coi.2005.11.006. [DOI] [PubMed] [Google Scholar]
- 37.Kim JJ, Yang JS, Lee DJ, Wilson DM, Nottingham LK, Morrison L, Tsai A, Oh J, Dang K, Dentchev T, Agadjanyan MG, Sin JI, Chalian AA, Weiner DB. 2000. Macrophage colony-stimulating factor can modulate immune responses and attract dendritic cells in vivo. Hum Gene Ther 11:305–321. doi: 10.1089/10430340050016049. [DOI] [PubMed] [Google Scholar]
- 38.Suzu S, Kimura F, Tanaka-Douzono M, Yamada M, Nakamura Y, Wakimoto N, Sato K, Morita T, Ikeda K, Motoyoshi K. 2001. Antitumor immunity induced by irradiated tumor cells producing macrophage colony-stimulating factor. Int J Hematol 73:378–382. doi: 10.1007/BF02981965. [DOI] [PubMed] [Google Scholar]
- 39.Dan Q, Sanchez R, Delgado C, Wepsic HT, Morgan K, Chen Y, Jeffes EW, Lowell CA, Morgan TR, Jadus MR. 2001. Non-immunogenic murine hepatocellular carcinoma Hepa1-6 cells expressing the membrane form of macrophage colony stimulating factor are rejected in vivo and lead to CD8+ T-cell immunity against the parental tumor. Mol Ther 4:427–437. doi: 10.1006/mthe.2001.0477. [DOI] [PubMed] [Google Scholar]
- 40.Verreck FA, de Boer T, Langenberg DM, Hoeve MA, Kramer M, Vaisberg E, Kastelein R, Kolk A, de Waal-Malefyt R, Ottenhoff TH. 2004. Human IL-23-producing type 1 macrophages promote but IL-10-producing type 2 macrophages subvert immunity to (myco)bacteria. Proc Natl Acad Sci U S A 101:4560–4565. doi: 10.1073/pnas.0400983101. [DOI] [PMC free article] [PubMed] [Google Scholar]
- 41.Trinchieri G. 1989. Biology of natural killer cells. Adv Immunol 47:187–376. doi: 10.1016/S0065-2776(08)60664-1. [DOI] [PMC free article] [PubMed] [Google Scholar]
- 42.van den Broek MF, Muller U, Huang S, Zinkernagel RM, Aguet M. 1995. Immune defence in mice lacking type I and/or type II interferon receptors. Immunol Rev 148:5–18. doi: 10.1111/j.1600-065X.1995.tb00090.x. [DOI] [PubMed] [Google Scholar]
- 43.Mantovani A, Sica A, Sozzani S, Allavena P, Vecchi A, Locati M. 2004. The chemokine system in diverse forms of macrophage activation and polarization. Trends Immunol 25:677–686. doi: 10.1016/j.it.2004.09.015. [DOI] [PubMed] [Google Scholar]
- 44.Feduchi E, Carrasco L. 1991. Mechanism of inhibition of HSV-1 replication by tumor necrosis factor and interferon gamma. Virology 180:822–825. doi: 10.1016/0042-6822(91)90100-P. [DOI] [PubMed] [Google Scholar]
- 45.Karupiah G, Xie QW, Buller RM, Nathan C, Duarte C, MacMicking JD. 1993. Inhibition of viral replication by interferon-gamma-induced nitric oxide synthase. Science 261:1445–1448. doi: 10.1126/science.7690156. [DOI] [PubMed] [Google Scholar]
- 46.Mott KR, Underhill D, Wechsler SL, Town T, Ghiasi H. 2009. A role for the JAK-STAT1 pathway in blocking replication of HSV-1 in dendritic cells and macrophages. Virol J 6:56. doi: 10.1186/1743-422X-6-56. [DOI] [PMC free article] [PubMed] [Google Scholar]
- 47.Raschke WC, Baird S, Ralph P, Nakoinz I. 1978. Functional macrophage cell lines transformed by Abelson leukemia virus. Cell 15:261–267. doi: 10.1016/0092-8674(78)90101-0. [DOI] [PubMed] [Google Scholar]
- 48.Hu X, Ivashkiv LB. 2009. Cross-regulation of signaling pathways by interferon-gamma: implications for immune responses and autoimmune diseases. Immunity 31:539–550. doi: 10.1016/j.immuni.2009.09.002. [DOI] [PMC free article] [PubMed] [Google Scholar]
- 49.Martinez FO, Gordon S, Locati M, Mantovani A. 2006. Transcriptional profiling of the human monocyte-to-macrophage differentiation and polarization: new molecules and patterns of gene expression. J Immunol 177:7303–7311. doi: 10.4049/jimmunol.177.10.7303. [DOI] [PubMed] [Google Scholar]
- 50.Martinez FO, Gordon S. 2014. The M1 and M2 paradigm of macrophage activation: time for reassessment. F1000Prime Rep 6:13. doi: 10.12703/P6-13. [DOI] [PMC free article] [PubMed] [Google Scholar]
- 51.Zhang X, Goncalves R, Mosser DM. 2008. The isolation and characterization of murine macrophages. Curr Protoc Immunol 83:14.1.1–14.1.14. doi: 10.1002/0471142735.im1401s83. [DOI] [PMC free article] [PubMed] [Google Scholar]
- 52.Mogilski S, Kubacka M, Lazewska D, Wiecek M, Gluch-Lutwin M, Tyszka-Czochara M, Bukowska-Strakova K, Filipek B, Kiec-Kononowicz K. 2017. Aryl-1,3,5-triazine ligands of histamine H4 receptor attenuate inflammatory and nociceptive response to carrageen, zymosan and lipopolysaccharide. Inflamm Res 66:79–95. doi: 10.1007/s00011-016-0997-z. [DOI] [PMC free article] [PubMed] [Google Scholar]
- 53.Satoh T, Arii J, Suenaga T, Wang J, Kogure A, Uehori J, Arase N, Shiratori I, Tanaka S, Kawaguchi Y, Spear PG, Lanier LL, Arase H. 2008. PILRalpha is a herpes simplex virus-1 entry coreceptor that associates with glycoprotein B. Cell 132:935–944. doi: 10.1016/j.cell.2008.01.043. [DOI] [PMC free article] [PubMed] [Google Scholar]
- 54.Spear PG, Eisenberg RJ, Cohen GH. 2000. Three classes of cell surface receptors for alphaherpesvirus entry. Virology 275:1–8. doi: 10.1006/viro.2000.0529. [DOI] [PubMed] [Google Scholar]
- 55.Taylor JM, Lin E, Susmarski N, Yoon M, Zago A, Ware CF, Pfeffer K, Miyoshi J, Takai Y, Spear PG. 2007. Alternative entry receptors for herpes simplex virus and their roles in disease. Cell Host Microbe 2:19–28. doi: 10.1016/j.chom.2007.06.005. [DOI] [PMC free article] [PubMed] [Google Scholar]
- 56.Yoon M, Zago A, Shukla D, Spear PG. 2003. Mutations in the N termini of herpes simplex virus type 1 and 2 gDs alter functional interactions with the entry/fusion receptors HVEM, nectin-2, and 3-O-sulfated heparan sulfate but not with nectin-1. J Virol 77:9221–9231. doi: 10.1128/JVI.77.17.9221-9231.2003. [DOI] [PMC free article] [PubMed] [Google Scholar]
- 57.Montgomery RI, Warner MS, Lum BJ, Spear PG. 1996. Herpes simplex virus-1 entry into cells mediated by a novel member of the TNF/NGF receptor family. Cell 87:427–436. doi: 10.1016/S0092-8674(00)81363-X. [DOI] [PubMed] [Google Scholar]
- 58.Shukla D, Liu J, Blaiklock P, Shworak NW, Bai X, Esko JD, Cohen GH, Eisenberg RJ, Rosenberg RD, Spear PG. 1999. A novel role for 3-O-sulfated heparan sulfate in herpes simplex virus 1 entry. Cell 99:13–22. doi: 10.1016/S0092-8674(00)80058-6. [DOI] [PubMed] [Google Scholar]
- 59.O'Donnell CD, Kovacs M, Akhtar J, Valyi-Nagy T, Shukla D. 2010. Expanding the role of 3-O sulfated heparan sulfate in herpes simplex virus type-1 entry. Virology 397:389–398. doi: 10.1016/j.virol.2009.11.011. [DOI] [PMC free article] [PubMed] [Google Scholar]
- 60.Stark GR, Kerr IM, Williams BR, Silverman RH, Schreiber RD. 1998. How cells respond to interferons. Annu Rev Biochem 67:227–264. doi: 10.1146/annurev.biochem.67.1.227. [DOI] [PubMed] [Google Scholar]
- 61.Choubey D, Moudgil KD. 2011. Interferons in autoimmune and inflammatory diseases: regulation and roles. J Interferon Cytokine Res 31:857–865. doi: 10.1089/jir.2011.0101. [DOI] [PMC free article] [PubMed] [Google Scholar]
- 62.Moudgil KD, Choubey D. 2011. Cytokines in autoimmunity: role in induction, regulation, and treatment. J Interferon Cytokine Res 31:695–703. doi: 10.1089/jir.2011.0065. [DOI] [PMC free article] [PubMed] [Google Scholar]
- 63.Mott KR, Underhill D, Wechsler SL, Ghiasi H. 2008. Lymphoid-related CD11c+CD8a+ dendritic cells are involved in enhancing HSV-1 latency. J Virol 82:9870–9879. doi: 10.1128/JVI.00566-08. [DOI] [PMC free article] [PubMed] [Google Scholar]
- 64.Jablonski KA, Amici SA, Webb LM, Ruiz-Rosado JD, Popovich PG, Partida-Sanchez S, Guerau-de-Arellano M. 2015. Novel markers to delineate murine M1 and M2 macrophages. PLoS One 10:e0145342. doi: 10.1371/journal.pone.0145342. [DOI] [PMC free article] [PubMed] [Google Scholar]
- 65.Rose S, Misharin A, Perlman H. 2012. A novel Ly6C/Ly6G-based strategy to analyze the mouse splenic myeloid compartment. Cytometry A 81:343–350. doi: 10.1002/cyto.a.22012. [DOI] [PMC free article] [PubMed] [Google Scholar]
- 66.Kigerl KA, Gensel JC, Ankeny DP, Alexander JK, Donnelly DJ, Popovich PG. 2009. Identification of two distinct macrophage subsets with divergent effects causing either neurotoxicity or regeneration in the injured mouse spinal cord. J Neurosci 29:13435–13444. doi: 10.1523/JNEUROSCI.3257-09.2009. [DOI] [PMC free article] [PubMed] [Google Scholar]
- 67.Mott KR, Bresee CJ, Allen SJ, BenMohamed L, Wechsler SL, Ghiasi H. 2009. Level of herpes simplex virus type 1 latency correlates with severity of corneal scarring and exhaustion of CD8+ T cells in trigeminal ganglia of latently infected mice. J Virol 83:2246–2254. doi: 10.1128/JVI.02234-08. [DOI] [PMC free article] [PubMed] [Google Scholar]
- 68.Allen SJ, Hamrah P, Gate DM, Mott KR, Mantopoulos D, Zheng L, Town T, Jones C, von Andrian UH, Freeman GJ, Sharpe AH, Benmohamed L, Ahmed R, Wechsler SL, Ghiasi H. 2011. The role of LAT in increased CD8+ T cell exhaustion in trigeminal ganglia of mice latently infected with herpes simplex virus type 1. J Virol 85:4184–4197. doi: 10.1128/JVI.02290-10. [DOI] [PMC free article] [PubMed] [Google Scholar]
- 69.Binder PS. 1984. A review of the treatment of ocular herpes simplex infections in the neonate and immunocompromised host. Cornea 3:178–182. [PubMed] [Google Scholar]
- 70.Liesegang TJ. 1999. Classification of herpes simplex virus keratitis and anterior uveitis. Cornea 18:127–143. doi: 10.1097/00003226-199903000-00001. [DOI] [PubMed] [Google Scholar]
- 71.Liesegang TJ. 2001. Herpes simplex virus epidemiology and ocular importance. Cornea 20:1–13. doi: 10.1097/00003226-200101000-00001. [DOI] [PubMed] [Google Scholar]
- 72.D'Andrea A, Rengaraju M, Valiante NM, Chehimi J, Kubin M, Aste M, Chan SH, Kobayashi M, Young D, Nickbarg E, Chizzonite R, Wolf SF, Trinchieri G. 1992. Production of natural killer cell stimulatory factor (interleukin 12) by peripheral blood mononuclear cells. J Exp Med 176:1387–1398. doi: 10.1084/jem.176.5.1387. [DOI] [PMC free article] [PubMed] [Google Scholar]
- 73.Schwarz T. 1995. Interleukin-12 and its role in cutaneous sensitization. Res Immunol 146:494–499. doi: 10.1016/0923-2494(96)83022-7. [DOI] [PubMed] [Google Scholar]
- 74.Chan SH, Perussia B, Gupta JW, Kobayashi M, Pospisil M, Young HA, Wolf SF, Young D, Clark SC, Trinchieri G. 1991. Induction of interferon gamma production by natural killer cell stimulatory factor: characterization of the responder cells and synergy with other inducers. J Exp Med 173:869–879. doi: 10.1084/jem.173.4.869. [DOI] [PMC free article] [PubMed] [Google Scholar]
- 75.Brunda MJ. 1994. Interleukin-12. J Leukoc Biol 55:280–288. [DOI] [PubMed] [Google Scholar]
- 76.Godfrey DI, Kennedy J, Gately MK, Hakimi J, Hubbard BR, Zlotnik A. 1994. IL-12 influences intrathymic T cell development. J Immunol 152:2729–2735. [PubMed] [Google Scholar]
- 77.Macatonia SE, Hosken NA, Litton M, Vieira P, Hsieh CS, Culpepper JA, Wysocka M, Trinchieri G, Murphy KM, O'Garra A. 1995. Dendritic cells produce IL-12 and direct the development of Th1 cells from naive CD4+ T cells. J Immunol 154:5071–5079. [PubMed] [Google Scholar]
- 78.Guler ML, Gorham JD, Hsieh CS, Mackey AJ, Steen RG, Dietrich WF, Murphy KM. 1996. Genetic susceptibility to Leishmania: IL-12 responsiveness in TH1 cell development. Science 271:984–987. doi: 10.1126/science.271.5251.984. [DOI] [PubMed] [Google Scholar]
- 79.Reichard AC, Cheemarla NR, Bigley NJ. 2015. SOCS1/3 expression levels in HSV-1-infected, cytokine-polarized and -unpolarized macrophages. J Interferon Cytokine Res 35:32–41. doi: 10.1089/jir.2013.0070. [DOI] [PMC free article] [PubMed] [Google Scholar]
- 80.O'Neill LA, Pearce EJ. 2016. Immunometabolism governs dendritic cell and macrophage function. J Exp Med 213:15–23. doi: 10.1084/jem.20151570. [DOI] [PMC free article] [PubMed] [Google Scholar]
- 81.Davies LC, Jenkins SJ, Allen JE, Taylor PR. 2013. Tissue-resident macrophages. Nat Immunol 14:986–995. doi: 10.1038/ni.2705. [DOI] [PMC free article] [PubMed] [Google Scholar]
- 82.Tang Q, Chen W, Hendricks RL. 1997. Proinflammatory functions of IL-2 in herpes simplex virus corneal infection. J Immunol 158:1275–1283. [PubMed] [Google Scholar]
- 83.Montaner LJ, da Silva RP, Sun J, Sutterwala S, Hollinshead M, Vaux D, Gordon S. 1999. Type 1 and type 2 cytokine regulation of macrophage endocytosis: differential activation by IL-4/IL-13 as opposed to IFN-gamma or IL-10. J Immunol 162:4606–4613. [PubMed] [Google Scholar]
- 84.Barber DL, Wherry EJ, Masopust D, Zhu B, Allison JP, Sharpe AH, Freeman GJ, Ahmed R. 2006. Restoring function in exhausted CD8 T cells during chronic viral infection. Nature 439:682–687. doi: 10.1038/nature04444. [DOI] [PubMed] [Google Scholar]
- 85.Perng GC, Dunkel EC, Geary PA, Slanina SM, Ghiasi H, Kaiwar R, Nesburn AB, Wechsler SL. 1994. The latency-associated transcript gene of herpes simplex virus type 1 (HSV-1) is required for efficient in vivo spontaneous reactivation of HSV-1 from latency. J Virol 68:8045–8055. [DOI] [PMC free article] [PubMed] [Google Scholar]
- 86.Mott KR, Allen SJ, Zandian M, Akbari O, Hamrah P, Maazi H, Wechsler SL, Sharpe AH, Freeman GJ, Ghiasi H. 2014. Inclusion of CD80 in HSV targets the recombinant virus to PD-L1 on DCs and allows productive infection and robust immune responses. PLoS One 9:e87617. doi: 10.1371/journal.pone.0087617. [DOI] [PMC free article] [PubMed] [Google Scholar]
- 87.Matundan HH, Mott KR, Allen SJ, Wang S, Bresee CJ, Ghiasi YN, Town T, Wechsler SL, Ghiasi H. 2016. Interrelationship of primary virus replication, level of latency, and time to reactivation in the trigeminal ganglia of latently infected mice. J Virol 90:9533–9542. doi: 10.1128/JVI.01373-16. [DOI] [PMC free article] [PubMed] [Google Scholar]
- 88.Jurado JO, Alvarez IB, Pasquinelli V, Martinez GJ, Quiroga MF, Abbate E, Musella RM, Chuluyan HE, Garcia VE. 2008. Programmed death (PD)-1:PD-ligand 1/PD-ligand 2 pathway inhibits T cell effector functions during human tuberculosis. J Immunol 181:116–125. doi: 10.4049/jimmunol.181.1.116. [DOI] [PubMed] [Google Scholar]
- 89.Liu T, Khanna KM, Chen X, Fink DJ, Hendricks RL. 2000. CD8(+) T cells can block herpes simplex virus type 1 (HSV-1) reactivation from latency in sensory neurons. J Exp Med 191:1459–1466. doi: 10.1084/jem.191.9.1459. [DOI] [PMC free article] [PubMed] [Google Scholar]
- 90.Khanna KM, Bonneau RH, Kinchington PR, Hendricks RL. 2003. Herpes simplex virus-specific memory CD8+ T cells are selectively activated and retained in latently infected sensory ganglia. Immunity 18:593–603. doi: 10.1016/S1074-7613(03)00112-2. [DOI] [PMC free article] [PubMed] [Google Scholar]
- 91.Liu T, Khanna KM, Carriere BN, Hendricks RL. 2001. Gamma interferon can prevent herpes simplex virus type 1 reactivation from latency in sensory neurons. J Virol 75:11178–11184. doi: 10.1128/JVI.75.22.11178-11184.2001. [DOI] [PMC free article] [PubMed] [Google Scholar]
- 92.Mott KR, Gate D, Matundan HH, Ghiasi YN, Town T, Ghiasi H. 2016. CD8+ T cells play a bystander role in mice latently infected with herpes simplex virus 1. J Virol 90:5059–5067. doi: 10.1128/JVI.00255-16. [DOI] [PMC free article] [PubMed] [Google Scholar]
- 93.Matundan H, Mott KR, Ghiasi H. 2014. Role of CD8+ T cells and myeloid DCs in protection from ocular HSV-1 challenge in immunized mice. J Virol 88:8016–8027. doi: 10.1128/JVI.00913-14. [DOI] [PMC free article] [PubMed] [Google Scholar]
- 94.Khallou-Laschet J, Varthaman A, Fornasa G, Compain C, Gaston AT, Clement M, Dussiot M, Levillain O, Graff-Dubois S, Nicoletti A, Caligiuri G. 2010. Macrophage plasticity in experimental atherosclerosis. PLoS One 5:e8852. doi: 10.1371/journal.pone.0008852. [DOI] [PMC free article] [PubMed] [Google Scholar]
- 95.Panitch HS, Hirsch RL, Schindler J, Johnson KP. 1987. Treatment of multiple sclerosis with gamma interferon: exacerbations associated with activation of the immune system. Neurology 37:1097–1102. doi: 10.1212/WNL.37.7.1097. [DOI] [PubMed] [Google Scholar]
- 96.Zandian M, Mott KR, Allen SJ, Dumitrascu O, Kuo JZ, Ghiasi H. 2011. Use of cytokine immunotherapy to block CNS demyelination induced by a recombinant HSV-1 expressing murine interleukin-2. Gene Ther 18:734–742. doi: 10.1038/gt.2011.32. [DOI] [PMC free article] [PubMed] [Google Scholar]
- 97.Anower AK, Shim JA, Choi B, Kwon HJ, Sohn S. 2014. The role of classical and alternative macrophages in the immunopathogenesis of herpes simplex virus-induced inflammation in a mouse model. J Dermatol Sci 73:198–208. doi: 10.1016/j.jdermsci.2013.11.001. [DOI] [PubMed] [Google Scholar]
- 98.Alonso-Trujillo J, Rivera-Montoya I, Rodriguez-Sosa M, Terrazas LI. 2007. Nitric oxide contributes to host resistance against experimental Taenia crassiceps cysticercosis. Parasitol Res 100:1341–1350. doi: 10.1007/s00436-006-0424-4. [DOI] [PubMed] [Google Scholar]
- 99.El Kasmi KC, Qualls JE, Pesce JT, Smith AM, Thompson RW, Henao-Tamayo M, Basaraba RJ, Konig T, Schleicher U, Koo MS, Kaplan G, Fitzgerald KA, Tuomanen EI, Orme IM, Kanneganti TD, Bogdan C, Wynn TA, Murray PJ. 2008. Toll-like receptor-induced arginase 1 in macrophages thwarts effective immunity against intracellular pathogens. Nat Immunol 9:1399–1406. doi: 10.1038/ni.1671. [DOI] [PMC free article] [PubMed] [Google Scholar]
- 100.Martinez FO, Helming L, Gordon S. 2009. Alternative activation of macrophages: an immunologic functional perspective. Annu Rev Immunol 27:451–483. doi: 10.1146/annurev.immunol.021908.132532. [DOI] [PubMed] [Google Scholar]
- 101.Cassol E, Cassetta L, Rizzi C, Alfano M, Poli G. 2009. M1 and M2a polarization of human monocyte-derived macrophages inhibits HIV-1 replication by distinct mechanisms. J Immunol 182:6237–6246. doi: 10.4049/jimmunol.0803447. [DOI] [PubMed] [Google Scholar]
- 102.Shtein RM, Elner VM. 2010. Herpes simplex virus keratitis: histopathology and corneal allograft outcomes. Exp Rev Ophthalmol 5:129–134. doi: 10.1586/eop.10.12. [DOI] [PMC free article] [PubMed] [Google Scholar]
- 103.Bauer D, Mrzyk S, van Rooijen N, Steuhl KP, Heiligenhaus A. 2000. Macrophage-depletion influences the course of murine HSV-1 keratitis. Curr Eye Res 20:45–53. doi: 10.1076/0271-3683(200001)2011-HFT045. [DOI] [PubMed] [Google Scholar]
- 104.Cheng H, Tumpey TM, Staats HF, van Rooijen N, Oakes JE, Lausch RN. 2000. Role of macrophages in restricting herpes simplex virus type 1 growth after ocular infection. Invest Ophthalmol Vis Sci 41:1402–1409. [PubMed] [Google Scholar]
- 105.Hamrah P, Dana MR. 2007. Corneal antigen-presenting cells. Chem Immunol Allergy 92:58–70. doi: 10.1159/000099254. [DOI] [PubMed] [Google Scholar]
- 106.Mott KR, Ghiasi H. 2008. Role of dendritic cells in enhancement of herpes simplex virus type 1 latency and reactivation in vaccinated mice. Clin Vaccine Immunol 15:1859–1867. doi: 10.1128/CVI.00318-08. [DOI] [PMC free article] [PubMed] [Google Scholar]
- 107.Osorio Y, Cohen J, Ghiasi H. 2004. Improved protection from primary ocular HSV-1 infection and establishment of latency using multigenic DNA vaccines. Invest Ophthalmol Vis Sci 45:506–514. doi: 10.1167/iovs.03-0828. [DOI] [PubMed] [Google Scholar]
- 108.Osorio Y, Cai S, Ghiasi H. 2005. Treatment of mice with anti-CD86 mAb reduces CD8+ T cell-mediated CTL activity and enhances ocular viral replication in HSV-1-infected mice. Ocul Immunol Inflamm 13:159–167. doi: 10.1080/09273940490518775. [DOI] [PubMed] [Google Scholar]
- 109.Ghiasi H, Cai S, Perng GC, Nesburn AB, Wechsler SL. 2000. Both CD4+ and CD8+ T cells are involved in protection against HSV-1 induced corneal scarring. Br J Ophthalmol 84:408–412. doi: 10.1136/bjo.84.4.408. [DOI] [PMC free article] [PubMed] [Google Scholar]
- 110.Allen SJ, Rhode-Kurnow A, Mott KR, Jiang X, Carpenter D, Rodriguez-Barbosa JI, Jones C, Wechsler SL, Ware CF, Ghiasi H. 2014. Regulatory interactions between herpesvirus entry mediator (TNFRSF14) and latency associated transcript (LAT) during HSV-1 latency. J Virol 88:1961–1971. doi: 10.1128/JVI.02467-13. [DOI] [PMC free article] [PubMed] [Google Scholar]