Summary
Ultra-widefield fluorescein angiography (UWFA) is an emerging imaging modality used to characterize pathology in the retinal vasculature such as microaneurysms (MA) and vascular leakage. Despites its potential value for diagnosis and disease surveillance, objective quantitative assessment of retinal pathology by UWFA is currently limited because it requires laborious manual segmentation by trained human graders. In this report, we describe a novel fully automated software platform, which segments MAs and leakage areas in native and dewarped UWFA images with retinal vascular disease. Comparison of the algorithm to human grader generated gold standards demonstrated significant strong correlations for MA and leakage areas (ICC=0.78-0.87 and ICC=0.70-0.86, respectively, p=2.1×10⁻⁷ to 3.5×10⁻¹⁰ and p=7.8×10⁻⁶ to 1.3×10⁻⁹, respectively). These results suggest the algorithm performs similarly to human graders in MA and leakage segmentation and may be of significant utility in clinical and research settings.
Introduction
The recent development of ultra-widefield fluorescein angiography (UWFA) imaging systems have produced images with a 200° field of view [1] that can visualize up to 3.2 times more retinal area compared to the conventional 7 standard field imaging implemented by the Early Treatment of Diabetic Retinopathy Study [2, 3]. With this new technology, significant vascular pathology in retinal disorders can be observed in the retinal periphery, which was previously overlooked with standard field FA. However, objective quantification and automated detection of pathology including microaneurysms (MA) and leakage regions remains out of reach. Currently, quantification requires manual segmentation and remains too laborious to be practical. Consequently, clinical trials and in-office assessment of retinal vascular disease have been unable to utilize quantification of FA imaging as an evaluative clinical tool or as an endpoint in clinical trials [4-10].
In this report, we describe the development and evaluation of a novel fully automated algorithm to detect and quantify MAs and leakage in UWFA images. This technology may provide new opportunities for detection, analysis, and evaluation of underlying pathology, disease burden, and disease characterization that may have important clinical and research applications.
Methods
This is an IRB-approved image analysis study to retrospectively evaluate UWFA imaging using the Optos 200Tx (Optos, Scotland). A single early- and single late-phase image were selected for MA and leakage analysis. Images included in the study belonged to patients with diabetic retinopathy treated at the Cleveland Clinic. Inclusion criteria for the study were as follows: successful acquisition of 200Tx images, diabetic retinopathy based on clinical examination, angiographic images in both early and late phase. Exclusion criteria for this study include prior laser photocoagulation, poor image quality, media opacity, and severe artifacts obscuring view.
Image Acquisition and Dewarping
Native UWFA images from the Optos 200Tx have inherent warping and peripheral distortion due to the projection of a three-dimensional spherical shape onto a two-dimensional plane. Images were processed by dewarping the standard UWFA images through transformation of the image into a stereographic projection of the eye, as previously described [11]. The three-dimensional model was mapped to a two-dimensional stereographic projection by projecting all relevant pixels to a plane through the equator of the eye [11]. Both native and dewarped images were analyzed with the segmentation platforms.
Automated Microaneurysm Detection Platform
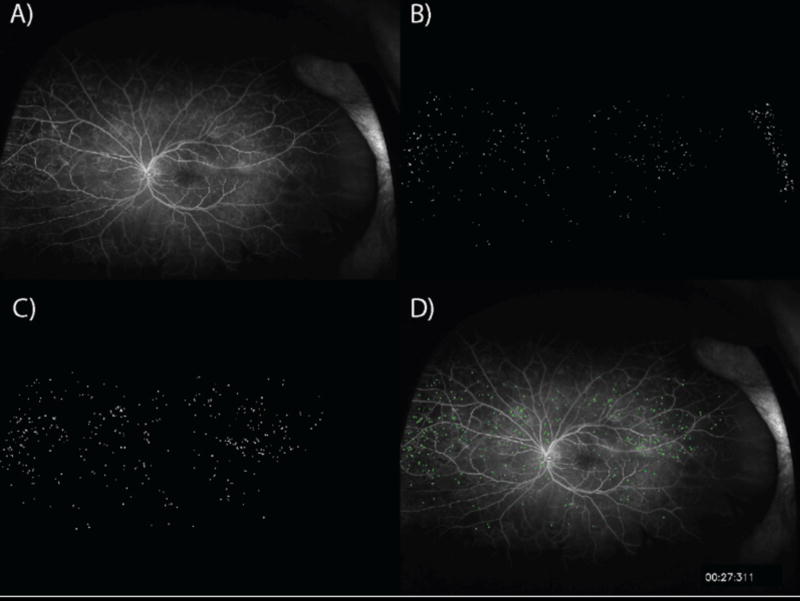
An automated segmentation and detection algorithm was developed for MA analysis based on a preliminary training set that utilized ongoing iterative feedback from expert readers. Following algorithm development, validation testing was performed. The MA algorithm developed utilized a two-step process for analysis. Candidate MAs were first identified. Initial detection of MAs involved application of a difference of Gaussians routine followed by spectral equalization on an early phase image (Figure 1). Following identification, the candidate objects were refined based on local intensity gradients. The intensity variance around each MA candidate was then evaluated. Objects that have a boundary intensity that is not significantly different to its immediate surrounding are eliminated as candidate MAs. Following refinement, the resulting segmented MAs are counted in a zonal fashion within concentric rings around the optic nerve centroid.
Figure 1. Automated microaneurysm detection.
A) An early time point ultra-widefield fluorescein angiogram image is selected. B) Initial detection of candidate microaneurysms (MAs). C) Candidate MAs are filtered based on peripheral intensity gradient. D) MAs are superimposed upon original early phase image.
Automated Leakage Detection Platform
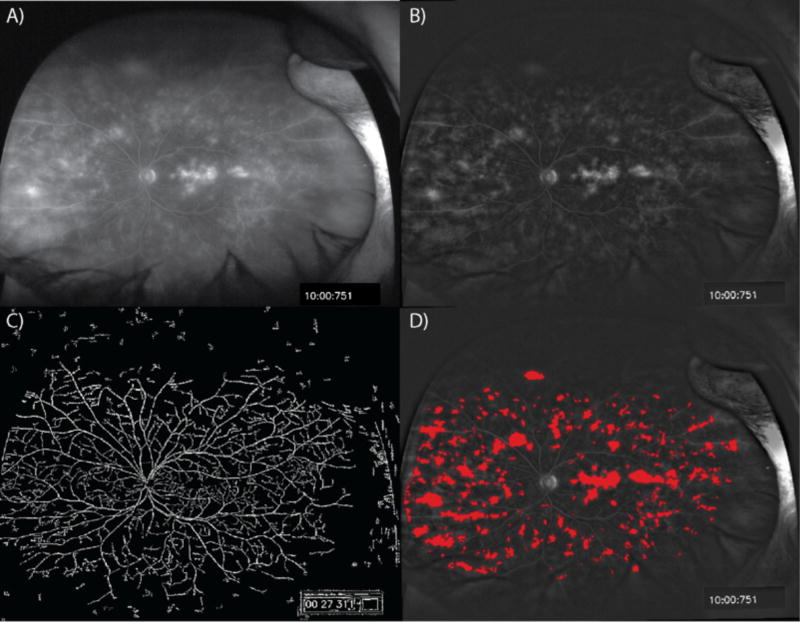
Similar to the MA assessment algorithm, an automated leakage segmentation and detection algorithms was developed based on initial iterative feedback from expert readers on an initial preliminary training set. Following initial algorithm development, validation testing was performed. In order to evaluate the time-dependent change in hyperfluorescence that represents leakage, the algorithm utilizes both the early and late-phase image to provide an assessment of change over time. Following retinal vascular segmentation, early and late image registration is first performed Registration using Fourier correlation of retinal vascular patterns is utilized to account for rotation and translation of images during acquisition. Following registration, the late-phase image is “flattened” to remove the intensity gradient from the optic disc to the image periphery (Figure 2). The late-phase image is then spectrally enhanced to equalize the intensity of leakage regions and enable application of a fixed threshold for segmentation of candidate leakage areas. Vessels, which are accentuated in the late-phase image by this process, are removed by filtering corresponding vessels in the early-phase images using a Gaussian convolution kernel. The segmented leakage regions are pseudo-colored and superimposed upon the original late-phase image.
Figure 2. Automated leakage detection.
A) A sample late time point ultra-widefield fluorescein angiogram (UWFA) image taken by the Optos 200Tx System. B) “Flattened” late image with removal of intensity gradient from optic disc to the periphery. C) Removal of vessels utilizing early time point UWFA image. D) Leakage areas are superimposed upon flattened late UWFA image.
Quantitative Assessment of Algorithm Performance
MA and leakage were manually segmented and quantified in early- and late-phase FA images respectively by two independent expert graders using ImageJ v1.49. Prior to manual segmentation, graders went through a training course assembled by an expert reader to standardize definitions of MA and leakage. MAs were defined as small circular objects significantly hyperfluorescent compared to surrounding choroidal background in early-mid phase UWFA images. A minimum fluorescence intensity similar to adjacent vessels was also required. Leakage was defined as a region of increasing hyperfluorescence in size and intensity in the late phase angiogram compared to AV-transit phase, noted as hyperfluorescent regions in the transformed processed images. Registered MA's and leakage areas were quantified by MA counts and pixel area respectively using ImageJ.
Algorithm performance was evaluated against manual segmentation gold standards through correlation analysis. The gold standards for MA and leakage were derived using a two-way analysis of variance (ANOVA) approach. Specifically, an estimated individual effect for each human grader was derived by a fitted two-way ANOVA model. Each estimated individual effect was removed from total MA counts or leakage areas before values were averaged amongst human graders to generate the gold standard. Intraclass correlation coefficients (ICC) and Pearson's r (r) between algorithm-defined and gold standard for MA counts and leakage areas were calculated to assess for correlation.
Results
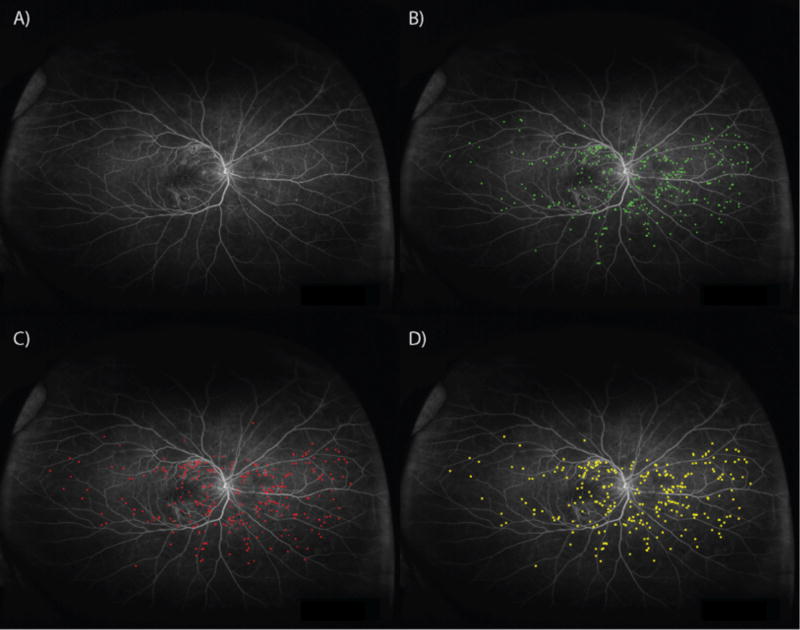
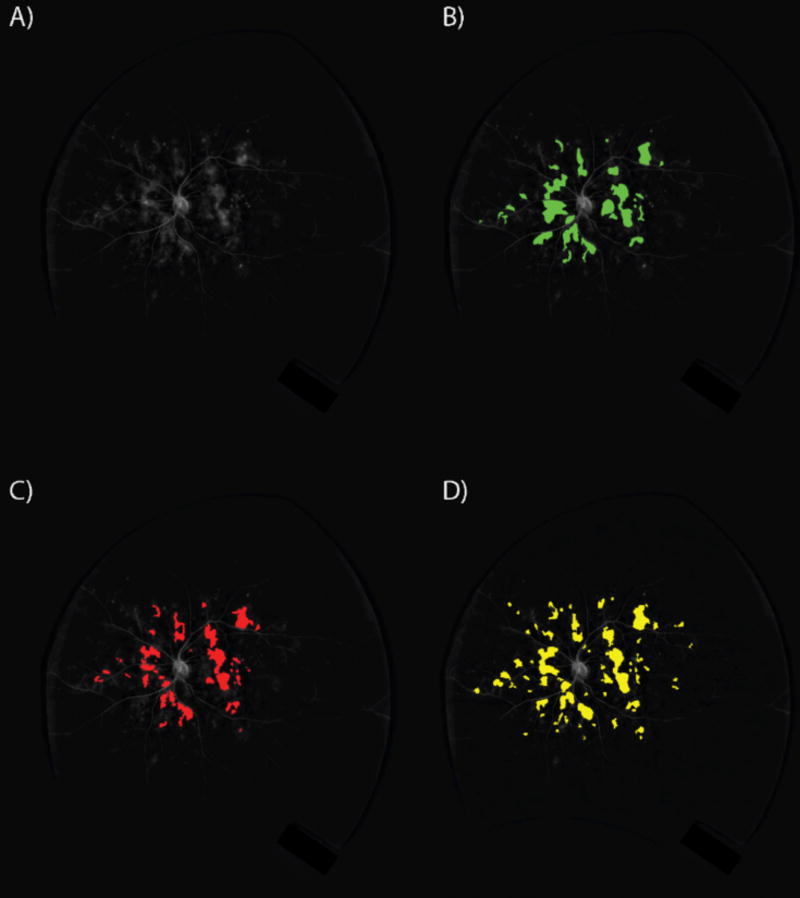
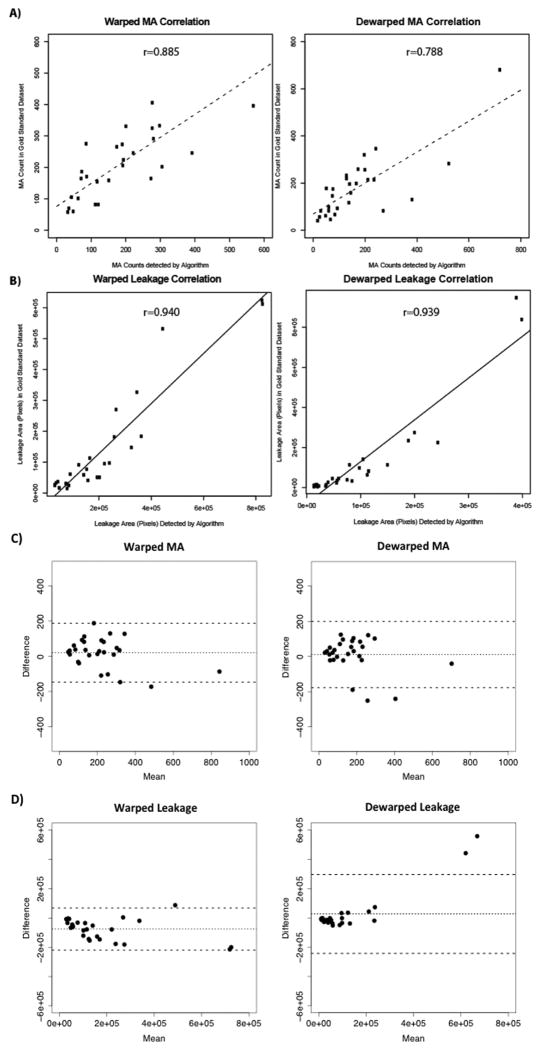
In total, 56 dewarped UWFA images and 56 standard UWFA images were analyzed with algorithm segmentation of MA and leakage in standard and dewarped UWFA images. Representative comparisons between automated versus manual MA and leakage segmentation are displayed in figure 3 and figure 4, respectively. Comparison of raw MA counts and leakage areas between the gold standard set and algorithm confirmed significant direct correlation in both dewarped and native images (Figure 5). Specifically in MA detection, the ICC was 0.78 in the dewarped images and 0.87 in the native images (P-value = 2.1×10⁻⁷ and 3.5×10⁻¹⁰, respectively) and the r values were 0.788 and 0.885 for dewarped and native images, respectively (Figure 5A, P-value = 6.47×10⁻⁷ and 4.27×10⁻¹⁰, respectively). In leakage detection, the ICC was 0.70 in the dewarped images and 0.86 in the native images (P-value = 7.8×10⁻⁶and 1.3×10⁻⁹) and the r values were 0.940 and 0.939 for dewarped and native images respectively (Figure 5B, P-value = 1.24e-13 and 4.53e-13, respectively). Bland-Altman plots demonstrate strong association between the manual and automated methods of quantification in both MA and leakage parameters (Figure 5C and 5D).
Figure 3. Microaneurysm detection.
A) Ultra-widefield angiogram analyzed by B) grader 1, C) grader 2, and D) automated algorithm. The number of microaneurysms detected by grader 1, grader 2 and algorithm were 355, 295, and 335 respectively.
Figure 4. Leakage detection.
A) A dewarped ultra-widefield angiogram analyzed by B) grader 1, C) grader 2, and D) algorithm. Leakage areas of grader 1, grader 2, and algorithm were 122854, 101632, and 150793 pixels respectively.
Figure 5. Comparison of algorithm detection to expert reader gold standard identification of pathologic features.
Correlation of A) MA counts and B) leakage areas segmented by algorithm and gold standard. Leakage areas were measured in pixels. Lines represent line of best fit by linear regression. Bland-Altman plots of C) MA and D) leakage comparing manual segmentation to automated segmentation.
Discussion
This study represents a new innovation in fully automated quantitative assessment of MA and leakage in UWFA images. Our results displayed significant correlation between automated segmentation and expert-reader generated gold standards. To date, FA remains a critical tool for diagnosing and assessing progression of retinal disease in clinical and research settings. Segmentation in MA and leakage is challenging given image artifacts and various media opacities (e.g., eyelashes, lenticular opacities). Additional previous reports of automated leakage quantification have assessed retinopathy secondary to malaria and diabetic retinopathy [12-13]. One major difference between the technique described in our report and other previously described analysis platforms is the capability for panretinal assessment through the use of the UWFA. In one previous report, the field evaluated was from 50° images obtained by Topcon 50-EX system [12]. In the diabetic retinopathy report, image analysis focused on the posterior pole [13].. The assessment of global retinal leakage by UWFA using this technology can highlight potentially clinically significant pathology in the retinal periphery and facilitate monitoring of overall disease activity in retinal vascular diseases, such as diabetic retinopathy and inflammatory eye disease.
Challenges encountered with segmentation include image quality issues, media opacities, and artifacts (e.g. lashes). Other image features that require unique consideration for segmentation include chorioretinal scarring, such as from previous laser photocoagulation. Additional development plans for automated assessment will include zonal-based assessment, higher-order pathology discrimination (e.g., perivascular vs. generalized leakage), and identification of artifacts and regions of interest. Additional prospective research is needed to better understand the role of automated detection and quantification in outcomes and therapeutic decision-making. Our group is currently evaluating this algorithm in two prospective clinical trials to provide robust data for assessment of quantitative angiography in retinal vascular disease (NCT01982435 and NCT02503540). Areas of active research includes\development of automated quantification of retinal ischemia, integrative pattern analysis and utilization of these integrative tools as imaging biomarkers.
Acknowledgments
Financial Support: NIH/NEI K23-EY022947-01A1 (JPE); Ohio Department of Development TECH-13-059 (JPE, SKS); Research to Prevent Blindness (Cole Eye Institutional);
Footnotes
Financial Disclosures: JPE: Bioptigen (C, P), Thrombogenics (C, R), Synergetics (P), Genentech (R), Regeneron (R), Leica (C), Zeiss (C), Santen (C) Alcon (C), Alimera (C), Santen (C); KW: None; AV: ImageIQ (E); MH: SKS: Bausch and Lomb (C, F); Bioptigen (P); Allergan (R); Synergetics (P); Leica (C), Santen (C), Carl Zeiss Meditec (C);
References
- 1.Manivannan A, et al. Ultra-wide-field fluorescein angiography of the ocular fundus. Am J Ophthalmol. 2005;140(3):525–7. doi: 10.1016/j.ajo.2005.02.055. [DOI] [PubMed] [Google Scholar]
- 2.Wessel MM, et al. Ultra-wide-field angiography improves the detection and classification of diabetic retinopathy. Retina. 2012;32(4):785–91. doi: 10.1097/IAE.0b013e3182278b64. [DOI] [PubMed] [Google Scholar]
- 3.Grading diabetic retinopathy from stereoscopic color fundus photographs--an extension of the modified Airlie House classification. ETDRS report number 10. Early Treatment Diabetic Retinopathy Study Research Group. Ophthalmology. 1991;98(5 Suppl):786–806. [PubMed] [Google Scholar]
- 4.The effect of intensive treatment of diabetes on the development and progression of long-term complications in insulin-dependent diabetes mellitus. The Diabetes Control and Complications Trial Research Group. N Engl J Med. 1993;329(14):977–86. doi: 10.1056/NEJM199309303291401. [DOI] [PubMed] [Google Scholar]
- 5.Color photography vs fluorescein angiography in the detection of diabetic retinopathy in the diabetes control and complications trial. The Diabetes Control and Complications Trial Research Group. Arch Ophthalmol. 1987;105(10):1344–51. doi: 10.1001/archopht.1987.01060100046022. [DOI] [PubMed] [Google Scholar]
- 6.Diabetic Retinopathy Clinical Research, N et al. Randomized trial evaluating ranibizumab plus prompt or deferred laser or triamcinolone plus prompt laser for diabetic macular edema. Ophthalmology. 2010;117(6):1064–1077 e35. doi: 10.1016/j.ophtha.2010.02.031. [DOI] [PMC free article] [PubMed] [Google Scholar]
- 7.Photocoagulation treatment of proliferative diabetic retinopathy. Clinical application of Diabetic Retinopathy Study (DRS) findings, DRS Report Number 8. The Diabetic Retinopathy Study Research Group. Ophthalmology. 1981;88(7):583–600. [PubMed] [Google Scholar]
- 8.Ferris FL., 3rd Photocoagulation for diabetic retinopathy. Early Treatment Diabetic Retinopathy Study Research Group. JAMA. 1991;266(9):1263–5. doi: 10.1001/jama.266.9.1263. [DOI] [PubMed] [Google Scholar]
- 9.Photocoagulation therapy for diabetic eye disease. Early Treatment Diabetic Retinopathy Study Research Group. JAMA. 1985;254(21):3086. [PubMed] [Google Scholar]
- 10.Mitchell P, et al. The RESTORE study: ranibizumab monotherapy or combined with laser versus laser monotherapy for diabetic macular edema. Ophthalmology. 2011;118(4):615–25. doi: 10.1016/j.ophtha.2011.01.031. [DOI] [PubMed] [Google Scholar]
- 11.Croft DE, et al. Precise montaging and metric quantification of retinal surface area from ultra-widefield fundus photography and fluorescein angiography. Ophthalmic Surg Lasers Imaging Retina. 2014;45(4):312–7. doi: 10.3928/23258160-20140709-07. [DOI] [PubMed] [Google Scholar]
- 12.Zhao Y, et al. Automated detection of leakage in fluorescein angiography images with application to malarial retinopathy. Sci Rep. 2015;5:10425. doi: 10.1038/srep10425. [DOI] [PMC free article] [PubMed] [Google Scholar]
- 13.Rabbani H, et al. Fully automatic segmentation of fluorescein leakage in subjects with diabetic macular edema. Invest Ophthalmol Vis Sci. 2015;56(3):1482–92. doi: 10.1167/iovs.14-15457. [DOI] [PMC free article] [PubMed] [Google Scholar]


