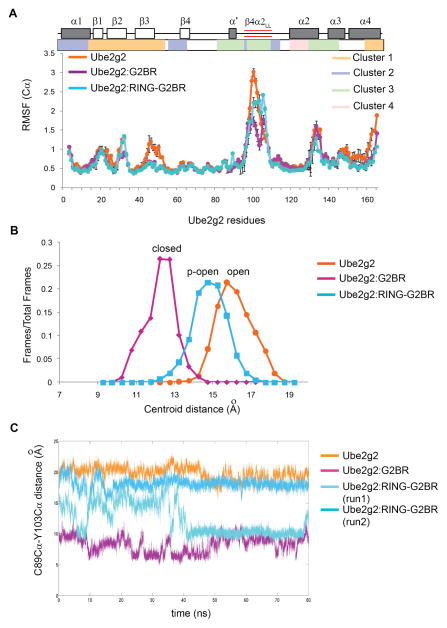
Figure 5. Comparison of dynamics for three states of Ube2g2 from MD simulations.
(A) Comparison of per-residue Cα RMSF profiles (mean + SEM, n = 3 trajectories) of Ube2g2 in Ube2g2, Ube2g2:G2BR and Ube2g2:RING-G2BR. Secondary structural elements, extended loop, and clusters are shown as in Figure 2. (B) Populations (fraction of frames) versus the distance between the centroid of the extended loop and C89-Cα are plotted based on trajectories for Ube2g2, Ube2g2:G2BR and Ube2g2:RING-G2BR. The conformation of the active site and the β4α2 loop corresponding to the maximum population is termed ‘open’ for Ube2g2, ‘closed’ for Ube2g2 and partially open ‘p-open’ for Ube2g2:RING-G2BR. (C) Trajectories for the C89Cα-Y103Cα distance in Ube2g2 in free Ube2g2 (orange), Ube2g2:G2BR (magenta) and two runs of Ube2g2:RING-G2BR (cyan and light-cyan). See also Figure S4 and Table S1.

