

Abstract
This study aimed to identify facility-level characteristics associated with prevention of mother-to-child HIV transmission service quality. This cross-sectional study sampled 60 health facilities in Mozambique, Côte d’Ivoire, and Kenya (20 per country). Performance score – the proportion of pregnant women tested for HIV in first antenatal care visit, multiplied by the proportion of HIV-positive pregnant women who received appropriate antiretroviral medications – was calculated for each facility using routine data from 2012 to 2013. Facility characteristics were ascertained during on-site visits, including workload. Associations between facility characteristics and performance were quantified using generalized linear models with robust standard errors, adjusting for country. Over six months, facilities saw 38,611 first antenatal care visits in total. On-site CD4 testing, Pima CD4 machine, air conditioning, and low or high (but not mid-level) patient volume were each associated with higher performance scores. Each additional first antenatal care visit per nurse per month was associated with a 4% (95% confidence interval: 1%–6%) decline in the odds that an HIV-positive pregnant woman would receive both HIV testing and antiretroviral medications. Physician workload was only modestly associated with performance. Investments in infrastructure and human resources – particularly nurses – may be critical to improve prevent mother-to-child HIV transmission service delivery and protect infants from HIV.
Keywords: HIV, Africa, prevention, women, highly active antiretroviral therapy
Introduction
Effective, affordable, and scalable strategies are urgently needed to improve the delivery of services to prevent mother-to-child HIV transmission (PMTCT), which has been conceptualized into four “prongs”: prevention of (1) HIV infections among women, (2) unintended pregnancies among HIV-positive women, (3) vertical transmission from HIV-infected pregnant women, and (4) providing ongoing care for mother with HIV and their infants. In developed countries, interventions that target the third PMTCT prong have reduced the rate of vertical HIV transmission to less than 1%.1 In sub-Saharan Africa, only half of HIV-positive women receive antiretroviral (ARV) medications or antiretroviral therapy (ART) during pregnancy.2 Despite high antenatal care (ANC) utilization, unacceptably high drop-offs across the PMTCT cascade contributed to 230,000 new pediatric HIV infections in sub-Saharan Africa in 2012.3
Health systems can have dramatic impacts on health service delivery,4 as evidenced by the wide variation in testing and ARV coverage between health facilities, even in similar settings.2 Health worker shortages, stockouts of test kits or ARVs, services for patients such as support groups, and integration of PMTCT with ANC may each affect PMTCT service delivery.5–8 Identifying health systems factors – particularly those that are modifiable – that impact the quality of care is therefore crucial to maximize the effectiveness of ART.9
Though many studies have investigated correlates of ART coverage2 and retention in care,7 such research has been framed in terms of identifying individual characteristics that are associated with PMTCT uptake rather than characteristics of health facilities that are associated with high PMTCT service delivery. Those studies that do investigate health facility factors often only evaluate one or a few characteristics as an adjunct to the primary analysis,10 such as whether PMTCT is integrated in ANC, and therefore cannot compare the relative contribution of different health facility factors on PMTCT service delivery. Additionally, many studies have used the sole outcome of self-reported receipt of nevirapine,7 which is no longer recommended,11 and have included relatively few facilities over a limited geographic area. Though one study included 269 sites from 15 sub-Saharan African countries, its results may no longer be relevant, as its outcome was single-dose nevirapine use during 2002–2005.12 To inform current efforts to prevent infant HIV infections, generalizable data are needed on health facility factors associated with high-quality delivery of currently recommended PMTCT regimens.
No standard definition of PMTCT service quality exists. Actively observing clinical encounters13 or conducting in-depth interviews14 have been utilized to measure PMTCT quality, but such assessments may not be objective, scalable, or sustainable. Routine data have several advantages. By definition, routine data are readily available at minimal cost in any facility and can compare quality across diverse settings and over time. Routine data also reflect current PMTCT regimens and therefore adapt to changing guidelines. Previous work by our group has demonstrated that routine data can meaningfully classify facilities’ PMTCT performance.15 Despite the urgent need to quantify the quality of ARV delivery across facilities,9 few other studies have used routine data to describe performance. Only one16 has been conducted in the era of Option B+, but its performance definition was based on HIV testing and retention in care, not ARV coverage; others have examined nevirapine coverage.12,17
This exploratory study aimed to quantify the associations between a variety of health systems factors and delivery of high quality, currently recommended PMTCT in three countries in sub-Saharan Africa using routinely available health facility data.
Methods
This multi-country, cross-sectional study was part of a randomized trial investigating quality improvement to optimize PMTCT services.18 In total, 90 ANC facilities were sampled in Côte d’Ivoire, Kenya, and Mozambique (30 per country); countries that were chosen to reflect western, eastern, and southern sub-Saharan Africa. In Côte d’Ivoire, sites were selected from those that (a) partnered with Health Alliance International, a non-governmental organization affiliated with the University of Washington, and (b) saw ≥10 HIV-positive pregnant women in 2012. Of 31 eligible sites, one was randomly deleted. In Kenya, facilities were selected to maximize heterogeneity in HIV prevalence from among those affiliated with the Network of AIDS Researchers of Eastern and Southern Africa (NARESA). In Mozambique, all health facilities were selected in three districts within Sofala Province, where the Beira Operations Research Center is located; the districts were chosen for convenience and to include both urban and rural settings.
The 90 sampled facilities were ranked based on PMTCT performance score, defined as the proportion of pregnant women tested for HIV at first ANC visit (ANC1) multiplied by the proportion of HIV-positive pregnant women who received dual or triple ARV regimens, two key steps along the PMTCT cascade that have quantified facility performance previously.15 By taking their product, we calculated the proportion of eligible women who received both services. Only women on ART or with evidence of a positive HIV test would be exempt from HIV testing; self-report was not sufficient. Operationally, because study data were collected before Option B+, nearly all women should have received an HIV test during their first ANC visit. Monthly data were averaged over several months to provide stable estimates. In Côte d’Ivoire, testing coverage data were aggregated over January to June 2013, and ART coverage data were aggregated over July 2012 to June 2013 (registries distinguished between HIV tests in first or subsequent ANC visits beginning in January 2013). In Kenya, data were aggregated from January to June 2012, and in Mozambique, data were aggregated from January to December 2012. In Côte d’Ivoire and Mozambique, routine data to calculate performance scores were obtained from monthly reports; in Kenya, they were obtained directly from health facility registries.
Trained study assistants collected further data regarding health facility characteristics from the 10 highest and 10 lowest ranked facilities per country (n = 60), during in-person visits between May 2013 and January 2014. Whenever possible, data were obtained directly from the facility registry. Facility staff (facility director, director of Maternal & Child Health (MCH) services, and/or director of PMTCT services, as appropriate) were interviewed to obtain any data that was not or could not be documented in the registry.
Variables in the study instrument were chosen to reflect four of the six core areas of the WHO’s health system building blocks4: service delivery; health workforce; information; and medical products, vaccines, and technologies. Specifically, these included characteristics of facility setting (location; public/private/mixed; NGO support; year of PMTCT initiation; distance to reference laboratory; air conditioning), available services (community linkages; active tracing of women/children lost to follow-up; support groups for HIV-positive mothers; on-site CD4 testing; on-site Pima CD4 machine; stock-outs of ARVs and HIV tests; lag in receiving CD4 test results), patient volume (catchment area population; number of ANC1 visits, deliveries, and postpartum visits over the prior six months), and staffing (number of health workers of each cadre).
For the analysis, absolute performance score was used – rather than relative performance, which identified facilities for data collection – because ideally PMTCT service quality should be high in absolute, not relative, terms. To quantify associations, we fit generalized linear models with a logit link function, binomial distribution, and robust standard errors, adjusting for country using indicator variables to account for differences in health systems and routine data reporting. To account for differences in size, facilities were weighted using the reciprocal of the expected variance of the product of two proportions, [n1n2/(n1 + n2)], where n1 = number of ANC1 visits and n2 = number of HIV-positive women in a given facility (the denominators of the two proportions multiplied to calculate performance score). These models yielded odds ratios that could be interpreted as the change in the likelihood that an HIV-positive woman would receive both an HIV test in ANC1 and appropriate ARVs. In sensitivity analyses, the two measures that were multiplied to calculate performance score were disaggregated into separate outcomes.
Staffing variables were aggregated into all nurses, all physicians, all non-nurse, non-physician workers, and all health workers by facility (Table 1), reflecting country-specific health worker functions. Workload was calculated as the number of ANC1 visits per month divided by the number of health workers in each category. Models were assessed by parameterizing staffing variables into quintiles to detect deviations from a linear relationship and by adding squared terms to evaluate whether these terms would improve model fit.
Table 1.
Variable definitions to aggregate health workers within health facilities by country.
| All nurses | All physicians | Other health workersa | All health workers | |
|---|---|---|---|---|
| Côte d’Ivoire | Midwives + nurses + nurse’s aides |
Physicians | Social workers + community counselors |
Column 1 + Column 2 + Column 3 |
| Kenya | All nurses assigned to MCH, regardless of level | Physicians + registered clinical officers |
Community health workers | Column 1 + Column 2 + Column 3 |
| Mozambique | MCH superior nurses + MCH mid-level nurses + MCH basic-level nurses + midwives + general nurses + elementary nurses + basic nurses |
Physicians + physician assistants |
Social workers | Column 1 + Column 2 + Column 3 |
MCH: maternal and child health.
Other health facility workers were included only if they could meaningfully impact PMTCT service delivery, given their responsibilities within each country’s health system.
The ethics review boards of the Ministries of Health in Mozambique and Côte d’Ivoire, and of Kenyatta National Hospital in Nairobi, Kenya each approved the study. The study was reviewed by the Institutional Review Board at the University of Washington and deemed to be exempt from approval. All analyses were completed using Stata version 13.1 (College Station, TX).
The study sponsors had no role in the study design, the collection, analysis, or interpretation of the data, the writing of the report, or the decision to submit for publication.
Results
The 60 health facilities in the study saw 38,611 ANC1 visits, 38,366 deliveries, and 18,281 postpartum visits over the six months prior to data collection. Of women presenting for ANC at study facilities, 91% (interquartile range, 86%–99%) were tested for HIV in ANC1, and of those eligible, 54% (interquartile range, 25%–86%) were given dual or triple ARV regimens. The HIV prevalence among ANC attendees ranged from 2.8% (standard deviation (SD) = 1.3%) in Côte d’Ivoire to 5.2% (2.3%) in Kenya and 12.5% (6.1%) in Mozambique. Performance differed significantly across countries (p = 0.002): Kenya had the highest mean performance score of 0.665, while those in Côte d’Ivoire and Mozambique were 0.315 and 0.492, respectively. Facilities in Kenya also had most experience offering PMTCT (mean 7.7 years), compared to Côte d’Ivoire and Mozambique (3.6 and 5.1 years, respectively).
The proportion of HIV-positive pregnant women tested for HIV in ANC1 and given appropriate ARVs did not differ meaningfully across most characteristics of facility setting, services offered, and patient volume (Table 2). Performance scores tended to be higher in facilities with more experience offering PMTCT, and those with air conditioning. Total numbers of health workers were positively correlated with performance score. Workload of the total number of health workers – defined as the number of ANC1 visits per health worker – was inversely correlated with performance score. Most facilities offered extensive support services for patients; 82% of facilities offered support groups to HIV-positive women and actively traced women/children lost to follow-up. Performance scores did not differ substantially between sites that did or did not offer such services.
Table 2.
Characteristics of health facility setting, services, staffing, and staffing workloads, and mean performance scores of 60 health facilities offering PMTCT services in Côte d’Ivoire, Kenya, and Mozambique.
| Characteristic | n (%)a | mean (SD) |
|---|---|---|
| Setting | ||
| Country | ||
| Côte d’Ivoire | 20 (33) | 0.32 (0.28) |
| Kenya | 20 (33) | 0.67 (0.29) |
| Mozambique | 20 (33) | 0.49 (0.30) |
| Location | ||
| Rural | 18 (30) | 0.47 (0.36) |
| Urban | 36 (60) | 0.49 (0.31) |
| Peri-urban | 6 (10) | 0.55 (0.33) |
| Number of NGOs supporting facility | ||
| 0 | 13 (22) | 0.42 (0.30) |
| 1 | 16 (27) | 0.52 (0.28) |
| ≥2 | 31 (52) | 0.51 (0.35) |
| Year of PMTCT initiation | ||
| Before 2005 | 11 (19) | 0.63 (0.34) |
| 2005–2008 | 35 (59) | 0.51 (0.28) |
| After 2008 | 13 (22) | 0.28 (0.31) |
| Missing | 1 | 0.96 (n/a) |
| Distance to reference lab | ||
| <5 km | 20 (35) | 0.55 (0.28) |
| 5−<15 km | 10 (18) | 0.45 (0.26) |
| 15−<25 km | 8 (14) | 0.54 (0.37) |
| 25+ km | 19 (33) | 0.40 (0.36) |
| Missing | 3 | 0.74 (0.32) |
| Air conditioning | ||
| No | 38 (63) | 0.42 (0.31) |
| Yes | 22 (37) | 0.62 (0.29) |
| Pima CD4 machine on site | ||
| No | 40 (70) | 0.51 (0.29) |
| Yes | 17 (30) | 0.40 (0.38) |
| Missing | 3 | 0.80 (0.20) |
| Services | ||
| Linkages with the communityb | ||
| No | 12 (21) | 0.51 (0.25) |
| Yes | 47 (82) | 0.48 (0.33) |
| Missing | 3 | 0.97 (0) |
| Active tracing of women/children lost to follow-up | ||
| No | 11 (18) | 0.50 (0.31) |
| Yes | 49 (82) | 0.49 (0.32) |
| Support group for HIV-positive mothers | ||
| No | 18 (30) | 0.42 (0.29) |
| Yes | 42 (70) | 0.52 (0.33) |
| CD4 testing on site | ||
| No | 42 (71) | 0.41 (0.32) |
| Yes | 17 (29) | 0.66 (0.22) |
| Missing | 1 | 0.97 (n/a) |
| Stockouts of determine in ANC | ||
| No | 51 (88) | 0.48 (0.33) |
| Yes | 7 (12) | 0.47 (0.23) |
| Missing | 2 | 0.75 (0.27) |
| Stockouts of AZT in ANC | ||
| No | 53 (88) | 0.51 (0.32) |
| Yes | 7 (12) | 0.35 (0.33) |
| Lag in receipt of CD4 blood draw results | ||
| <1 day | 13 (25) | 0.59 (0.29) |
| 1−<30 days | 7 (13) | 0.73 (0.23) |
| 30−<45 days | 17 (33) | 0.41 (0.33) |
| 45+ days | 15 (29) | 0.39 (0.32) |
| Missing | 8 | 0.49 (0.33) |
| Staffing levels | ||
| Nurses | ||
| 0–1 | 10 (18) | 0.71 (0.28) |
| 2 | 9 (16) | 0.32 (0.36) |
| 3–5 | 12 (21) | 0.18 (0.21) |
| 6–9 | 12 (21) | 0.55 (0.23) |
| ≥10 | 14 (25) | 0.60 (0.24) |
| Missing | 3 | 0.81 (0.20) |
| Physicians | ||
| 0 | 8 (13) | 0.18 (0.26) |
| 1–2 | 28 (47) | 0.43 (0.29) |
| 3–9 | 12 (20) | 0.73 (0.20) |
| ≥10 | 12 (20) | 0.61 (0.32) |
| Other health workers | ||
| 0 | 16 (27) | 0.40 (0.28) |
| 1–2 | 20 (33) | 0.37 (0.32) |
| 3–7 | 10 (17) | 0.67 (0.25) |
| ≥8 | 14 (23) | 0.65 (0.31) |
| All health workers | ||
| 1–2 | 10 (18) | 0.38 (0.33) |
| 3–6 | 10 (18) | 0.15 (0.17) |
| 7–13 | 14 (25) | 0.58 (0.30) |
| 14–25 | 11 (19) | 0.50 (0.28) |
| ≥26 | 12 (21) | 0.67 (0.25) |
| Missing | 3 | 0.81 (0.20) |
| Staffing workloads | ||
| ANC1 visits per nurse | ||
| <8.2 | 11 (20) | 0.43 (0.39) |
| 8.2−<13 | 11 (20) | 0.56 (0.27) |
| 13−<20.8 | 11 (20) | 0.48 (0.31) |
| 20.8−<31.8 | 11 (20) | 0.32 (0.26) |
| ≥31.8 | 12 (21) | 0.58 (0.32) |
| Missing/undefinedc | 4 | 0.68 (0.31) |
| ANC1 visits per physician | ||
| <8.3 | 10 (19) | 0.72 (0.27) |
| 8.3−<23.5 | 11 (21) | 0.63 (0.32) |
| 23.5−<48.7 | 10 (19) | 0.45 (0.35) |
| 48.7−<86.4 | 11 (21) | 0.38 (0.27) |
| ≥86.4 | 11 (21) | 0.47 (0.29) |
| Missing/undefinedd | 7 | 0.20 (0.27) |
| ANC1 visits per other health workers | ||
| <9.8 | 8 (18) | 0.86 (0.15) |
| 9.8−<18.7 | 9 (20) | 0.52 (0.28) |
| 18.7−<32.7 | 9 (20) | 0.36 (0.41) |
| 32.7−<66.7 | 9 (20) | 0.40 (0.26) |
| ≥66.7 | 9 (20) | 0.53 (0.30) |
| Missing/undefinede | 16 | 0.40 (0.28) |
| ANC1 visits per all health workers | ||
| <4.0 | 11 (19) | 0.67 (0.32) |
| 4.0–<5.4 | 11 (19) | 0.53 (0.31) |
| 5.4–<9.6 | 12 (21) | 0.42 (0.35) |
| 9.6–<19.0 | 11 (19) | 0.42 (0.29) |
| ≥19.0 | 12 (21) | 0.34 (0.26) |
| Missing/undefinedf | 3 | 0.81 (0.20) |
ANC: antenatal care; ANC1: first antenatal care visit; NGO: non-governmental organization; PMTCT: prevention of mother-to-child transmission of HIV; SD: standard deviation; AZT: zidovudine.
Variables for staffing levels and staffing workloads were modeled using quintiles (excepting variables for which the distribution of the data did not yield five equal groups). Performance score was defined as the product of two proportions: the proportion of pregnant women tested for HIV in first antenatal care visit, and the proportion of HIV-positive pregnant women who received dual or triple antiretroviral medications.
Percentage excludes unknowns, if any.
Outreach service provision, campaigns, education session, or community meetings.
Missing for three facilities with missing values for total number of nurses, and undefined for one facility with no nurses.
Undefined for seven facilities with no physicians.
Undefined for 16 facilities with no other health workers.
Missing for three facilities with missing values for total number of nurses.
In binomial regression models, facility experience was not associated with performance after adjusting for country (Table 3), though presence of air conditioning and a Pima CD4 machine were positively correlated with likelihood that HIV-positive pregnant women would receive testing and appropriate ARVs. With the exception of offering on-site CD4 count testing, patient services were not associated with improved testing and ARV coverage. Each additional nurse at a facility was associated with a 5% (0.2%–10%) increase in the likelihood that an HIV-positive woman would be tested for HIV and receive appropriate ARVs (Table 3); each additional health worker of any cadre was associated with a 4% (1%–7%) increase in that likelihood. As nurse workloads increased, testing and ARV coverage likelihood decreased; each additional single ANC1 visit per month per nurse and per health worker overall were associated with a 4% (1%–6%) and 8% (4%–12%) decline, respectively, in the likelihood that a given HIV-positive woman would be tested for HIV and receive appropriate ARVs. Physician workload was associated with this outcome to a statistically significant, but much less substantial degree; each additional ANC1 visit per month per physician was associated with a 0.2% (0.1%–0.4%) decline in testing and ARV coverage likelihood. No significant deviations from a linear relationship were found for staffing numbers when they were parameterized into quintiles, (p > 0.57 for all likelihood ratio tests comparing grouped linear categories vs. indicator variables). Similarly, the addition of a squared exposure term to each regression model did not improve model fit (p > 0.23 for all squared terms).
Table 3.
Clinic characteristics and likelihood of HIV-positive pregnant women being tested for HIV in first antenatal care visit and receiving appropriate antiretrovirals, in 60 facilities offering PMTCT in Côte d’Ivoire, Kenya, and Mozambique.
| Characteristic | OR (95% CI) | pa | aOR (95% CI)b | pa |
|---|---|---|---|---|
| Setting | ||||
| Location | ||||
| Rural | 1.00 (ref) | 1.00 (ref) | ||
| Urban | 0.87 (0.47–1.60) | 1.25 (0.76–2.06) | ||
| Peri-urban | 1.58 (0.45–5.57) | 0.62 | 1.53 (0.44–5.36) | 0.62 |
| Number of NGOs supporting facility | ||||
| 0 | 1.00 (ref) | 1.00 (ref) | ||
| 1 | 0.79 (0.30–2.11) | 1.29 (0.56–3.00) | ||
| ≥2 | 1.72 (0.66–4.48) | 0.62 | 2.08 (0.80–5.42) | 0.21 |
| Year of PMTCT initiation | ||||
| Before 2005 | 1.00 (ref) | 1.00 (ref) | ||
| 2005–2008 | 0.40 (0.15–1.05) | 0.43 (0.18–1.03) | ||
| After 2008 | 0.15 (0.05–0.48) | 0.005 | 0.31 (0.09–1.02) | 0.11 |
| Distance to reference lab | ||||
| <5 km | 1.00 (ref) | 1.00 (ref) | ||
| 5−<15 km | 2.46 (0.71–8.54) | 2.01 (0.61–6.62) | ||
| 15−<25 km | 1.86 (0.94–3.65) | 1.40 (0.61–3.17) | ||
| 25+ km | 1.39 (0.56–3.43) | 0.26 | 1.29 (0.57–2.93) | 0.70 |
| Air conditioning | 2.42 (1.09–5.38) | 0.03 | 2.28 (1.13–4.59) | 0.02 |
| Pima CD4 machine on site | 1.92 (0.75–4.90) | 0.18 | 2.32 (1.08–4.98) | 0.03 |
| Services | ||||
| Linkages with the communityc | 1.18 (0.50–2.82) | 0.71 | 1.06 (0.50–2.27) | 0.88 |
| Active tracing of women/children lost to follow-up | 1.24 (0.52–2.99) | 0.63 | 1.36 (0.61–3.00) | 0.45 |
| Support group for HIV-positive mothers | 1.12 (0.52–2.43) | 0.77 | 1.51 (0.65–3.53) | 0.34 |
| CD4 testing on site | 2.37 (1.06–5.28) | 0.04 | 2.11 (1.02–4.38) | 0.045 |
| Stockouts of determine in ANC | 0.62 (0.35–1.10) | 0.54 | 1.26 (0.60–2.63) | 0.88 |
| Stockouts of AZT in ANC | 1.09 (0.53–2.23) | 0.82 | 1.04 (0.60–1.81) | 0.88 |
| Lag in receipt of CD4 blood draw results | ||||
| <1 day | 1.00 (ref) | 1.00 (ref) | ||
| 1−<30 days | 2.23 (0.70–7.14) | 2.05 (0.63–6.66) | ||
| 30−<45 days | 0.96 (0.37–2.47) | 1.04 (0.35–3.09) | ||
| 45+ days | 0.41 (0.14–1.19) | 0.02 | 0.91 (0.26–3.14) | 0.79 |
| Staffing levels | ||||
| Nurses | 1.06 (1.01–1.11) | 0.01 | 1.05 (1.00–1.10) | 0.04 |
| Physicians | 1.01 (0.99–1.03) | 0.51 | 1.01 (0.99–1.04) | 0.37 |
| Other health workers | 1.02 (0.97–1.06) | 0.47 | 1.05 (0.95–1.16) | 0.32 |
| All health workers | 1.04 (1.02–1.07) | 0.002 | 1.04 (1.01–1.07) | 0.004 |
| Staffing workloads | ||||
| ANC1 visits per nurse | 0.96 (0.93–0.99) | 0.009 | 0.96 (0.94–0.99) | 0.003 |
| ANC1 visits per physician | 0.998 (0.996–1.001) | 0.21 | 0.998 (0.996–0.999) | 0.009 |
| ANC1 visits per other health worker | 1.01 (0.998–1.02) | 0.12 | 0.999 (0.994–1.004) | 0.74 |
| ANC1 visits per total number of health workers | 0.93 (0.89–0.97) | 0.002 | 0.92 (0.88–0.96) | <0.001 |
ANC: antenatal care; ANC1: first antenatal care visit; AZT: zidovudine; NGO: non-governmental organization; PMTCT: prevention of mother-to-child transmission of HIV; aOR: adjusted odds ratio; CI: confidence interval.
Variables under patient volume were modeled using quintiles.
For variables with >2 categories, p values are from a Wald test of the significance of the beta-coefficients of all categories jointly, with each category included in the regression model as an indicator variable.
Adjusted for country using indicator variables (Côte d’Ivoire/Kenya/Mozambique).
Outreach service provision, campaigns, education sessions, or community meetings.
Patient volume, as measured by the catchment area population served by each health facility, ANC1 visits and postpartum visits in the prior six months, was associated with testing and ARV coverage in a U-shaped manner; mid-level patient volume was associated with lower likelihoods of HIV-positive pregnant women receiving both testing and ARV medications than either low or high patient volumes (Figure 1).
Figure 1.
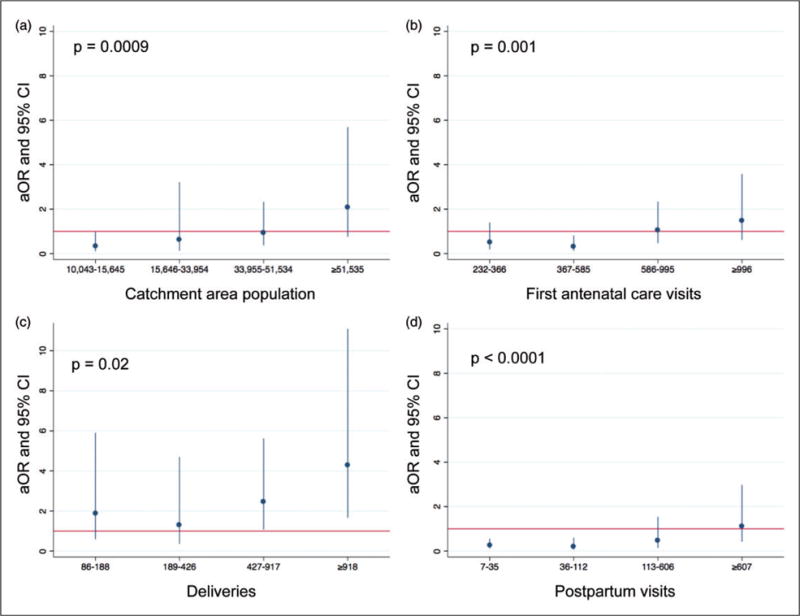
Patient volume of health facilities and their associations with the likelihood of HIV-positive pregnant women being tested for HIV in first antenatal care visit and receiving appropriate antiretroviral medications, in 60 health facilities offering PMTCT services in Côte d’Ivoire, Kenya, and Mozambique. (a) Catchment area population, by quintile; (b) first antenatal care visits, by quintile; (c) deliveries, by quintile; and (d) postpartum visits, by quintile. The referent category is lowest quintile for all panels, as indicated by the red line at y = 1. p values are from Wald tests of the significance of the beta-coefficients of all categories jointly, with each category included in the regression model as an indicator variable. ANC: antenatal care; aOR: adjusted odds ratio; CI: confidence interval; PMTCT: prevention of mother-to-child transmission.
Sensitivity analyses indicated that staffing variables were more significantly associated with an HIV-positive pregnant woman’s likelihood of receiving appropriate ARVs, than her likelihood of receiving an HIV test in ANC1 (Table 4).
Table 4.
Associations between clinic characteristics and percentage of women tested for HIV in first antenatal care visit and percentage of HIV-positive pregnant women who received appropriate antiretroviral medications of 60 health facilities offering PMTCT services in Côte d’Ivoire, Kenya, and Mozambique.
| Characteristic | Testing coverage in ANC1
|
ARV coverage
|
||
|---|---|---|---|---|
| aOR (95% CI)a | pb | aOR (95% CI)a | pb | |
| Setting | ||||
| Location | ||||
| Rural | 1.00 (ref) | 1.00 (ref) | ||
| Urban | 2.20 (0.86–5.63) | 1.09 (0.59–2.03) | ||
| Peri-urban | 1.46 (0.74–2.88) | 0.15 | 1.42 (0.36–5.61) | 0.87 |
| Number of NGOs supporting facility | ||||
| 0 | 1.00 (ref) | 1.00 (ref) | ||
| 1 | 2.94 (0.94–9.17) | 1.15 (0.45–2.90) | ||
| ≥2 | 1.76 (0.91–3.41) | 0.11 | 2.06 (0.73–5.84) | 0.19 |
| Year of PMTCT initiation | ||||
| Before 2005 | 1.00 (ref) | 1.00 (ref) | ||
| 2005–2008 | 0.49 (0.29–0.84) | 0.47 (0.16–1.39) | ||
| After 2008 | 1.05 (0.54–2.04) | 0.006 | 0.31 (0.08–1.20) | 0.23 |
| Distance to reference lab (per 100 km) | 12.73 (0.42–381.4) | 0.14 | 0.31 (0.02–3.94) | 0.36 |
| Air conditioning | 1.74 (1.04–2.92) | 0.04 | 2.19 (0.995–4.80) | 0.05 |
| Pima CD4 machine on site | 1.41 (0.77–2.57) | 0.27 | 2.24 (0.94–5.36) | 0.07 |
| Services | ||||
| Linkages with the communityc | 1.28 (0.81–2.02) | 0.28 | 0.98 (0.42–2.31) | 0.97 |
| Active tracing of women/children lost to follow-up | 1.32 (0.85–2.05) | 0.21 | 1.27 (0.52–3.10) | 0.61 |
| Support group for HIV-positive mothers | 0.89 (0.38–2.11) | 0.80 | 1.60 (0.63–4.07) | 0.33 |
| CD4 testing on site | 1.16 (0.61–2.18) | 0.65 | 2.22 (0.98–5.01) | 0.06 |
| Stockouts of determine in ANC | 1.31 (0.86–1.97) | 0.20 | 1.28 (0.59–2.76) | 0.53 |
| Stockouts of AZT in ANC | 0.61 (0.35–1.07) | 0.08 | 1.23 (0.66–2.30) | 0.51 |
| Lag in receipt of CD4 blood draw results | ||||
| <1 day | 1.00 (ref) | 1.00 (ref) | ||
| 1−<30 days | 2.03 (0.84–4.89) | 2.14 (0.59–7.72) | ||
| 30−<45 days | 1.21 (0.52–2.82) | 1.09 (0.34–3.52) | ||
| 45+ days | 0.96 (0.32–2.87) | 0.42 | 1.05 (0.28–3.89) | 0.58 |
| Volume | ||||
| Catchment area population | ||||
| ≤10,042 | 1.00 (ref) | 1.00 (ref) | ||
| 10,043–15,645 | 0.74 (0.21–2.58) | 0.29 (0.08–0.99) | ||
| 15,646–33,954 | 1.03 (0.49–2.14) | 0.54 (0.09–3.03) | ||
| 33,955–51,534 | 1.15 (0.61–2.18) | 0.81 (0.26–2.53) | ||
| ≥51,535 | 1.15 (0.71–1.84) | 0.95 | 1.93 (0.59–6.32) | 0.01 |
| First ANC visits in prior six months | ||||
| ≤231 | 1.00 (ref) | 1.00 (ref) | ||
| 232–366 | 0.63 (0.24–1.66) | 0.50 (0.17–1.41) | ||
| 367–585 | 0.31 (0.13–0.75) | 0.37 (0.14–0.997) | ||
| 586–995 | 0.42 (0.19–0.93) | 1.19 (0.50–2.82) | ||
| ≥996 | 0.70 (0.29–1.68) | 0.02 | 1.60 (0.61–4.17) | 0.005 |
| Deliveries in prior six months | ||||
| ≤85 | 1.00 (ref) | 1.00 (ref) | ||
| 86–188 | 0.69 (0.20–2.38) | 2.15 (0.69–6.34) | ||
| 189–426 | 1.00 (0.36–2.80) | 1.30 (0.36–4.62) | ||
| 427–917 | 1.13 (0.40–3.19) | 2.54 (1.06–6.10) | ||
| ≥918 | 1.14 (0.47–2.79) | 0.92 | 4.87 (1.82–13.03) | 0.02 |
| Postpartum visits in prior six months | ||||
| ≤6 | 1.00 (ref) | 1.00 (ref) | ||
| 7–35 | 0.54 (0.20–1.48) | 0.24 (0.10–0.55) | ||
| 36–112 | 0.75 (0.22–2.53) | 0.18 (0.06–0.56) | ||
| 113–606 | 0.40 (0.17–0.94) | 0.46 (0.12–1.77) | ||
| ≥607 | 0.75 (0.36–1.56) | 0.26 | 1.11 (0.35–3.46) | <0.001 |
| Staffing levels | ||||
| Nurses | 1.005 (0.97–1.04) | 0.79 | 1.06 (1.01–1.11) | 0.02 |
| Physicians | 1.003 (0.998–1.007) | 0.22 | 1.01 (0.98–1.04) | 0.41 |
| Other health workers | 1.02 (0.99–1.04) | 0.17 | 1.07 (0.93–1.21) | 0.35 |
| All healthcare workers | 1.005 (0.98–1.03) | 0.68 | 1.04 (1.02–1.07) | 0.002 |
| Staffing workloads | ||||
| ANC1 visits per nurse | 1.009 (0.986–1.03) | 0.44 | 0.96 (0.93–0.98) | 0.001 |
| ANC1 visits per physician | 1.003 (0.997–1.01) | 0.28 | 0.997 (0.995–0.999) | 0.01 |
| ANC1 visits per other health worker | 0.995 (0.986–1.004) | 0.28 | 1.001 (0.994–1.007) | 0.82 |
| ANC1 visits per total number of health workers | 1.000 (0.96–1.04) | 0.99 | 0.91 (0.87–0.96) | <0.001 |
ANC: antenatal care; ANC1: first antenatal care visit; ARV: antiretroviral medication; AZT: zidovudine; NGO: non-governmental organization; PMTCT: prevention of mother-to-child transmission of HIV; aOR: adjusted odds ratio; CI: confidence interval.
Adjusted for country using dummy variables (Côte d’Ivoire/Kenya/Mozambique).
For variables with >2 categories, p values are from a Wald test of the significance of the beta-coefficients of all categories jointly, with each category included in the regression model as an indicator variable.
Outreach service provision, campaigns, education sessions, or community meetings.
Discussion
To our knowledge, this is the first study to quantify associations between health facility factors and performance in delivering currently recommended PMTCT regimens using routinely collected outcome data. In three countries in sub-Saharan Africa, ANC1 visits per nurse, per physician, and per health worker overall were inversely correlated with the likelihood that HIV-positive pregnant women would receive HIV testing in ANC1 and dual or triple ARV regimens. Low or high patient volume and infrastructure (on-site air conditioning and Pima CD4 machine) were also associated with higher likelihood of receiving HIV testing and ARVs.
Performance scores differed significantly by country. The association between years of experience in providing PMTCT and performance was attenuated after adjusting for country; country-to-country performance variation may have been due to underlying differences in experience. Over time, therefore, PMTCT service quality may tend to improve. Most facilities offered extensive services to support patients. The widespread availability of such services is encouraging, though it attenuated this study’s ability to detect any associations with performance; further, such services may decrease loss to follow-up,19 which this study’s performance definition would not capture. The U-shaped association between performance and patient volume in this study was also observed with single-dose nevirapine coverage.12
Staffing variables were significantly associated with performance. Nurse workload was inversely associated with performance; each additional ANC1 visit per month per nurse was associated with a 4% (1%–6%) decline in the likelihood that a given HIV-positive woman would be tested for HIV and receive appropriate ARVs. This may have driven the overall association between performance and the workload per health worker, overall (adjusted odds ratio (aOR) = 0.92, 0.88–0.96). Physician workload was significantly associated with likelihood of testing and ARV coverage, but much less substantially than among nurses (for an increase of 100 monthly ANC1 visits per physician, aOR = 0.81, 0.70–0.95, whereas for nurses, the same aOR was 0.02, 0.001–0.28). Nurses rather than physicians are primarily involved in routine care of pregnant and postpartum women, particularly since the advent of task shifting.20
This study has several strengths. The study countries are diverse in terms of geographic location (western, southern, and eastern sub-Saharan Africa), HIV prevalence, and underlying health systems, which increases the generalizability of the results. Routinely collected data were used to rank facilities’ performance, using methods that may be inexpensively and rapidly applied to any facility offering PMTCT. These methods provide urgently needed data to maximize quality of ART delivery while minimizing cost, which are necessary to use stagnant ART funding most efficiently.9 Performance definitions were concordant with currently accepted PMTCT regimens. Facility characteristics were ascertained in person by trained study staff using a standardized data collection instrument. Finally, workloads were used in addition to absolute number of health workers, which may more accurately capture the ability of health workers to deliver care.
The study was not without limitations. First, the cross-sectional nature of data collection precludes any causal inferences, though staffing levels have long been recognized as key determinants of ARV delivery.5–7,21 Second, characteristics of the patient population served by each facility were unavailable, aside from catchment area size and HIV prevalence. Population-level patient characteristics – such as PMTCT knowledge and HIV testing prevalence – may impact single-dose nevirapine coverage,12 and therefore may affect this study’s outcome, which included ARV coverage. Furthermore, the complexity of a facility’s patient caseload may impact the workload of providers. However, it is unlikely that observed associations between staffing levels and performance were entirely due to confounding by patient characteristics, as such confounding could also create associations between other facility characteristics (e.g., urban setting), depending on the patient characteristic. Third, the performance definition may not capture differences in retention; however, many of the reasons women are lost to follow-up during the PMTCT cascade may not be modifiable by health facilities (e.g., traveling to deliver near family).22 Facility-level determinants of retention merit a separate study from the present one, which aimed to identify health facility factors associated with high-quality service delivery to women who do present for care. Data were unavailable on staff attendance, which may have led to misclassification and undermined our ability to detect associations between staff workloads and PMTCT service quality. Routine data were not collected for research purposes, though the quality of routine data is high in Mozambique.23 In Kenya, data were extracted directly from facility registries, which are more accurate in estimating PMTCT coverage than monthly reports.24 Finally, because this study’s goal was to generate hypotheses rather than test one specific hypothesis, future research should confirm its findings.
This study’s results support the inference that human resources are critical for the delivery of effective PMTCT services in sub-Saharan Africa. The workload of nurses was more strongly correlated with the completion of steps along the PMTCT cascade than that of physicians or other health workers, perhaps because physicians play less of a direct role in patient care in resource-limited settings. Even in high-income settings, a large body of evidence points to staffing levels of nurses, rather than physicians, as critical to maximizing health outcomes.25,26 Future research is warranted into how best to distribute scarce health workers to optimize PMTCT service delivery. Other modifiable aspects of human resources – such as absences, payment interruptions, and policies regarding private sector work – may also impact performance and deserve further investigation.
Shortages of health professionals are arguably the “greatest health system constraint in achieving health goals,”27 and health worker expansion is one of WHO’s core building blocks for health system strengthening.4 High patient volume may also directly reduce quality by shortening visit duration, a problem that could be compounded as ANC is increasingly utilized as a vehicle to deliver a broad array of health services.28 Though task shifting has been proposed to address the deficit of highly skilled health professionals in sub-Saharan Africa,20,29,30 task shifting alone may be insufficient if the numbers of health workers who absorb new tasks are stagnant.
Increasing the number of health workers is recognized as a key component of health system strengthening.4 Based on the results of this and other studies, investments in human resources – perhaps in particular, nurses – may be key to maximizing the effectiveness PMTCT services.
Acknowledgments
We gratefully acknowledge the dedication, insight, and hard work of all members of the SAIA Study Team. Members include Ahoua Koné, Julia Robinson, S Adam Granato, Seydou Kouyaté, Grace Mbatia, Grace Wariua, Martin Maina, Peter Mwaura Njuguna, Joana Coutinho, Emelita Cruz, Quincy Moore, Justina Zucule, Cathy Michel, Bradley Wagenaar, and James Pfeiffer. In addition, we appreciate the statistical expertise of Jim Hughes. The underlying dataset can be accessed at https://dx.doi.org/10.6084/m9.fig-share.2062524.v1.
Funding
This work was supported by the President’s Emergency Plan for AIDS Relief and the National Institutes of Health [grant number R01HD075057: awarded to KS], the National Institutes of Health [grant number P30AI027757: awarded to the University of Washington Center for AIDS Research, and grant number K02TW009207: awarded to KS]; the Doris Duke Charitable Foundation’s African Health Initiative [awarded to KS]. The content is solely the responsibility of the authors and does not necessarily represent the official views of any of the funding agencies. The funders had no role in the study design, data collection and analysis, decision to publish, or preparation of the manuscript.
Footnotes
This work was presented at the American Public Health Association’s 142nd Annual Meeting, November 19, 2014.
Author contributions
ASR had full access to all study data, conducted all statistical analyses, wrote the initial draft of the manuscript, and made the final decision to submit the paper for publication. SG, RN, and MFC oversaw data collection and provided technical expertise. CF, JNW, and SG provided technical expertise. KS conceived of the project, oversaw implementation, and provided statistical expertise. All authors provided comments on the manuscript and read the final version.
Declaration of Conflicting Interests
The author(s) declared no potential conflicts of interest with respect to the research, authorship, and/or publication of this article.
References
- 1.Forbes JC, Alimenti AM, Singer J, et al. A national review of vertical HIV transmission. AIDS. 2012;26:757–763. doi: 10.1097/QAD.0b013e328350995c. [DOI] [PubMed] [Google Scholar]
- 2.Car LT, Brusamento S, Elmoniry H, et al. The uptake of integrated perinatal prevention of mother-to-child HIV transmission programs in low- and middle-income countries: a systematic review. PLoS ONE. 2013;8:e56550. doi: 10.1371/journal.pone.0056550. [DOI] [PMC free article] [PubMed] [Google Scholar]
- 3.UNAIDS. Global report: UNAIDS report on the global AIDS epidemic 2013. 2013 Nov; Available at: http://www.unaids.org/sites/default/files/media_asset/UNAIDS_Global_Report_2013_en_1.pdf (accessed August 2016)
- 4.WHO. Everybody’s business: strengthening health systems to improve health outcomes: WHO’S framework for action. Geneva: WHO; 2007. [Google Scholar]
- 5.Moorison JS, Moore A. Health worker shortages challenge PEPFAR options for strengthening health systems: A report of the Task Force on HIV/AIDS. Washington, DC: Center for Strategic and International Studies; Sep, 2007. Available at: https://csis-prod.s3.amazonaws.com/s3fs-public/legacy_files/files/media/csis/pubs/071016_healthworker.pdf (accessed 30 August 2016) [Google Scholar]
- 6.Van Damme W, Kober K, Laga M. The real challenges for scaling up ART in sub-Saharan Africa. AIDS. 2006;20:653–656. doi: 10.1097/01.aids.0000216364.44409.b1. [DOI] [PubMed] [Google Scholar]
- 7.Gourlay A, Birdthistle I, Mburu G, et al. Barriers and facilitating factors to the uptake of antiretroviral drugs for prevention of mother-to-child transmission of HIV in sub-Saharan Africa: a systematic review. J Int AIDS Soc. 2013;16:18588. doi: 10.7448/IAS.16.1.18588. [DOI] [PMC free article] [PubMed] [Google Scholar]
- 8.Suthar AB, Hoos D, Beqiri A, et al. Integrating antiretroviral therapy into antenatal care and maternal and child health settings: a systematic review and meta-analysis. Bull World Health Org. 2013;91:46–56. doi: 10.2471/BLT.12.107003. [DOI] [PMC free article] [PubMed] [Google Scholar]
- 9.Murray CJ. Maximizing antiretroviral therapy in developing countries: the dual challenge of efficiency and quality. JAMA. 2014;313:359–360. doi: 10.1001/jama.2014.16376. [DOI] [PubMed] [Google Scholar]
- 10.Colvin CJ, Konopka S, Chalker JC, et al. A systematic review of health system barriers and enablers for anti-retroviral therapy (ART) for HIV-infected pregnant and postpartum women. PLoS ONE. 2014;9:e108150. doi: 10.1371/journal.pone.0108150. [DOI] [PMC free article] [PubMed] [Google Scholar]
- 11.WHO. WHO consolidated guidelines on the use of anti-retroviral drugs for treating and preventing HIV infection: recommendations for a public health approach. Geneva: WHO; Nov, 2013. [PubMed] [Google Scholar]
- 12.Audureau E, Kahn JG, Besson MH, et al. Scaling up prevention of mother-to-child HIV transmission programs in sub-Saharan African countries: a multilevel assessment of site-, program- and country-level determinants of performance. BMC Pub Health. 2013;13:286. doi: 10.1186/1471-2458-13-286. [DOI] [PMC free article] [PubMed] [Google Scholar]
- 13.Kim YM, Banda J, Hiner C, et al. Assessing the quality of HIV/AIDS services at military health facilities in Zambia. Int J STD AIDS. 2013;24:365–370. doi: 10.1177/0956462412472811. [DOI] [PubMed] [Google Scholar]
- 14.Sprague C, Chersich MF, Black V. Health system weaknesses constrain access to PMTCT and maternal HIV services in South Africa: a qualitative enquiry. AIDS Res Therap. 2011;8:10. doi: 10.1186/1742-6405-8-10. [DOI] [PMC free article] [PubMed] [Google Scholar]
- 15.Gimbel S, Voss J, Rustagi A, et al. What does high and low have to do with it? Performance classification to identify health system factors associated with effective prevention of mother-to-child transmission of HIV delivery in Mozambique. J Int AIDS Soc. 2014;17:18828. doi: 10.7448/IAS.17.1.18828. [DOI] [PMC free article] [PubMed] [Google Scholar]
- 16.van Lettow M, Bedell R, Mayuni I, et al. Towards elimination of mother-to-child transmission of HIV: performance of different models of care for initiating lifelong antiretroviral therapy for pregnant women in Malawi (Option B+) J Int AIDS Soc. 2014;17:18994. doi: 10.7448/IAS.17.1.18994. [DOI] [PMC free article] [PubMed] [Google Scholar]
- 17.Ekouevi DK, Stringer E, Coetzee D, et al. Health facility characteristics and their relationship to coverage of PMTCT of HIV services across four African countries: the PEARL study. PLoS ONE. 2012;7:e29823. doi: 10.1371/journal.pone.0029823. [DOI] [PMC free article] [PubMed] [Google Scholar]
- 18.Sherr K, Gimbel S, Rustagi A, et al. Systems analysis and improvement to optimize pMTCT (SAIA): a cluster ran-domized trial. Implement Sci. 2014;9:55. doi: 10.1186/1748-5908-9-55. [DOI] [PMC free article] [PubMed] [Google Scholar]
- 19.Sibanda EL, Weller IV, Hakim JG, et al. The magnitude of loss to follow-up of HIV-exposed infants along the prevention of mother-to-child HIV transmission continuum of care: a systematic review and meta-analysis. AIDS. 2013;27:2787–2797. doi: 10.1097/QAD.0000000000000027. [DOI] [PMC free article] [PubMed] [Google Scholar]
- 20.Emdin CA, Chong NJ, Millson PE. Non-physician clinician provided HIV treatment results in equivalent outcomes as physician-provided care: a meta-analysis. J Int AIDS Soc. 2013;16:18445. doi: 10.7448/IAS.16.1.18445. [DOI] [PMC free article] [PubMed] [Google Scholar]
- 21.Samb B, Celletti F, Holloway J, et al. Rapid expansion of the health workforce in response to the HIV epidemic. N Engl J Med. 2007;357:2510–2514. doi: 10.1056/NEJMsb071889. [DOI] [PubMed] [Google Scholar]
- 22.Tweya H, Gugsa S, Hosseinipour M, et al. Understanding factors, outcomes and reasons for loss to follow-up among women in Option B+ PMTCT programme in Lilongwe, Malawi. Trop Med Int Health. 2014;19:1360–1366. doi: 10.1111/tmi.12369. [DOI] [PubMed] [Google Scholar]
- 23.Gimbel S, Micek M, Lambdin B, et al. An assessment of routine primary care health information system data quality in Sofala Province, Mozambique. Populat Health Metr. 2011;9:12. doi: 10.1186/1478-7954-9-12. [DOI] [PMC free article] [PubMed] [Google Scholar]
- 24.Ferguson L, Grant AD, Ong’ech JO, et al. Prevention of mother-to-child transmission of HIV: assessing the accuracy of routinely collected data on maternal antiretroviral prophylaxis coverage in Kenya. Sex Transm Infect. 2012;88:120–124. doi: 10.1136/sextrans-2011-050220. [DOI] [PubMed] [Google Scholar]
- 25.Bray BD, Ayis S, Campbell J, et al. Associations between stroke mortality and weekend working by stroke specialist physicians and registered nurses: prospective multicentre cohort study. PLoS Med. 2014;11:e1001705. doi: 10.1371/journal.pmed.1001705. [DOI] [PMC free article] [PubMed] [Google Scholar]
- 26.Kane RL, Shamliyan TA, Mueller C, et al. The association of registered nurse staffing levels and patient outcomes: systematic review and meta-analysis. Med Care. 2007;45:1195–1204. doi: 10.1097/MLR.0b013e3181468ca3. [DOI] [PubMed] [Google Scholar]
- 27.Interagency Task Team on the Prevention and Treatment of HIV Infection in Pregnant Women, Mothers, and Children. Human Resources for Health. UNICEF; Geneva: Dec, 2012. [Google Scholar]
- 28.The Partnership for Maternal, Child, and Newborn Health. Opportunities for Africa’s newborns: practical data, policy and programmatic support for newborn care in Africa. Report, World Health Organization on behalf of for The Partnership for Maternal Newborn and Child Health; Geneva: 2006. Available at: http://www.who.int/pmnch/media/publications/africanewborns/en (accessed 30 August 2016) [Google Scholar]
- 29.Zachariah R, Ford N, Philips M, et al. Task shifting in HIV/AIDS: opportunities, challenges and proposed actions for sub-Saharan Africa. Trans R Soc Trop Med Hygiene. 2009;103:549–558. doi: 10.1016/j.trstmh.2008.09.019. [DOI] [PubMed] [Google Scholar]
- 30.Decroo T, Rasschaert F, Telfer B, et al. Community-based antiretroviral therapy programs can overcome barriers to retention of patients and decongest health services in sub-Saharan Africa: a systematic review. Int Health. 2013;5:169–179. doi: 10.1093/inthealth/iht016. [DOI] [PubMed] [Google Scholar]