Abstract
A rotational Electrical Impedance Tomography (rEIT) methodology is described and shown to produce spatially accurate absolute reconstructions with improved image contrast and an improved ability to distinguish closely spaced inclusions compared to traditional EIT on data recorded from cylindrical and breast-shaped tanks. Rotations of the tank without altering the interior conductivity distribution are used to produce the rEIT data. Quantitatively, rEIT was able to distinguish two inclusions that were 1.5 cm closer together than traditional EIT could achieve for inclusions placed 2 to 3 cm from the center for the cylindrical tank, and rEIT was able to distinguish two tumor-like inclusions where traditional EIT could not reliably do so.Mathematical analysis showed that rEIT improves the number of stable singular vectors by up to 4.2 and 4.7 times than that of traditional EIT for the cylindrical and breast-shaped tanks, respectively, which is an indication of improved resolution. Direct investigations into measurements revealed minimum rotation angles that should yield data uncorrupted by noise. Two inverse approaches (one that inverts then fuses the data (I/DF) and one that fuses the data then inverts (DF/I)) and two mesh modeling approaches were considered. It was found that DF/I produces far better results compared to I/DF and a rotated-mesh approach produces further improvements. The ability to obtain improved absolute reconstructions using rEIT on a practical clinical scenario (breast-shaped tank experiment) is an important step towards using rEIT to improve previous EIT results in medical applications.
Index Terms: Data fusion, electrical impedance tomography, finite element method, inverse problem, singular value decomposition
I. Introduction
Electrical impedance tomography (EIT) is an imaging modality that aims to estimate the electrical property distribution within a domain of interest using currents and voltages measured on the domain’s boundary. It has been considered in a number of medical [1] and industrial applications [2]. Medical applications include ventilation and perfusion imaging [3], brain imaging [4], and cancer detection applied to breast [5], prostate [6], and cervical [7] tissues. It is attractive for medical applications due to its affordability, safe non-ionizing radiation-based nature [1], and potential for portability and miniaturization [8].
Several recent studies ([9]–[13]) in both industrial and medical applications have explored fusing together multiple sets of data with the objective of improving image quality. These approaches have been termed EIT with non-stationary electrodes [9], scanning EIT (SEIT) ([10], [11]), rotational EIT (rEIT) [12], and rotary planar electrical impedance mammography (RPEIM) [13]. SEIT has been applied to rotating electrodes in a tank [10] and to translating electrodes across a surface [11]. All of these techniques aim to fuse sets of traditional EIT data together in order to produce an improved image with higher resolution and accuracy. However, there are questions of how best to fuse the data and which modeling approaches should be used to maximize these improvements.
EIT is a severely ill-posed inverse problem [14], which partially explains the moderately low resolution of EIT, i.e. the low sensitivity ‘far’ from the electrodes limits the accuracy of the electrical property estimation. Another factor limiting the resolution is the relatively low number of measurements typically available in clinical EIT systems. This stems from the cost and complexity of designing high channel-count systems and the practical challenges of applying a large number of electrodes given a fixed surface area constrained by the anatomy being imaged; this latter challenge is especially important since larger electrodes are preferred because they increase the signal to noise ratio [15] and reduce contact impedances [16]. By combining multiple sets of measurements together these fusion EIT approaches have the potential to create a better-posed inverse problem and improve resolution without expensive/complex hardware upgrades.
There are two methods for solving the inverse problem in fusion EIT approaches. The first approach, used by ([9]–[12]), is to stack all measurements together in a single measurement vector over which the appropriate inversion is performed. Alternatively, the RPEIM approach [13] calculates the inverse reconstruction for each rotation and then fuses the data together through an averaging technique. We refer to the two methods as the data fusion then inversion (DF/I) and the inversion then data fusion (I/DF) techniques.
For each inversion approach, the mesh used to define the domain geometry and electrodes can either be 1) a single mesh that encodes all of the electrodes from all states (or rotations) within the boundary, or 2) a single standard mesh with electrodes defined for one particular state (i.e. 0° rotation) that is transformed (or rotated) to each of the states considered. We refer to these mesh types as the 1-mesh and rotated-mesh approaches, respectively.
In this study, we explored rEIT for breast cancer imaging. Absolute reconstructions, i.e. reconstructions that estimate the true conductivity distribution of the tissue without the need of a reference measurement, are essential for this application [17]. We developed a rEIT modeling approach that achieves improved absolute reconstructions compared to traditional EIT and quantitatively assessed the improvements and limitations offered by rEIT. These improvements and limitations are evaluated through 1) analysis of the mathematical formulation of the inverse problem, 2) analysis of image reconstructions produced from rotating tank experiments (each rotation denotes an additional dataset), and 3) analysis of raw voltage measurements acquired from bench-top experiments. Although rEIT has been studied previously ([10], [12]), this study 1) appears to be the first to produce absolute images with measured data, and 2) demonstrates more explicitly the qualitative and quantitative improvements offered by rEIT.
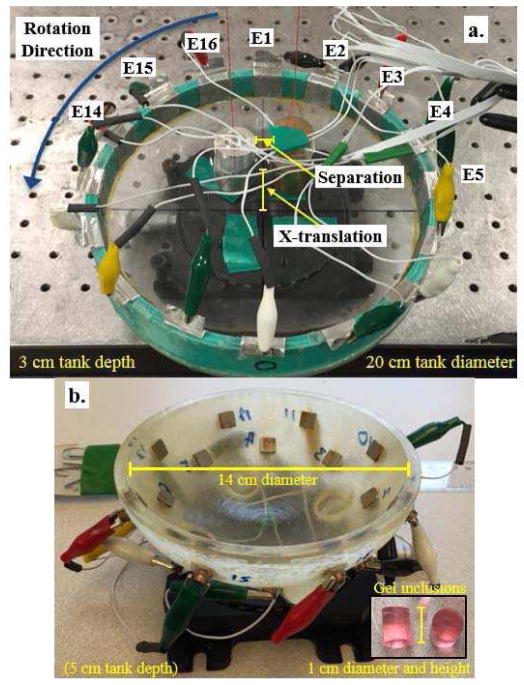
Bench-top imaging experiments were conducted to evaluate rEIT using a cylindrical and a breast-shaped tank (see Fig. 1a–b). In both experiments, two inclusions within the domain were kept stationary while the tanks were rotated. The full-set of traditional EIT measurements is recorded at each rotation, which is referred to as a dataset. rEIT uses a certain number of datasets, referred to as fused datasets, to produce a reconstruction. The mathematical analysis revealed an improvement of up to 4.2 and 4.7 times the number of stable singular vectors on the cylindrical and breast-shaped tank, respectively. This analysis enables one to quantify the improved resolution or added information provided by rEIT. Absolute imaging with rEIT was able to distinguish two inclusions that were 1.5 cm closer together than traditional EIT could achieve for inclusions placed 2 to 3 cm from the center of the cylindrical tank; likewise, rEIT was able to better distinguish two tumor-like inclusions within the breast tank, when compared to traditional EIT. Qualitative analysis of the reconstructions and quantitative analysis of the distinguishability and spatial metrics and inclusion contrasts revealed that the DF/I technique and rotated-mesh approach is the preferred method for rEIT. Lastly, analysis of voltage measurements was used to illustrate important limitations of rEIT, i.e. the minimum rotational step size, Δθ, that should yield added information was determined.
Fig. 1.
Two 16-electrode tanks used in this study, a. cylindrical tank and b. a breast-shaped tank (half-ellipsoid). The tanks are rotated counter clockwise while suspended inclusions remain fixed.
The remainder of the paper continues as follows. Section II includes a description of the forward problem, the meshing techniques, the inverse methods, the mathematical tools used to quantify the amount of information added by rEIT, and the description of the experiment, measurement system, and metrics used for analysis. Section III describes the results of the mathematical analysis, experiments, and direct investigation into measured voltage data. Section IV discusses the contributions of this study to literature, further discusses the clinical applications of rEIT, specifically those explored here, and includes a short discussion on modeling approaches.
II. Methods
This section describes the forward problem, two approaches for modeling tank rotations, two data fusion approaches used to perform the inversion, and three mathematical approaches used to investigate how much additional information can be gained through use of rEIT.
A. Forward Problem
The forward problem computes the electric potential within the domain and the electrode voltages on the boundary given a specified current injection distribution. The complete electrode model (CEM) [18] has been found to produce the most accurate simulated voltage measurements [19] and is defined by the following:
| (1) |
| (2) |
| (3) |
| (4) |
where σ is the conductivity, u is the electric potential, Ω denotes the domain, L is the number of electrodes, and Ul, Il, zl represent the voltage, current, and contact impedance on the lth electrode, El. Using the variational formulation of these equations [18] one can solve in 3D using the finite element method (FEM) [20]. We use a 3D Matlab implementation of the CEM and FEM using tetrahedral elements and linear basis functions for calculations [21]. A 3D mesh defining the domain of interest is constructed using gmsh [22]. Electrodes are defined within the mesh by specifying their boundaries using the nodes and edges. Therefore, each electrode is defined by a set of tetrahedral faces or 2D triangles.
The forward problem was modeled in two ways, referred to as the 1-mesh and rotated-mesh approaches. In the 1-mesh approach, a single FEM mesh was constructed that encoded the electrodes from all rotations. When calculating voltages corresponding to a single rotation, one needs to simply use the triangles that represent the electrodes for that rotation. In a sense the mesh is composed of overlapping electrodes. In contrast, the rotated-mesh approach is composed of a single mesh with the electrodes from a zero-degree rotation encoded in it, and one obtains meshes for different rotations by rotating the nodes of this mesh.
B. Inverse Problem
The inverse approach is based on the standard Gauss-Newton algorithm employing a generalized Tikhonov regularization scheme. After a linearization step ([23]) about an initial estimate of the conductivity, σ̃0, the error to be minimized is given by
| (5) |
where δσ is the conductivity update, J is the Jacobian, L is the regularization matrix, λ is the Tikhonov regularization factor, and ΔV is the vector difference between measured, VMeas, and simulated voltages, VSim(σ̃0). In this study L is taken to be a Laplace smoothing regularization matrix. The solution to (5) can be written as
| (6) |
If an appropriate regularization matrix and Tikhonov factor are chosen, then the augmented Jacobian, JT J + λLT L, is positive definite and therefore invertible [24]. Absolute imaging assumes (as stated in (6)) that VSim(σ̃0) is simulated, whereas difference imaging uses a measured reference set in place of VSim(σ̃0). Difference imaging can only be used when an appropriate reference set can be acquired. Equation (6) yields an update for the conductivity estimate throughout the domain, σ̃1 = δ σ̃+ σ̃0, and the whole process can be iterated to improve the quality and accuracy of the absolute reconstructions.
Our inverse implementation uses the dual-mesh method [25], which allows one to solve the Jacobian on a fine mesh while estimating the conductivity on a much coarser inverse mesh. This approach yields an electrical potential with high accuracy throughout the domain and enables one to reconstruct on any chosen inverse mesh. We note that this fine mesh is the same mesh used to simulate the voltages, VSim(σ̃0), in (6).
In rEIT, datasets recorded from multiple tank rotations are combined to produce an improved reconstruction. For each of the NR rotations one has a distinct Jacobian J (θ ), measured data vector VMeas (θ ), and simulated voltages VSim (σ0, θ ). There are two approaches that one may use when combining the data. The first approach is to compute the inverse problem for each rotation (i.e. solve (6)) and then fuse the reconstructions (I/DF), and the second approach is to fuse all the data and solve the inverse problem simultaneously for all rotations (DF/I).
1) Inversion then Data Fusion (I/DF)
In this method, an estimate of the conductivity, σ̃ (θ ), is calculated for each rotation and these individual reconstructions are averaged to yield a final reconstruction, σ̃I/DF. Each individual reconstruction is performed on the same inverse mesh. Thus the fusion is a direct average over each node, i.e.
| (7) |
The I/DF technique was used in [13]; however, in [13] coarser and separate distinct meshes were used for each individual rotation compared to the final fused mesh (similar to the rotated-mesh approach).
2) Data Fusion then Inversion (DF/I)
In this approach the data is first fused and then inversion is performed simultaneously using all of the data. The data is fused in the error function such that
| (8) |
Equation (8) is the average error between the model and measured data while including the same regularization scheme as traditional EIT, i.e. identical second term as in (5). The averaging maintains the same relative error and regularization norms regardless of the number of rotations due to the 1/NR factor. Thus a single Tikhonov factor can be used when comparing reconstructions across different numbers of fused datasets. One can rewrite (8) in the following equivalent form
| (9) |
where JFD and ΔVFD represent the concatenated fused-data (FD) Jacobian and voltage data, e.g. JFD is defined by
| (10) |
Using the same method to solve (5), the solution to (8) or (9) is given by
| (11) |
C. Mathematical tools for Analyzing the Inversion
We use singular value decomposition (SVD) to analyze the additional information obtained via fused datasets. In general, the matrix A, size m × n, can be decomposed into three matrices, i.e. A = USVT, where U is m × n, V is n × n with orthonormal columns, and S is a diagonal matrix with nonnegative elements (singular values) [26]. Analyzing the singular values gives the numerical rank of A and the expected number of singular vectors (columns of V) that can be used in inverting the matrix (page 56 of [27]). One can then use the Picard condition to estimate the number of stable singular vectors (see [9], [26]).
The matrix of interest in the context of rEIT is the Jacobian, JFD. The analysis of the singular values of JFD was considered in [12], and the analysis of the Picard condition in terms of the least square problem, ||JFDδσ − ΔVFD||2 was considered in [9]. A third method of analyzing the problem can be found by first rewriting (9) in an equivalent form,
| (12) |
referred to as a stacked form (page 68 of [27]), where we refer to the stacked matrix as . An analysis of the singular values (SV) of B indicate the number of singular vectors that are directly associated with the Jacobian in the final regularized inverse solution. By using an empirically best-fit Tikhonov factor this analysis also incorporates the decay of the singular values and the measurements.
D. Description of Experiments
This section describes the experiments designed to reveal the practical improvements offered by rEIT and details of the measurements, measurement system, and reconstruction parameters. The experiments were conducted on a 16-electrode cylindrical tank (diameter 20 cm, depth of 3 cm) and a breast-shaped tank (half-ellipsoid: x/y-diameter 14 cm, and z-semi-principle axis/depth 5 cm) with two rows of 8 electrodes, offset by 45° (Fig. 1). The cylindrical tank electrodes were 3 cm in height and 2.0 cm in width and the square breast tank electrodes were 1 cm × 1 cm. The cylindrical tank was filled with 0.1 S/m saline and cylindrical metal inclusions (25.4 mm diameter) were used. The breast tank was filled with 0.05 S/m (near adipose tissue) and gel inclusions (1 cm diameter and 1 cm height with a 0.22 S/m conductivity) were placed in the solution as tumor surrogates ([28]).
Based on the results from [12] we aimed to use as many rotations as possible. Our manual rotation stage allowed accurate rotations down to 1 degree. Based on the electrode spacing there was a maximum turn of 22° and 44° before a repeated geometry would occur for the cylindrical and breast-shaped tanks, respectively. For the 1-mesh approach, rotations that resulted in nearly intersecting electrode boundaries (intersections within 0.15 cm) needed to be excluded to prevent illshaped mesh elements. Considering these factors and assuming 1° rotations for the cylindrical tank and using a simple greedy algorithm to find least overlapping electrode boundaries for the breast-shaped tank the parameters for the experiments were selected (Table I).
TABLE I.
Rotations Used in Tank Experiments
| Tank | No. of Datasets | Minimum Rotation (°) | Rotations (°) |
|---|---|---|---|
| Cylinder | 1 | - | 0 |
| 2 | 7 | 0, 7 | |
| 4 | 3 | 0, 3, 6 | |
| 8 | 1 | 0, 1, 2, 3, 4, 5, 6, 7 | |
| Breast | 1 | - | 0 |
| 2 | 24 | 0, 24 | |
| 4 | 7 | 0, 7, 24, 31 | |
| 6 | 3 | 0, 3, 7, 24, 27, 31 | |
| 8 | 2 | 0, 3, 5, 7, 24, 27, 29, 31 |
1) Measurement system
Impedance data was recorded using a custom designed EIT system [29]. All data was sampled at 10 kHz. A total of 1,456 tetrapolar measurements for the cylindrical tank and 1,320 tetrapolar measurements for the breast tank were recorded from each rotation, i.e. for each dataset. Each tetrapolar measurement is specified as the differential voltage measured between two electrodes created due to a pair of current injecting electrodes. We define each measurement as an IIVV pattern where II represents the current injection electrode pair (I1, I2) and VV represents the differential voltage sensing pair of electrodes (V1, V2). The IIVV patterns are composed of 0-skip through 6-skip patterns for cylindrical tank and composed of combinations of 0-skip through 3-skip patterns from both rows of the breast-shaped tank. No bi-polar measurements were used. The n-skip patterns are all combinations of current and voltage electrodes that have n electrodes between current carrying and voltage measurement electrodes. For example, two IIVV patterns using 0- and 2-skips are [1 2 3 4] and [1 4 8 11], respectively. The average standard deviation across all voltage measurements and tests at a rotation of 0 degrees for the system, , was 0.21 mV for cylindrical tank and 0.10 mV for the breast-shaped tank. A saline calibration step was performed on all measurements [30].
2) Reconstructions
All reconstructions are absolute using (6) or (12). The number of fine mesh nodes and elements, the coarse inverse mesh grid and number of nodes, the number of inverse algorithm steps, and the Tikhonov factors for both experiments are listed in Table II. The L-curve approach was investigated [26], but in an attempt to find the point at which the two inclusions were most distinguishable it was empirically found that the optimal Tikhonov factor was slightly above the corner of the L-curve.
TABLE II.
Mesh and Reconstruction Parameters
| Tank | No. of Datasets | Minimum Rotation (°) | Rotations (°) |
|---|---|---|---|
| Cylinder | 1 | - | 0 |
| 2 | 7 | 0, 7 | |
| 4 | 3 | 0, 3, 6 | |
| 8 | 1 | 0, 1, 2, 3, 4, 5, 6, 7 | |
| Breast | 1 | - | 0 |
| 2 | 24 | 0, 24 | |
| 4 | 7 | 0, 7, 24, 31 | |
| 6 | 3 | 0, 3, 7, 24, 27, 31 | |
| 8 | 2 | 0, 3, 5, 7, 24, 27, 29, 31 |
3) Distinguishability Experiments
These experiments were conducted to illustrate how rEIT provides more resolved imaging. Specifically, the experiment explored the minimum separable distance needed to distinguish two objects.
In each measurement configuration, two inclusions were placed within the tank. The inclusions were positioned so that their centers had an x-translation from the tank center of 2 to 5 cm in 1 cm steps in the cylindrical tank and 2 to 4 cm in 0.5 cm steps in the breast-shaped tank, and the inclusions were separated in the y-direction by 0.5 to as much as 3 cm in 0.5 cm steps in both experiments (see Fig. 1a for an illustration of the x-translation and separation). The inclusions were suspended so that when the tank was rotated the inclusions remained fixed in place. In the breast-shaped tank the inclusions were centered at a depth of 2.5 cm.
Distinguishability Metric
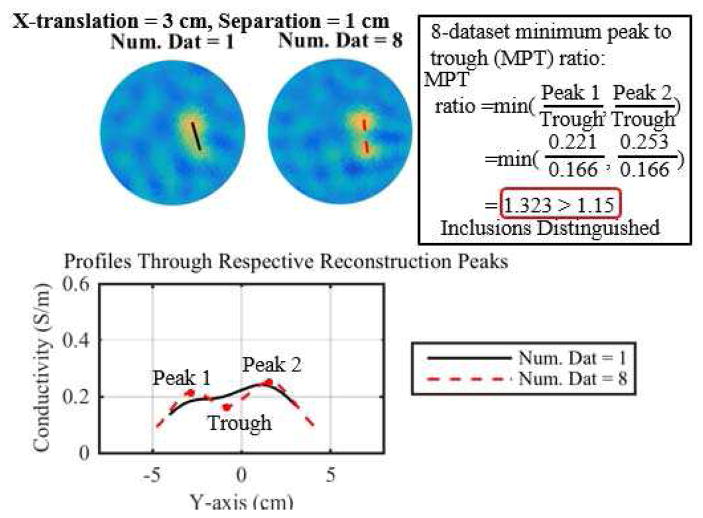
A distinguishability metric was developed that incorporated a minimum peak to trough (MPT) ratio and a background noise (BN) measure. The inclusions were considered distinguishable if the MPT ratio was above a tolerance of 1.10 or 1.15, i.e. the minimum peak was 10% or 15% larger than the trough. Two tolerances were chosen because distinguishability is a subjective measure and these two values both help to illustrate the differences in reconstructions between the methods and number of combined datasets. A peak was required to be three times larger than the background noise, 3BN. The BN is defined to be the standard deviation of the reconstructed conductivity on nodes whose x-value was less than −1 cm, i.e. the background from the left side of the reconstructions in Fig. 2. The trough was defined to be the minimum point on the line joining the two peaks. If two peaks were not found, then the MPT ratio was assigned a value of 1. Fig. 2 provides an illustration of the MPT ratio and distinguishability metric on two example reconstructions (1 dataset and 8 fused datasets using the DF/I technique and 1-mesh approach). The reconstruction from the 8 fused datasets provides sufficient separation to quantitatively and qualitatively distinguish the inclusions, while the single dataset reconstruction yields a blurred region that does not clearly distinguish the inclusions. This approach to quantifying distinguishability is similar to that used in [31].
Fig. 2.
Illustration of the minimum peak to trough (MPT) ratio via two example reconstructions (1 dataset and 8 fused datasets using the DF/I technique and 1-mesh approach) and their respective profiles through the reconstructed peaks.
Other Metrics
In addition to the distinguishability metric, an x-translation error and separation error were used. The separation error was only calculated if two peaks were identified. Additionally, the background conductivity error and inclusion contrast, defined by the mean peak value divided by the mean background conductivity, was used to quantitatively evaluate the recovered conductivity values and the potential of absolute imaging.
III. Results
The benefits of rEIT were evaluated using mathematical tools (i.e. SVD analysis), qualitative and quantitative analysis of images reconstructed from a series of experiments, and direct analysis of the raw voltage measurements. All data is measured and all reconstructions are absolute.
A. Mathematical Analysis of the Inversion (SVD Analysis)
The mathematical tools described in Section II.C were used to analyze the potential improvement associated with the fused datasets. This analysis is only applicable for the DF/I technique, since the inverse step remains the same for all data sets in the case of the I/DF technique.
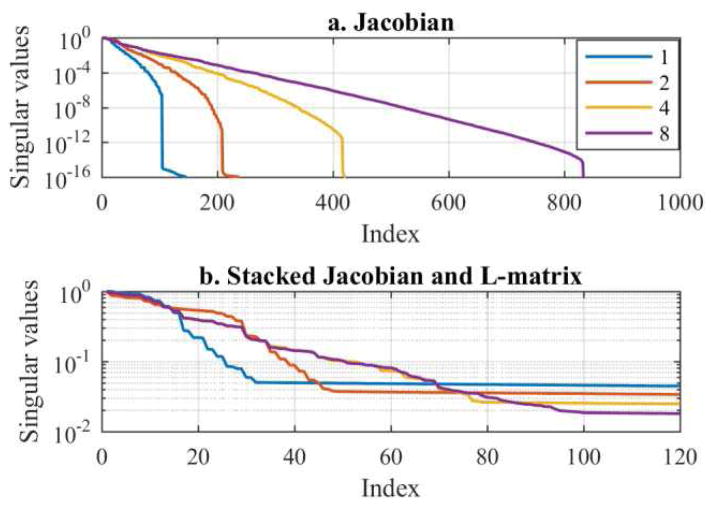
First, SVs of the fused-data Jacobian, JFD, and the stacked Jacobian and regularization matrix, B, for 1, 2, 4 and 8 fused datasets are computed (Fig. 3) for the cylindrical tank and 1-mesh approach. The SVs of JFD drop to numerical precision (~1×10⁻¹⁶) at NR×L(L-3)/2, which is the product of the number of rotations and the maximum number of independent measurements possible in an L-electrode tetrapolar measurement system (Fig. 3a). As expected, this suggests that rEIT provides significantly more information as additional datasets are fused. Similar findings were reported in [12]. Although the SVs will always decay exponentially, the degree of ill-posedness (page 8 of [26]) is reduced (rate of decay of SVs is slower) when more fused datasets are used. The SVs that correspond to the stacked Jacobian and regularization matrix, B, decrease exponentially until the SVs are influenced by the regularization (Fig. 3b). While only the first 120 SVs are shown, the SVs only drop to approximately 1×10⁻³ which implies the B matrices are each numerically well-conditioned. The index at which the SVs level off signifies the point at which the regularization becomes dominant. In other words, there are only 32, 48, 79, and 100 SVs that are directly related to the Jacobian for the 1, 2, 4, and 8 fused datasets, respectively. Analysis via Picard’s condition revealed 71, 105, 163, and 218 stable SVs for inversion when combining 1, 2, 4, and 8 fused datasets, respectively.
Fig. 3.
Illustration of the normalized singular vectors from a. the Jacobian, JFD (10) and b. the stacked Jacobian and regularization matrix, B, for 1, 2, 4, and 8 fused datasets.
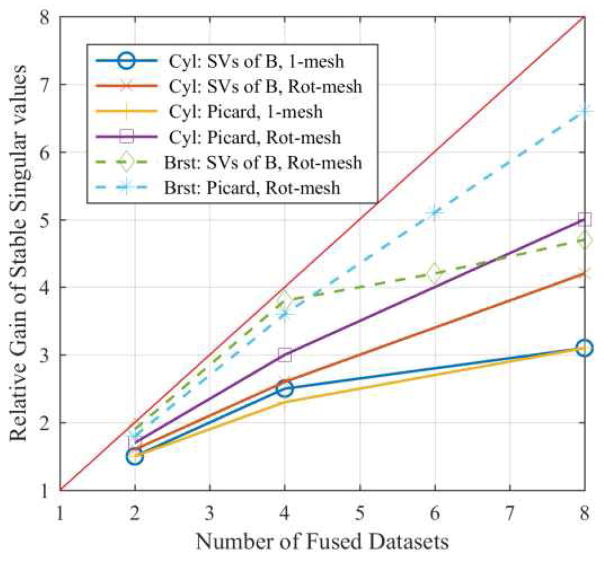
The results for the SVs of JFD are overly optimistic, as they do not consider the stability of the singular vectors. The improvements in terms of relative gain of singular vectors are shown in Fig. 4 for the other two methods (SV analysis of B and the Picard condition) corresponding to both tanks and the 1-mesh and rotated-mesh approaches. The analyses from the SVs of B (Fig. 3b) and Picard condition exhibit nearly the same improvement factor for the 1-mesh approach, whereas the Picard condition analysis results in slightly higher gains than the SVs of B analysis for the rotated-mesh approach. The analysis of the SVs of B is more relevant since they are directly linked to the regularization, which has been tuned to provide the best reconstruction results. Overall, these analyses suggest multiple fused datasets provide a relative gain of as much as 4.2 and 4.7 times the number of singular vectors as compared to a single dataset for the cylindrical and breast-shaped tank, respectively (Fig. 4). The gain using 8 fused datasets (4.2 and 4.7) is similar to what one would ideally expect by doubling the number of electrodes (4.46); additionally, the gain is decreasing in slope as more datasets are fused, which implies there is likely an upper limit to the possible gains.
Fig. 4.
The relative gain in stable singular vectors as a function of number of fused datasets for the cylindrical (Cyl) and breast-shaped (Brst) tanks and the 1-mesh and rotated-mesh approaches predicted by the singular vector analysis of B (SVs of B) and the Picard condition.
B. Cylindrical Tank: Distinguishability Experiment
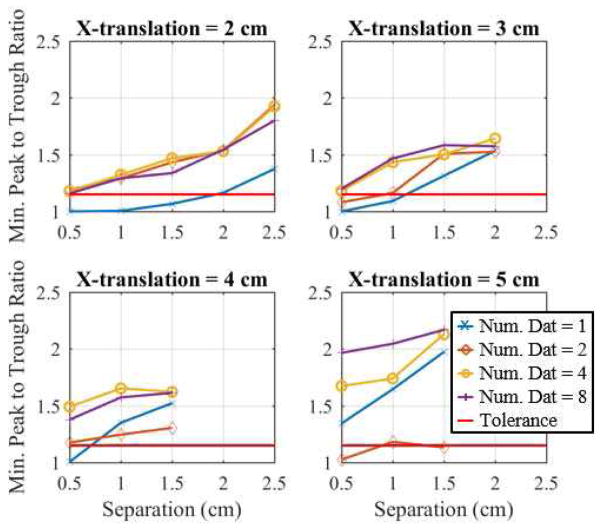
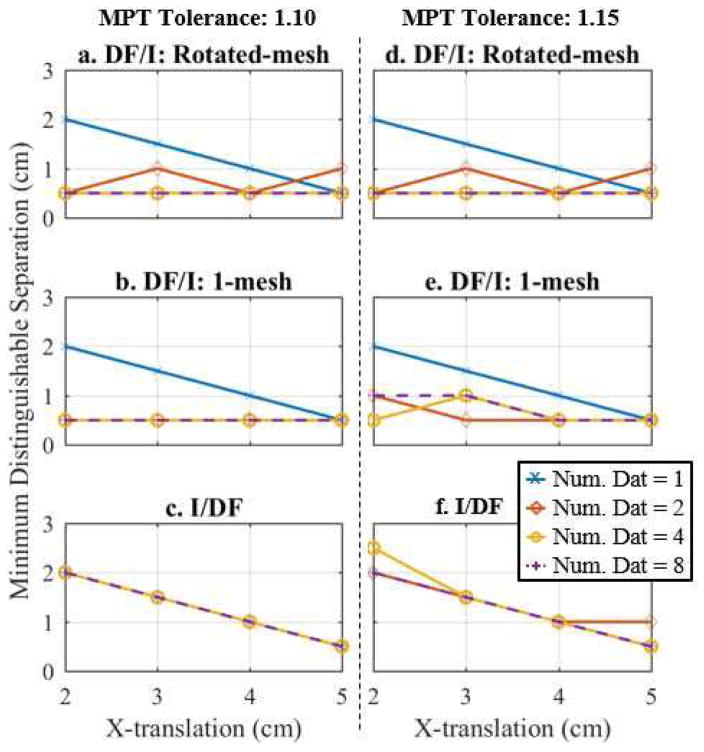
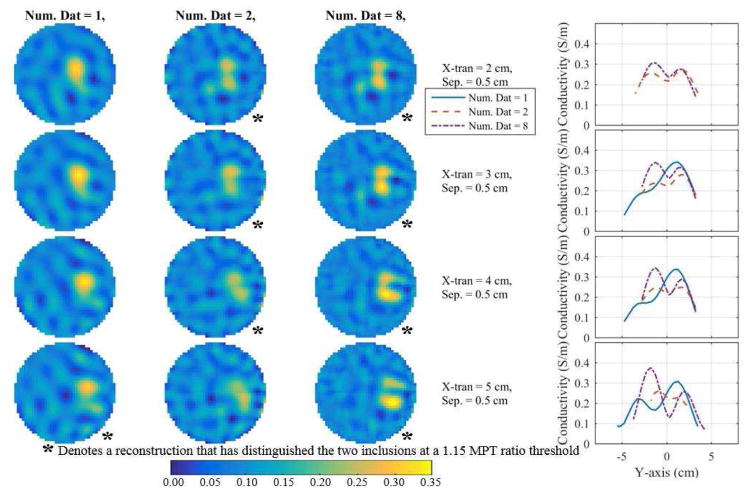
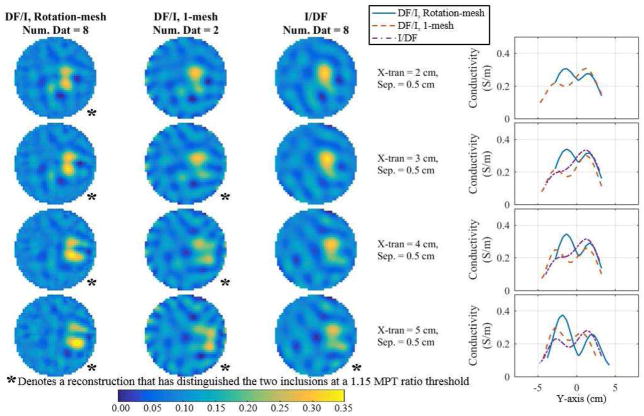
This experiment illustrates the ability of rEIT to distinguish two metal inclusions in a cylindrical tank using three methods; 1) DF/I technique using the rotated-mesh approach, 2) DF/I technique using the 1-mesh approach, and 3) the I/DF technique. We verified that the I/DF technique produced equivalent images for both the 1-mesh and rotated-mesh approaches. We show example plots of the MPT ratio versus separation for each x-translation in Fig. 5 and compare the minimum distinguishable separation using each method (Fig. 6) assuming tolerances of 1.10 and 1.15. The best reconstructions (assuming a tolerance of 1.15) are illustrated (Fig. 7) and compared to the other methods (Fig. 8). Finally, the spatial metrics and the inclusion contrasts are used to further evaluate these absolute reconstructions (Fig. 9).
Fig. 5.
Plots of the minimum peak to trough (MPT) ratios for 1, 2, 4, and 8 fused datasets using the DF/I technique and rotated-mesh approach. The MPT ratio increases as the inclusions are moved apart. One can see that the fusion of datasets increases the MPT ratio.
Fig. 6.
Plot of the minimum distinguishable separation for 1, 2, 4, and 8 fused datasets using the a/d. DF/I technique and rotated-mesh approach, b/e. DF/I technique and 1-mesh approach, and c/f. I/DF technique, which is determined by finding the minimum separation that yields an MPT ratio of 1.10 (a–c) or 1.15 (d–f) (see Fig. 5).
Fig. 7.
Reconstructions (using the DF/I and rotated-mesh approach) corresponding to the smallest distinguishable separation (across number of fused datasets) at each x-translation for 1, 2, and 8 fused datasets (first three columns) along with profiles through their respective peaks (last column). The profiles are the reconstructed conductivities over the line connecting the two peaks. If there is no profile for a number of fused datasets then two peaks were not detected.
Fig. 8.
Reconstructions comparing DF/I to the I/DF technique for 8 fused datasets corresponding to the DF/I’s smallest distinguishable separation at each x-translation. The first three columns show the reconstructions and the final column shows the corresponding profiles through the peaks. If there is no profile for a number of fused datasets then two peaks were not detected.
Fig. 9.
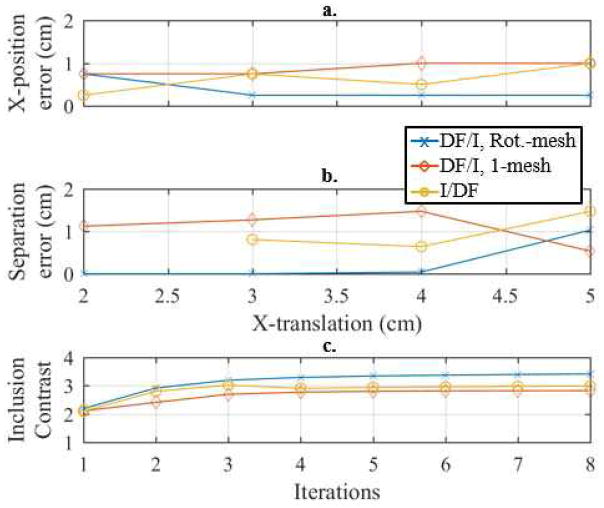
Illustration of the a. X-position error and b. separation error, versus x-translation and the c. inclusion contrast (averaged across x-translations) versus iteration across each reconstruction method. The true separation at each x-translations corresponds to the reconstructions shown in Figs. 7 and 8.
Fig. 5 shows the MPT ratio as a function of inclusion separation for each x-translation considered when a DF/I technique and rotated-mesh approach were used for reconstructions. The right end-point of the curves represents the maximum separation tested for the particular x-translation. The MPT ratio increases as the inclusions are spaced further apart, which implies an increased distinguishability. Visually, there is a significant improvement observed when incorporating fused datasets. It is interesting to note that as the inclusions are moved closer to the center the differences between combining 2, 4, and 8 datasets becomes much smaller.
The curves in Fig. 5 with the chosen tolerances of 1.10 and 1.15 are used to determine the minimum distinguishable separation for each x-translation, shown in Fig. 6 for all methods. As expected the minimum distance at which two inclusions can be distinguished decreases as the inclusions approach the tank boundary (Fig. 6) where EIT is most sensitive. The best method is clearly the DF/I technique using the rotated-mesh approach. It is able to distinguish the two inclusions at a separation of 0.5 cm for all x-translations when 4 or more datasets are fused using the larger/more challenging tolerance of 1.15. We suspect the 2 combined datasets performs worse because of (dual) inverse mesh artifacts (discussed in Section IV), which are reduced by averaging over more datasets. Overall and using the more challenging tolerance of 1.15, the rEIT technique is able to distinguish two inclusions 1.5 cm closer together than traditional EIT (1 dataset) could achieve for inclusions placed 2 to 3 cm from the center. In the remainder of this subsection, the tolerance of 1.15 is assumed.
There is a significant difference between the DF/I and I/DF techniques. There appears to be no added ability to distinguish the inclusions using the I/DF technique compared to traditional EIT (Fig. 6c/f). The two DF/I techniques in contrast are quite similar. It appears that either 2- or 4- fused datasets is best for the 1-mesh approach (Fig. 6e).
Fig. 7 shows the reconstructions corresponding to the smallest overall distinguishable separation at each x-translation for 1, 2, and 8 datasets along with their corresponding conductivity profiles through the peaks using the best approach (DF/I using the rotated-mesh approach). Combinations of 4 datasets are omitted because they are nearly indistinguishable from the 8-dataset reconstructions. Combining 2 or 8 datasets provides better distinguishability between the two inclusions as compared to a traditional EIT (1 dataset). In fact, for x-translations of 2 to 4 cm the 1 dataset reconstructions only recovered a single peak (assuming separations from Fig. 7). The three methods are directly compared using each of their best number of fused datasets corresponding to the best method’s smallest distinguishable separation at each x-translation (Fig. 8). The first three columns show the reconstructions and the final column shows their corresponding profiles through the peaks. In each row, the inclusions reconstructed with DF/I are qualitatively more resolved than I/DF. Likewise, the I/DF approach is only able to quantitatively distinguish the two inclusions for an x-translation of 5 cm. The difference between the two DF/I techniques are more subtle, but qualitatively the rotated-mesh reconstructions have much more consistent contrast in the inclusions and the inclusions are more aligned vertically as expected based on the geometry of the measured data.
In Fig. 9 the spatial and contrast metrics are shown for the same reconstructions of Fig. 8. One can see that the DF/I and rotated-mesh approach is nearly always better in terms of each metric (except the smallest x-translation in the x-translation error metric). This reinforces the qualitative appearance of more accurately located and separated inclusions in Fig. 8 using this technique. We note that the separation error can only be calculated if two inclusions were detected. Thus x-translations of less than 3 cm could not be calculated for the I/DF technique. The contrast plot illustrates the convergence of the approach and the improvements one achieves using absolute imaging (3.4 contrast) compared to 1 iteration (2.2), i.e. a 1.5× improvement in contrast. The background conductivity error was 3.3%, 6.1%, and 4.8% for the reconstructions shown in Fig. 9 using the DF/I and rotated-mesh approach, DF/I and 1-mesh approach, and the I/DF technique, respectively.
C. Breast Tank: Distinguishability Experimental
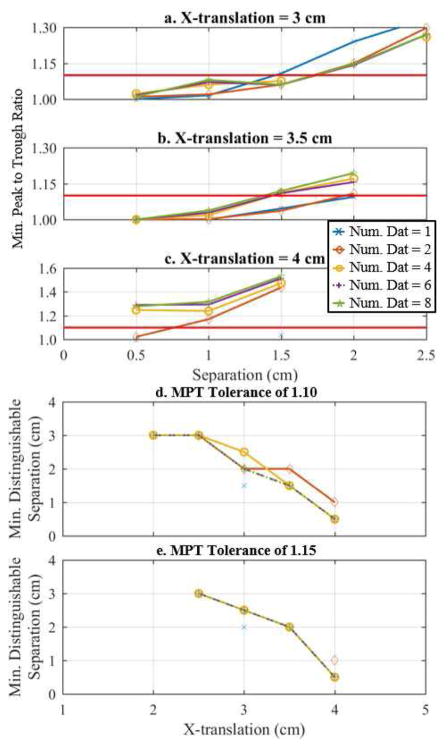
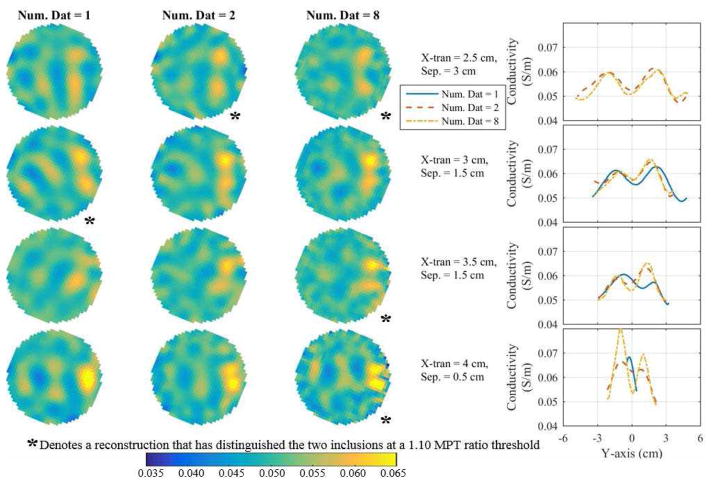
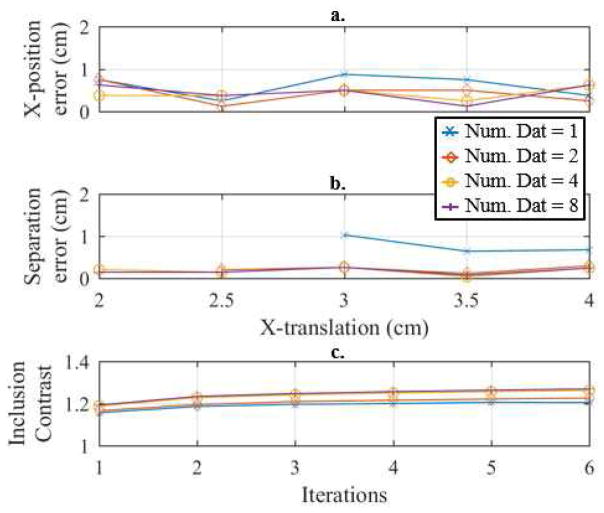
The second experiment was performed on a breast-shaped tank (Fig. 1b), which is a realistic potential clinical geometry with tumor and saline conductivities chosen similar to a fatty breast [28]. Essentially the same experiment was performed as with the cylindrical tank, but here the geometry is more complicated, multiple rows of electrodes are used, and the inclusions are of a smaller size and contrast more closely representing typical tumor sizes and conductivities. Reconstructions were performed using the DF/I technique with the rotated-mesh approach. The minimum distinguishable separations are determined (Fig. 10d–e) using the MPT ratio (Fig. 10a–c) with tolerances of 1.10 and 1.15. The reconstructions at the minimum distinguishable separation (assuming a tolerance of 1.10) using 1, 2, and 8 combined datasets are compared qualitatively in Fig. 11 and quantitatively in Fig. 12.
Fig. 10.
Minimum peak to trough ratios versus separation for x-translation of a. 3 cm, b. 3.5 cm, and 4. cm from the tank center. Based on these MPT ratios and tolerances of 1.10 and 1.15, d. and e. show the resulting minimum distinguishable separation versus x-translations for 1, 2, 4, 6, and 8 combined datasets, respectively.
Fig. 11.
Reconstructions of the breast-shaped tank (Fig. 1b) (using the DF/I and rotated-mesh approach) corresponding to the smallest distinguishable separation at each x-translation for 1, 2, and 8 combined datasets (first three columns) along with profiles through their respective peaks (last column). The profiles are the reconstructed conductivities over the line connecting the two peaks. If there is no profile for a number of fused datasets then two peaks were not detected.
Fig. 12.
Illustration of the a. x-position error and b. separation error, versus x-translation and the c. inclusion contrast (averaged across x-translations) versus iteration across 1, 2, 4, and 8 combined datasets of the breast-shaped tank. The true separation at each x-translations corresponds to the reconstructions shown in Fig. 10.
One can see a clear improvement when using 6 and 8 combined datasets by the MPT ratio plots at 3.5 and 4.0 cm x-translations (Fig. 10b–c) and the overall minimum distinguishable separation curves in Fig. 10d assuming a tolerance of 1.10. We prefer using the tolerance of 1.10 opposed to 1.15 because the 1.10 tolerance better illustrates the subtle changes between the different numbers of combined datasets used (compare Fig. 10d to 10e). In the remainder of this subsection, we assume a tolerance of 1.10. Regardless, the minimum distinguishable separations are much larger than the cylindrical tank experiment (Fig. 6a,d), which is expected because of the smaller sized inclusions and significantly reduced inclusion-to-background contrast. It is surprising that according to the MPT ratio the 1-combined dataset outperforms the 2, 4, 6, and 8 combined datasets at an x-translation of 3 cm (Fig. 10d). However, if one inspects the reconstructions (Fig. 11) and the spatial metrics (Fig. 12), it is apparent that the inclusions spatial locations and separations have significant errors. In terms of the contrast metric, one again sees the best contrast by taking multiple iterations (absolute imaging) and by combining 8-datasets (1.27). Unfortunately, it is significantly less than the ideal contrast 4.4 (= 0.22/0.05). This significant underestimate is likely caused by the ill-posed nature of the problem and the combination of the Laplace smoothing regularization and the small size of the inclusions. Regardless, it is a 7% improvement compared to 1-iteration and a 5% improvement compared to traditional EIT (using 6 iterations). The background conductivity error was very accurate in this experiment, i.e. less than 0.5% for each reconstruction shown in Fig. 12. Overall, the 8 fused datasets appears best when considering together the minimum distinguishable separations (assuming a 1.10 tolerance), qualitative analysis of the reconstructions, and the spatial and contrast metrics.
D. Measurement Limitations on Distinguishability
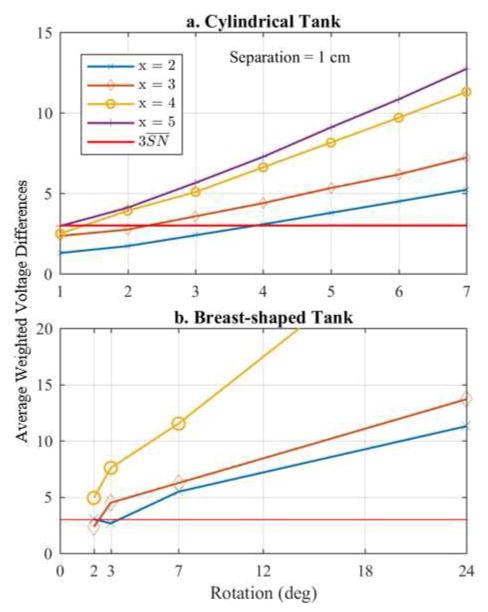
Finally, the hardware specification of the data acquisition system will impact the potential improvements provided by rEIT. Fig. 13 shows the average weighted voltage difference (AWVD) between measurements recorded at rotations of θ and 0 degrees at a fixed inclusion separation of 1 cm for both experiments, which can be written as
Fig. 13.
Plot of the average weighted differences between a rotation of θ and 0 degrees for each x-translation and a separation of 1 cm. Points above , on average, should provide information whereas points below fall within the noise of the system.
| (13) |
where SNn is the standard deviation of the system noise for the nth measurement. Points below the line are on average more likely to be corrupted by noise than those above . As expected, measurements are above this noise threshold when the inclusions are closer to the boundary and when there are larger changes in the rotation, Δ θ. For instance, in the cylindrical experiment (Fig. 13a) at x-translations of 2 and 3 cm, a minimum Δ θ of 3 and 4 degrees, respectively, is required to on average detect a measureable change in voltage. Based on how the datasets have been combined here, this implies that reconstructions using only 2 datasets are expected to be best (i.e. a 7 degree rotation change) as opposed to 4- and 8-fused dataset reconstructions (i.e. 2 and 1 degree rotations, respectively) for x-translations of 2 and 3 cm. The 2-fused dataset reconstructions do indeed appear to be better than 4- and 8-fused dataset reconstructions when using the DF/I and 1-mesh approach (Fig. 4b) at these x-translations. In the case of the breast-shaped tank (Fig. 13b), larger rotations were considered, and therefore most of the rotations result in average weighted voltage differences above the threshold. One can see, e.g. that for an x-translation of 2 cm on average the 2 and 3-degree rotations are corrupted by noise, but the DF/I technique using the rotated-mesh approach appears robust to this. Regardless the overall importance of this analysis is to illustrate that there is a clear limit on the number of rotations (fine-ness of rotations that can be used), which would expect to add information and that this should be considered when designing a rEIT system.
IV. Discussion
This study reports 1) experimental evidence that illustrates the improvements offered by rEIT, and 2) provides the first rEIT (or fused-data EIT) study that has produced absolute images (with relatively large electrodes) for a realistic clinical application. In this section we discuss the modeling of the 1-mesh versus rotated-mesh approach and the above two points.
1-Mesh versus Rotated-Mesh Approaches
The 1-mesh approach was developed to minimize (dual) inverse mesh artifacts. Standard FEM mesh artifacts are well-studied and are known to potentially cause significant artifacts [32]. However, the dual mesh artifacts are different. An element of the inverse mesh is composed of numerous tetrahedra making up the same volume within the fine FEM mesh. A particular coarse element within the stationary inverse mesh will incorporate a different set of fine mesh elements for each rotation of the rotated-mesh approach, while the inverse element will consist of the same fine elements for all rotations when the stationary 1-mesh approach is used. These small variations can lead to artifacts in electrical property estimation. We believe this is why gains are limited for the rotated-mesh approach when only 2 datasets are used; the two different rotations could represent quite different sets of fine elements within each inverse mesh element. Despite this, we found that with a larger number of datasets the rotated-mesh approach in general performed better than the 1-mesh approach. We hypothesize that this slight jitter introduced on the volume of each inverse mesh element is beneficial to rEIT reconstructions, especially in improving spatial accuracy.
Experimental Evidence of Improvements offered by rEIT
This study was motivated by a lack of clarity on how much improvement rEIT can provide ([10], [12]). In these prior studies there appeared to be overly optimistic improvements that could have been caused by poor modeling choices (Figs. 12–13 in [12]), and the remaining illustrations did not clearly quantify the improvements (e.g. improvement versus distance from tank edge). This study provides a rigorous evaluation of rEIT that 1) gives guidance on the preferred modeling approach (DF/I technique using a rotated-mesh approach), 2) clearly describes the inversion approach, and 3) quantifies the improvements via singular value analysis and two experiments that clearly show how rEIT improves the reconstructions qualitatively and quantitatively.
Absolute Imaging and Clinical Applications of rEIT
It is essential that absolute imaging is achievable using rEIT for clinical applications such as breast cancer imaging ([17]). This study has established absolute imaging using rEIT on two tank experiments. Although tank experiments are more controlled compared to clinical situations it is an important step. Our prior studies in breast imaging ([5], [33]) involved an EIT system in which the woman would lie on a custom examination table with her breast hanging pendant. Four rings of 16 electrodes were then lightly pressed against the breast. It was very challenging to obtain accurate boundary information ([34]), which is needed for absolute imaging ([35]). To overcome this problem and to utilize the potential of rEIT, we envision a slight modification of the system in which the breast is compressed into a shallow tank with embedded electrodes. This scenario/system 1) can give accurate knowledge of the domain (and electrode positions), 2) is applicable for rEIT, and 3) could be combined with other modalities such as an automated whole breast ultrasound system ([36]). This system would be similar to [13], except in its use of relatively large electrodes, which are preferable ([15], [16]), and in the combination with ultrasound. The possible addition of a bimodal system is important for data registration and could provide further improvements to reconstructions (e.g. [37]). Practical solutions such as a properly chosen ultrasound gel or a shallow saline bath could ensure proper electrode contact (with minimal shunting) and ease of tank rotations. This study represents an important step towards the development of such a system.
In ongoing research we are investigating a fused-data EIT approach for prostate cancer imaging applications by fusing multiple sets of transrectal EIT (TREIT) ([38], [39]) data together to form an improved reconstruction and we may investigate this approach in a related project, intraoperative surgical margin assessment ([6]). The analysis of modeling approaches performed here provides important lessons that can be used to better design and deploy EIT systems and potentially help to translate this technology to the clinic.
V. Conclusions
In conclusion this study 1) developed a method capable of obtaining spatially accurate absolute rEIT reconstructions with improved image contrast and an improved ability to distinguish between closely spaced inclusions compared to traditional EIT, 2) clearly illustrated improvements due to rEIT via mathematical analysis and qualitative and quantitative assessments from two tank experiments, and 3) demonstrated through direct analysis of the measured data clear limitations in the minimum rotation step that add new information. The ability to perform absolute reconstructions using rEIT on a practical clinical scenario (breast-shaped tank experiment) and clearly showing its improvements over traditional EIT are important steps towards using rEIT to improve previous EIT results in medical applications.
Acknowledgments
This work was supported in part by the U.S. National Institutes of Health under Grant 1R01CA143020–01A1 and DoD Congressionally Directed Medical Research Program under Grant W81XWH-15-1-0102.
This work was supported in part by the U.S. National Institutes of Health under Grant 1R01CA143020–01A1 and DoD CDMRP Grant W81XWH-15-1-0102.
We would also like to thank Xiaotian Wu for his construction of the breast-shaped tank.
Contributor Information
Ethan K. Murphy, Thayer School of Engineering, Dartmouth College, Hanover, NH 03755, USA
Aditya Mahara, Thayer School of Engineering, Dartmouth College, Hanover, NH 03755, USA.
Ryan J. Halter, Thayer School of Engineering and Geisel School of Medicine at Dartmouth College, Hanover, NH 03755 USA
References
- 1.Bayford RH. Bioimpedance tomography (electrical impedance tomography) Annu Rev Biomed Eng. 2006;8:63–91. doi: 10.1146/annurev.bioeng.8.061505.095716. [DOI] [PubMed] [Google Scholar]
- 2.York T. Status of electrical tomography in industrial applications. J Electron Imaging. 2001;10(3):608. [Google Scholar]
- 3.Leonhardt S, Lachmann B. Electrical impedance tomography: The holy grail of ventilation and perfusion monitoring? Intensive Care Med. 2012;38(12):1917–1929. doi: 10.1007/s00134-012-2684-z. [DOI] [PubMed] [Google Scholar]
- 4.Aristovich KY, dos Santos GS, Packham BC, Holder DS. A method for reconstructing tomographic images of evoked neural activity with electrical impedance tomography using intracranial planar arrays. Physiol Meas. 2014;35(6):1095–109. doi: 10.1088/0967-3334/35/6/1095. [DOI] [PubMed] [Google Scholar]
- 5.Halter RJ, Hartov A, Paulsen KD. A broadband high-frequency electrical impedance tomography system for breast imaging. IEEE Trans Biomed Eng. 2008;55(2 Pt 1):650–9. doi: 10.1109/TBME.2007.903516. [DOI] [PubMed] [Google Scholar]
- 6.Mahara A, Khan S, Murphy E, Schned A, Hyams E, Halter R. 3D Microendoscopic Electrical Impedance Tomography for Margin Assessment during Robot-Assisted Laparoscopic Prostatectomy. IEEE Trans Med Imaging. 2015;34(7):1590–1601. doi: 10.1109/TMI.2015.2407833. [DOI] [PubMed] [Google Scholar]
- 7.Cherepenin A, Gulyaev YV, Korjenevsky AV, Sapetsky SA, Tuykin TS. An electrical impedance tomography system for gynecological application GIT with a tiny electrode array. Physiol Meas. 2012;33(5):849–62. doi: 10.1088/0967-3334/33/5/849. [DOI] [PubMed] [Google Scholar]
- 8.Arshad SH, Kunzika JS, Murphy EK, Odame K, Halter RJ. Towards a Smart Phone-Based Cardiac Monitoring Device using Electrical Impedance Tomography. IEEE BioCAS. 2015 [Google Scholar]
- 9.Murphy SC, York Ta. Electrical impedance tomography with non-stationary electrodes. Meas Sci Technol. 2006;17:3042–3052. [Google Scholar]
- 10.Huang CN, Yu FM, Chung HY. The Scanning Data Collection Strategy for Enhancing the Quality of Electrical Impedance Tomography. Instrum Meas IEEE Trans. 2008;57(6):1193–1198. [Google Scholar]
- 11.Liu J, Xiong H, Lin L, Li G. Evaluation of measurement and stimulation patterns in open electrical impedance tomography with scanning electrode. Med Biol Eng Comput. 2015;53(7):589–597. doi: 10.1007/s11517-015-1274-y. [DOI] [PubMed] [Google Scholar]
- 12.Huang CN, Yu FM, Chung HY. Rotational electrical impedance tomography. Meas Sci Technol. 2007;18(9):2958–2966. [Google Scholar]
- 13.Zhang X, Chatwin C, Barber DC. A feasibility study of a rotary planar electrode array for electrical impedance mammography using a digital breast phantom. Physiol Meas. 2015;36(6):1311–1335. doi: 10.1088/0967-3334/36/6/1311. [DOI] [PubMed] [Google Scholar]
- 14.Holder DS, editor. Electrical Impedance Tomography: Methods, History and Applications. Philadelphia: Institute of Physics Publising; 2005. [Google Scholar]
- 15.Gisser DG, Isaacson D, Newell JC. Electric Current Computed Tomography and Eigenvalues. SIAM J Appl Math. 1990;50(6):1623–1634. [Google Scholar]
- 16.McAdams ET, Jossinet J, Lackermeier A, Risacher F. Factors affecting electrode-gel-skin interface impedance in electrical impedance tomography. Med Biol Eng Comput. 1996;34(6):397–408. doi: 10.1007/BF02523842. [DOI] [PubMed] [Google Scholar]
- 17.Brown BH. Electrical impedance tomography (EIT): a review. J Med Eng Technol. 2003;27(3):97–108. doi: 10.1080/0309190021000059687. [DOI] [PubMed] [Google Scholar]
- 18.Somersalo E, Cheney M, Isaacson D. Existence and Uniqueness for Electrode Models for Electric Current Computed Tomography. SIAM J Appl Math. 1992;52(4):1023–1040. [Google Scholar]
- 19.Cheng KS, Isaacson D, Newell JC, Gisser DG. Electrode Model for Electric Current Computed Tomography. IEEE Trans Biomed Eng. 1989;36(9):918–924. doi: 10.1109/10.35300. [DOI] [PMC free article] [PubMed] [Google Scholar]
- 20.Vauhkonen PJ, Vauhkonen M, Savolainen T, Kaipio JP. Threedimensional electrical impedance tomography based on the complete electrode model. IEEE Trans Biomed Eng. 1999;46(9):1150–1160. doi: 10.1109/10.784147. [DOI] [PubMed] [Google Scholar]
- 21.Borsic A, Hartov A, Paulsen KD, Manwaring P. 3D electric impedance tomography reconstruction on multi-core computing platforms. Conf Proc Int Conf IEEE Eng Med Biol Soc. 2008;2008:1175–1177. doi: 10.1109/IEMBS.2008.4649371. [DOI] [PubMed] [Google Scholar]
- 22.Lee T, Leok M, McClamroch NH. Geometric numerical integration for complex dynamics of tethered spacecraft. Proc 2011 Am Control Conf. 2011 May;:1885–1891. no. [Google Scholar]
- 23.Lionheart WRB. EIT reconstruction algorithms: pitfalls, challenges and recent developments. Physiol Meas. 2004;25(1):125–142. doi: 10.1088/0967-3334/25/1/021. [DOI] [PubMed] [Google Scholar]
- 24.Borsic A. Regularisation Methods for Imaging from Electrical Measurements by Andrea Borsic. 2002 [Google Scholar]
- 25.Borsic A, Halter R, Wan Y, Hartov A, Paulsen KD. Electrical impedance tomography reconstruction for three-dimensional imaging of the prostate. Physiol Meas. 2010;31(8):S1–S16. doi: 10.1088/0967-3334/31/8/S01. [DOI] [PMC free article] [PubMed] [Google Scholar]
- 26.Hansen PC. Rank-Deficient and Discrete Ill-Posed Problems. 1998 [Google Scholar]
- 27.Mueller JL, Siltanen S. Linear and Nonlinear Inverse Problems with Practical Applications. 2012 [Google Scholar]
- 28.Jossinet J, Schmitt M. A review of parameters for the bioelectrical characterization of breast tissue. Annals of the New York Academy of Sciences. 1999;873:30–41. doi: 10.1111/j.1749-6632.1999.tb09446.x. [DOI] [PubMed] [Google Scholar]
- 29.Khan S, Manwaring P, Borsic A, Halter R. FPGA-Based Voltage and Current Dual Drive System for High Frame Rate Electrical Impedance Tomography. 2015;34(4):888–901. doi: 10.1109/TMI.2014.2367315. [DOI] [PubMed] [Google Scholar]
- 30.Soni NK, Dehghani H, Hartov A, Paulsen KD. A novel data calibration scheme for electrical impedance tomography. Physiol Meas. 2003;24(2):421–435. doi: 10.1088/0967-3334/24/2/354. [DOI] [PubMed] [Google Scholar]
- 31.Yasin M, Böhm S, Gaggero PO, Adler A. Evaluation of EIT system performance. Physiol Meas. 2011;32(7):851–865. doi: 10.1088/0967-3334/32/7/S09. [DOI] [PubMed] [Google Scholar]
- 32.Nissinen A, Kolehmainen VP, Kaipio JP. Compensation of modelling errors due to unknown domain boundary in electrical impedance tomography. IEEE Trans Med Imaging. 2011;30(2):231–242. doi: 10.1109/TMI.2010.2073716. [DOI] [PubMed] [Google Scholar]
- 33.Poplack SP, Tosteson TD, Wells Wa, Pogue BW, Meaney PM, Hartov A, Kogel Ca, Soho SK, Gibson JJ, Paulsen KD. Electromagnetic breast imaging: results of a pilot study in women with abnormal mammograms. Radiology. 2007;243(2):350–59. doi: 10.1148/radiol.2432060286. [DOI] [PubMed] [Google Scholar]
- 34.Forsyth J, Borsic a, Halter RJ, Hartov a, Paulsen KD. Optical breast shape capture and finite-element mesh generation for electrical impedance tomography. Physiol Meas. 2011;32(7):797–809. doi: 10.1088/0967-3334/32/7/S05. [DOI] [PMC free article] [PubMed] [Google Scholar]
- 35.Kolehmainen V, Vauhkonen M, Karjalainen Pa, Kaipio JP. Assessment of errors in static electrical impedance tomography with adjacent and trigonometric current patterns. Physiol Meas. 1997;18(4):289–303. doi: 10.1088/0967-3334/18/4/003. [DOI] [PubMed] [Google Scholar]
- 36.Kelly KM, Richwald GA. Automated Whole-Breast Ultrasound: Advancing the Performance of Breast Cancer Screening. Semin Ultrasound, CT MRI. 2011;32(4):273–280. doi: 10.1053/j.sult.2011.02.004. [DOI] [PubMed] [Google Scholar]
- 37.Steiner G, Soleimani M, Watzenig D. A bio-electromechanical imaging technique with combined electrical impedance and ultrasound tomography. Physiol Meas. 2008;29(6):S63–S75. doi: 10.1088/0967-3334/29/6/S06. [DOI] [PubMed] [Google Scholar]
- 38.Syed H, Borsic a, Hartov a, Halter RJ. Anatomically accurate hard priors for transrectal electrical impedance tomography (TREIT) of the prostate. Physiol Meas. 2012;33(5):719–38. doi: 10.1088/0967-3334/33/5/719. [DOI] [PMC free article] [PubMed] [Google Scholar]
- 39.Wan Y, Borsic A, Hartov A, Halter R. Incorporating a biopsy needle as an electrode in transrectal electrical impedance imaging. Proc Annu Int Conf IEEE Eng Med Biol Soc EMBS. 2012:6220–6223. doi: 10.1109/EMBC.2012.6347415. [DOI] [PMC free article] [PubMed] [Google Scholar]


