Abstract
Objectives
The purpose of this study was to investigate the ability of quantitative ultrasound (US) using edge detection analysis to assess patients with Duchenne muscular dystrophy (DMD).
Methods
After Institutional Review Board approval, US examinations with fixed technical parameters were performed unilaterally in 6 muscles (biceps, deltoid, wrist flexors, quadriceps, medial gastrocnemius, and tibialis anterior) in 19 boys with DMD and 21 age-matched control participants. The muscles of interest were outlined by a tracing tool, and the upper third of the muscle was used for analysis. Edge detection values for each muscle were quantified by the Canny edge detection algorithm and then normalized to the number of edge pixels in the muscle region. The edge detection values were extracted at multiple sensitivity thresholds (0.01–0.99) to determine the optimal threshold for distinguishing DMD from normal. Area under the receiver operating curve values were generated for each muscle and averaged across the 6 muscles.
Results
The average age in the DMD group was 8.8 years (range, 3.0–14.3 years), and the average age in the control group was 8.7 years (range, 3.4–13.5 years). For edge detection, a Canny threshold of 0.05 provided the best discrimination between DMD and normal (area under the curve, 0.96; 95% confidence interval, 0.84–1.00). According to a Mann-Whitney test, edge detection values were significantly different between DMD and controls (P < .0001).
Conclusions
Quantitative US imaging using edge detection can distinguish patients with DMD from healthy controls at low Canny thresholds, at which discrimination of small structures is best. Edge detection by itself or in combination with other tests can potentially serve as a useful biomarker of disease progression and effectiveness of therapy in muscle disorders.
Keywords: Duchenne muscular dystrophy, edge detection, muscle, musculoskeletal ultrasound, quantitative ultrasound
Duchenne muscular dystrophy (DMD) is the most common muscular dystrophy of childhood and affects 1 per 3600 male births.1 The disease is caused by mutations in the dystrophin gene, leading to progressive muscle weakness, which ultimately results in death due to respiratory and cardiac failure.2,3 Accurate, practical, and painless tests to diagnose DMD and measure disease progression are needed to test the effectiveness of new therapies.4 Current clinical outcome measures such as the 6-minute walk test and North Star Ambulatory Assessment can be subjective and limited by the patient's degree of effort and cannot be accurately performed in very young or severely affected older patients.5–7
Quantitative ultrasound (US) is a painless, easy-to-use, and effective test that is not affected by patient effort. Recent studies have shown that quantitative US, using grayscale luminosity, can distinguish diseased from healthy muscle in several childhood neuromuscular disorders.8–12 In many neuromuscular disorders, including DMD, intramuscular fibrosis and fatty infiltration occur and will increase the echo intensity of the muscle on grayscale US images.13 The echo intensity of the muscle can be quantified by many commercially available software programs, which convert the US image into a distribution of grayscale values. Patients with DMD will have higher muscle echo intensity compared to healthy control individuals.
Edge detection is a fundamental technique in the field of image processing and has been in use for decades, especially for feature detection; however, its use in medicine is relatively limited.14–16 Edge detection has been used effectively in clinical medicine to assess the size of cardiac chambers, prostate gland size, and intima-media thickness in blood vessels from US images.16–20 Abrupt intensity changes (edges) can indicate the boundaries of these anatomic structures, determining their areas or volumes quickly. However, in addition to determining the boundaries of an object to assess for area or volume, quantifying the number of edges per region of interest (edge density) can also assess textural variations within the object. It is this value that we believe is most advantageous when evaluating US images of diseased muscle. Points where the image brightness changes abruptly are termed edges, and identifying edges within an image can be used to determine the boundaries of an object.
There are several algorithms that can be used to perform edge detection, including Sobel, Prewitt, discrete singular convolution, and Canny algorithms.14,21,22 We choose the Canny algorithm for this pilot study because of its simplicity and more common use. These factors would increase the likelihood that our findings could be reproduced by researchers without extensive engineering expertise; however, it would be important in future trials to identify which edge detection algorithms are best. In the Canny algorithm, by adjusting the threshold for the detection of edges, one can assess textural differences between different-size structures within the image.14 Lower Canny thresholds are better at distinguishing small structural differences, whereas higher thresholds can distinguish larger structures. In skeletal muscle, fibrous tissue is present within the muscle and between muscles, forming intramuscular and intermuscular septa, respectively (Figure 1). As the muscle becomes affected by DMD, fibrosis and fatty infiltration occur, which lead to increase echogenicity on grayscale images.13 This factor makes distinguishing the echogenic septa within and between muscles harder to perform as the disease progresses. Alterations in the normal structural pattern of the muscle could be quantifiable by a change in the number of edges detected in the US image. It is our hypothesis that patients with DMD will have substantially more “edges” in their muscles compared to healthy boys. The purpose of this pilot study was to investigate the ability of quantitative US, using edge detection and quantification analysis, to distinguish patients with DMD from healthy control participants in the hope that it could serve as a useful measure of disease status and the effect of therapy.
Figure 1.
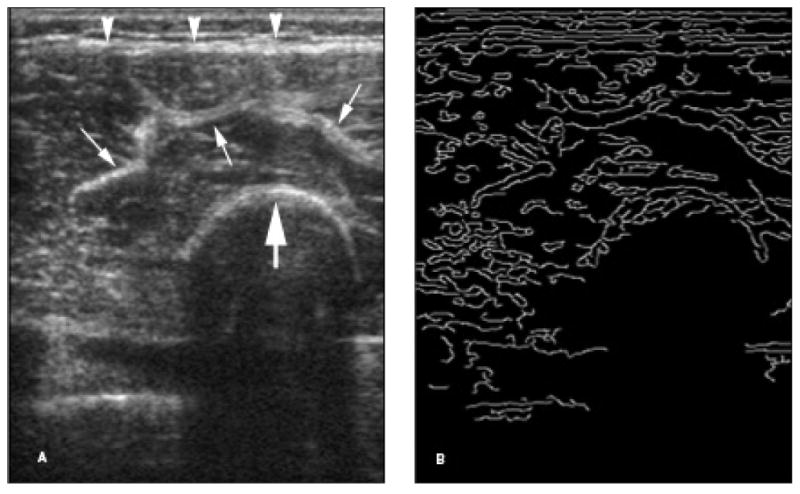
Edge detection analysis of a grayscale US image. A, Grayscale US image of the quadriceps muscle in a 7-year-old control participant. B, Binary image using edge detection Canny analysis of A. Note that the echogenic superficial fascia (arrowheads), muscle septa (thin arrows), and femoral cortex (thick arrow) on the grayscale image appear as bright curves (edges) on the binary image. The above edges are depicted at a sensitivity threshold of 0.40.
Materials and Methods
Patient Selection
The Institutional Review Board of Boston Children's Hospital approved this prospective study. Informed written consent and verbal assent were obtained, respectively, from parents and children. Consecutive boys with DMD were recruited and enrolled in the study through our neuromuscular disorders clinic and had genetic mutations and a clinical presentation consistent with DMD. Boys with DMD were excluded if they were involved in an ongoing clinical therapeutic trial or if they had another neuromuscular or other medical condition that substantially affected health. Consecutive age-matched healthy participants were recruited by advertisement and via family members and did not have a history of neuromuscular disease or other disease that would substantially affect health.
Ultrasound Examinations
All US examinations were performed with the same portable Terason t3000 system (Teratech, Inc, Burlington, MA) with a 10-MHz linear transducer within 2 years of the purchase of the machine. The machine performs system diagnostics with each boot-up and includes the following: (1) frequency test, which tests system clocks for accuracy (<0.02% variation); (2) noise test, which tests that maximum system noise is less than 1 least-significant bit; (3) analog loop-back signal test, which injects simulated signals into the analog front end to verify signal-channel integrity and channel matching; and (4) voltage test, which tests power supply voltages (<0.4% variation). In no cases did we receive any diagnostic errors during the use of the system. Transverse US images of 6 muscles (biceps brachii, deltoid, wrist flexors, quadriceps, tibialis anterior, and medial gastrocnemius) on the patient's dominant side were obtained. Dominance was determined by asking the child or parent, and when unknown, the child was given a ball to throw to assess his dominant side. Ultrasound settings (gain, compression, time-gain compensation, and depth) were kept constant for all image acquisitions, similar to past studies.8,23,24 Variations in these US parameters could theoretically change the intensity of the pixels and change the number of edges detected; thus, these settings were fixed. Research assistants, trained by a musculoskeletal radiologist (J.S.W.), obtained all US images with the transducer oriented perpendicular to the long axis of the muscle of interest. Ultrasound images were obtained with the participant seated and the knee bent at 90° and the arm extended at midchest height with the elbow straight and supported by the examiner or a pillow. The anatomic locations of the US transducer for the various muscle measurements are listed in Table 1.
Table 1. Anatomic Locations of US Measurements.
| Muscle | Location |
|---|---|
| Deltoid | One-fifth distance from acromion to lateral epicondyle |
| Biceps brachii | Arm supine, two-thirds distance from acromion to antecubital fossa |
| Wrist/finger flexors | Arm supine, one-third distance from medial epicondyle to base of thumb |
| Quadriceps | Two-thirds distance from inguinal crease to superior aspect of patella, seated knee bent |
| Tibialis anterior | One-fourth distance from fibula head to lateral malleolus midpoint, seated, ankle neutral |
| Medial Gastrocnemius | One-third distance from inferior aspect of popliteal fossa to medial malleolus, seated, ankle neutral |
Ultrasound Image and Data Analysis
Ultrasound images were exported from the Terason software to MATLAB version 7.14 software (The MathWorks, Natick, MA) as tagged image file format files. The muscle of interest was outlined with a polygonal region-tracing tool by a single musculoskeletal radiologist (J.S.W.). The area of the muscle, measured as the number of pixels, was calculated from the traced image. The analysis was made on a pixel basis, since we believe that this approach would best correlate with the textural changes that occur in the muscle with DMD disease. The pixel pitch was held constant by choosing the same physical parameters for image length and width during acquisition. Only the upper third of the traced muscle area was used for analysis (Figure 2), as described by Jansen et al,10 since there is attenuation of sound waves in the deeper tissue, making analysis of deeper structures in the image less effective. Edge detection values were quantified by using the Canny edge detection algorithm14 in MATLAB. The Canny algorithm detects edges in the image and produces a binary map of the edges. The number of edges, measured in edge pixels highlighted by the Canny algorithm, present in each muscle region (upper third) was then divided by the number of pixels in that same area of muscle to arrive at the edge detection value (unitless value). This value gives a normalized measure of the number of edges in the muscle region being evaluated.
Figure 2.
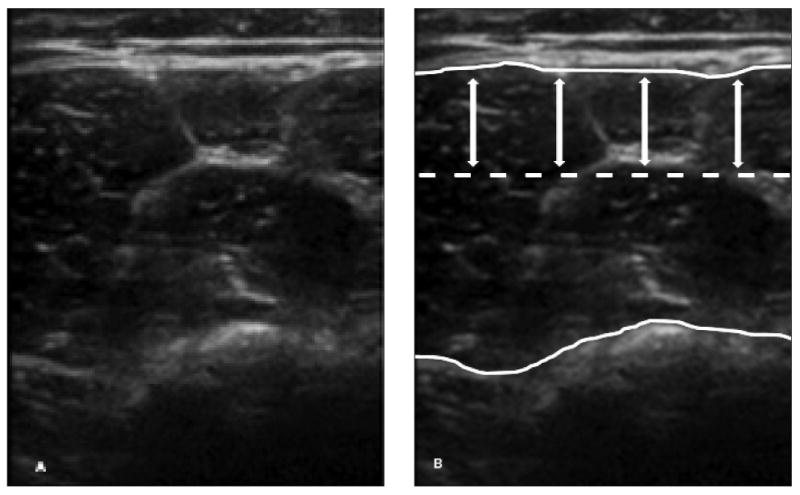
Muscle tracing and region of interest used in the analysis. A, Grayscale US image of the quadriceps muscles in a 6-year-old control participant. B, The traced muscle area (between white curves) excludes the subcutaneous tissue/skin, bone, and deeper tissues. The dotted line and double arrows denote the upper third of the muscle area used for analysis.
The edge detection values for all 6 muscle groups were extracted at multiple thresholds of sensitivity by using the Canny algorithm to determine the optimal threshold for distinguishing DMD from normal. The detector takes a threshold parameter for sensitivity, which can vary from 0.01 to 0.99. We generated a Canny binary map for all 99 thresholds between 0.01 and 0.99 at 0.01 intervals (Figure 3). This process allowed us to capture not only the number of edges detected per muscle area but also the behavior of the image as a function of edge thresholds. In addition, we attempted to maximize the signal-to-noise ratio for each Canny threshold by removing single isolated edge pixels that did not have connectivity to other edge pixels. This process would reduce the noise that could affect image analysis. This technique was performed for both the DMD and control participants.
Figure 3.
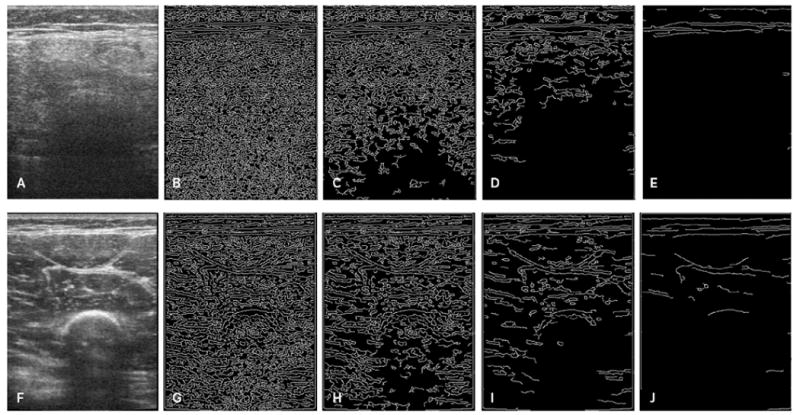
Edge detection and quantification images at different Canny sensitivity thresholds. A and F, Ultrasound images of the quadriceps muscles in a 6-year-old patient with DMD (A) and a 6-year-old control participant (F). Note the increased echo intensity of the muscle in the patient with DMD and poor visualization of the intermuscular fascial bands and bone. The corresponding edge detection images detected at Canny sensitivity thresholds of 0.05 (B and G), 0.10 (C and H), 0.20 (D and I), and 0.40 (E and J) are shown. More edges are detected at the lower thresholds than the higher thresholds in the patient with DMD compared to the control participant.
Statistical Analysis
Area under the receiver operating curve values for edge detection thresholds were generated for each muscle and the average of all 6 muscles using MedCalc version 14.8.1 software (MedCalc, Ostend, Belgium). The Mann-Whitney test was used to determine differences in edge detection values between patients with DMD and control participants, with P ≤ .05 considered significant.
Results
Patient Demographics
The average age in the DMD group was 8.8 years (range, 3.0–14.3 years), and the average age in the control group was 8.7 years (range, 3.4-13.5 years). Of the 19 boys with DMD, 9 were receiving corticosteroid therapy, and 11 were in the 4- to 10-year age group. Of the 21 controls, 12 were in the 4- to 10-year age group.
Ultrasound Image and Data Analysis
For the edge detection and quantification analysis, among the 99 Canny sensitivity thresholds tested (0.01–0.99), a threshold of 0.05 was the optimal threshold for distinguishing DMD from normal (Figure 4 and Table 2). Thus, this threshold was used for all subsequent analyses. Using the average of the 6 muscles, edge detection was excellent at distinguishing DMD from normal. For the individual muscles, edge detection was best at distinguishing DMD from normal in the gastrocnemius and poorest in the anterior tibialis, as listed in Table 3 and shown in Figure 5.
Figure 4.

Receiver operating characteristic curves for the various Canny edge detection (ED) thresholds. Edge detection of 0.05 was the optimal threshold for distinguishing DMD from normal.
Table 2. Area Under the Curve Values at Different Canny Edge Detection Thresholds for the 6-Muscle Average.
| Threshold | AUC | 95% CI |
|---|---|---|
| 0.05 | 0.95 | 0.83–0.99 |
| 0.10 | 0.90 | 0.77–0.97 |
| 0.15 | 0.87 | 0.73–0.96 |
| 0.20 | 0.82 | 0.67–0.92 |
| 0.40 | 0.55 | 0.39–0.71 |
| 0.60 | 0.60 | 0.44–0.75 |
| 0.80 | 0.56 | 0.39–0.71 |
| 0.95 | 0.57 | 0.41–0.72 |
AUC indicates area under the curve; and CI, confidence interval.
Table 3. Quantitative US Evaluation of DMD Using Edge Detection and Quantification Analysis.
| Muscle | ED (±SD) | AUC | 95% CI | P | |
|---|---|---|---|---|---|
|
| |||||
| Control | DMD | ||||
| Biceps | 0.213 (0.010) | 0.234 (0.010) | 0.91 | 0.78–0.98 | <.0001 |
| Deltoid | 0.207 (0.010) | 0.223 (0.014) | 0.86 | 0.71–0.95 | <.0001 |
| Wrist flexors | 0.204 (0.011) | 0.223 (0.010) | 0.92 | 0.78–0.98 | <.0001 |
| Quadriceps | 0.215 (0.011) | 0.231 (0.014) | 0.92 | 0.79–0.98 | <.0001 |
| Gastrocnemius | 0.207 (0.008) | 0.234 (0.015) | 0.97 | 0.86–1.00 | <.0001 |
| Tibialis anterior | 0.212 (0.016) | 0.226 (0.013) | 0.80 | 0.64–0.91 | .0001 |
| All 6 muscles | 0.210 (0.006) | 0.231 (0.008) | 0.96 | 0.84–1.00 | <.0001 |
AUC indicates area under curve; CI, confidence interval; and ED, edge detection.
Figure 5.
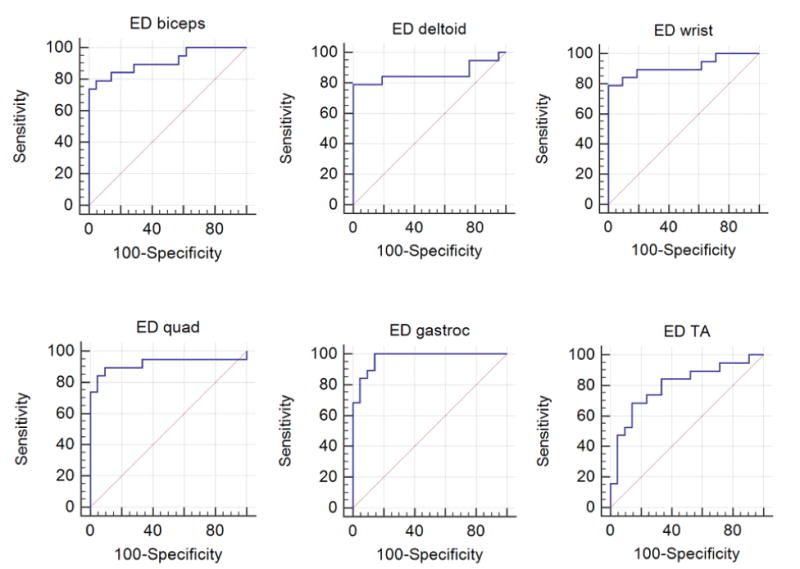
Receiver operating characteristic curves for edge detection (ED) analysis in 6 muscles: biceps, deltoid, wrist flexors, quadriceps (quad), gastrocnemius (gastroc), and tibialis anterior (TA).
For each of the 6 muscles, there were more edges detected in the DMD group compared to the control group. This finding was also true when all 6 muscle groups were averaged together: DMD had a median edge detection value of 0.231 (range, 0.208–0.238), whereas the control group had a median edge detection value of 0.210 (range, 0.197–0.221; P < .0001).
Discussion
There is a high need for accurate biomarkers capable of measuring disease progression and drug efficacy in muscle disorders, such as DMD, over time.25 In this prospective study, our results show that quantitative US using edge detection and edge quantification analysis was capable of distinguishing between boys with DMD and controls with high accuracy. We found, as hypothesized, that the muscle of patients with DMD had more edges on the US images compared to controls. With disease progression, the muscles in patients with DMD become infiltrated with echogenic fibrous tissue and fat, which obscure the similarly echogenic intramuscular and intermuscular septa (Figure 6).13
Figure 6.
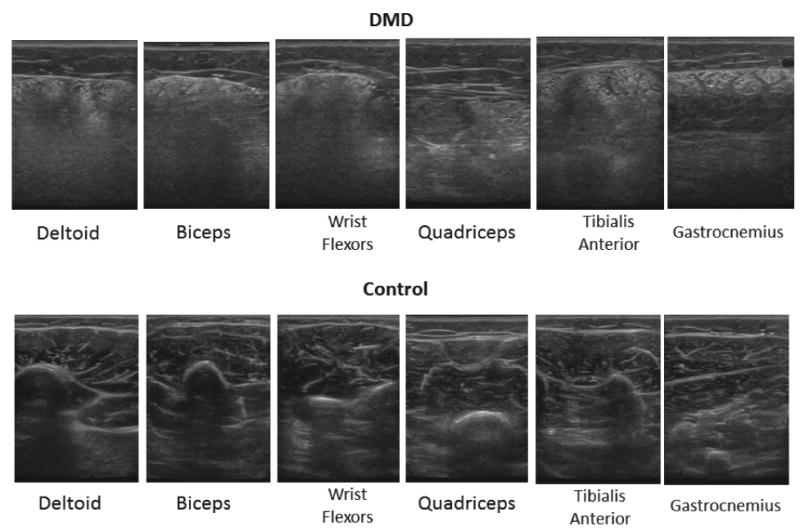
Ultrasound images of 6 muscles in a patient with DMD and a control participant. The 9-year-old patient with DMD (top row) has increased muscle echo intensity and obscuration of the intermuscular/intramuscular septa and bone compared to the 9-year-old control participant (bottom row).
Moreover, by using edge detection and quantification analysis, we were able to distinguish patients with DMD from the healthy control participants, similar to other quantitative US studies, which have relied primarily on variations in muscle echo intensity.10,23,24 In these echo intensity studies, a region-of-interest box was placed inside the muscle, or tracing of the muscle of interest was performed, and grayscale echo intensity values were generated.10,23,24 In general, diseased muscle has higher echo intensity than normal muscle because of deposition of fibrous tissue and fat, and this increased intensity has been shown to occur in a variety of diseases, including DMD.8,10,26 It is unclear whether the increase in edges seen in this study and increased echo intensity values seen in past studies of patients with DMD indicated corresponding structural changes in the muscle.
Edge detection has the ability to selectively evaluate different components of muscle, which is not entirely possible with echo intensity analysis. In edge detection, lower Canny sensitivity thresholds correspond to edges with smaller dimensions (length) and are more representative of smaller components of muscle, such as the muscle fascicles and intramuscular septa, whereas higher sensitivity thresholds correspond to longer edge dimensions and larger structures, such as the intermuscular fascia. By adjusting sensitivity thresholds, one can assess differences in the various structural components of the muscle. In this study, edge detection was best at the lower Canny thresholds for distinguishing DMD from normal, suggesting that the muscle changes can be attributed to the smaller edges and therefore the small components of muscle. Interestingly, it is more difficult to perceive visual differences in the number of edges between DMD and controls at the lower Canny thresholds than at the higher levels. However, when edge detection analysis is performed, the lower Canny thresholds reveal more substantial differences between the groups.
Edge detection analysis was able to distinguish between DMD and controls for each of the 6 muscles and with the average of the 6 muscles. Moreover, edge detection performed best when evaluating the gastrocnemius. This result is supported by past imaging studies using computed tomography and magnetic resonance imaging, which have shown that muscle atrophy with fatty infiltration is most pronounced in the posterior as opposed to the anterior calf muscles.27–29 In fact, the anterior compartment muscles are often normal on imaging even with longstanding disease.28,29 Clinically, calf pseudohypertrophy is a characteristic finding in DMD, in which, despite circumferential enlargement of the calf from fat deposition, muscle weakness is present.25
A few limitations deserve mention. First, this work was a cross-sectional pilot study, and the sample size was relatively small, with roughly 20 participants in each group. Future longitudinal studies with larger numbers of participants will assess whether edge detection has the ability to monitor disease progression and efficacy of therapies. Another limitation was the inability to change US parameters during image acquisition. Altering the depth, gain, or focus could affect the appearance of the final image and intensity of pixels within the image and change the number of edges detected. However, the settings were identical for all muscles and participants, and this technique has been shown to be effective for several neuromuscular disorders and research groups.8,10,24,30,31 Using raw frequency or backscatter data could potentially correct for this issue.9,26 Last, tissue motion, either by the patient or examiner, during acquisition of the US images could impact the reliability of the technique, affecting the resolution and number of edges in the images. However, the US imaging techniques used in this study have been shown in a prior study of boys with DMD to have high inter-rater reliability (intraclass correlation coefficient, ≥0.85), in research assistants with only a 20-minute training session.23 Moreover, great care was taken to acquire images without motion artifacts, and muscle tremors by the patient were very uncommon. Furthermore, the techniques used were identical between controls and patients with DMD; thus, potential issues related to tissue motion would likely be equal in both groups. In future studies, we plan to include a force stabilization attachment to our US transducers.
In conclusion, quantitative US using edge detection analysis can distinguish patients with DMD from healthy control participants at low sensitivity thresholds, at which discrimination of small structures is best. Although edge detection is a somewhat rudimentary method for characterizing texture, based on our results, this technique appears to work well for distinguishing muscle disease in DMD from normal. Future studies with more patients evaluated over several time points are needed to determine whether edge detection by itself or in combination with other tests can improve the assessment of disease progression and drug efficacy in muscle disorders, including DMD.
Acknowledgments
This study was funded by the National Institutes of Health grant R01 AR060850-01A1.
Abbreviations
- DMD
Duchenne muscular dystrophy
- US
ultrasound
Contributor Information
Sisir Koppaka, Laboratory for Manufacturing and Productivity, Massachusetts Institute of Technology, Cambridge, Massachusetts USA; Medical Electronic Device Realization Center, Massachusetts Institute of Technology, Cambridge, Massachusetts USA.
Irina Shklyar, Department of Neurology, Beth Israel Deaconess Medical Center, Boston, Massachusetts USA.
Seward B. Rutkove, Department of Neurology, Beth Israel Deaconess Medical Center, Boston, Massachusetts USA.
Basil T. Darras, Department of Neurology, Boston Children's Hospital, Boston, Massachusetts USA.
Brian W. Anthony, Laboratory for Manufacturing and Productivity, Massachusetts Institute of Technology, Cambridge, Massachusetts USA; Medical Electronic Device Realization Center, Massachusetts Institute of Technology, Cambridge, Massachusetts USA.
Craig M. Zaidman, Departments of Neurology and Pediatrics, Washington University, St Louis Missouri USA.
Jim S. Wu, Department of Radiology, Beth Israel Deaconess Medical Center, Boston, Massachusetts USA.
References
- 1.Emery AE. Population frequencies of inherited neuromuscular diseases: a world survey. Neuromuscul Disord. 1991;1:19–29. doi: 10.1016/0960-8966(91)90039-u. [DOI] [PubMed] [Google Scholar]
- 2.Hoffman EP, Brown RH, Jr, Kunkel LM. Dystrophin: the protein product of the Duchenne muscular dystrophy locus. Cell. 1987;51:919–928. doi: 10.1016/0092-8674(87)90579-4. [DOI] [PubMed] [Google Scholar]
- 3.Boland BJ, Silbert PL, Groover RV, Wollan PC, Silverstein MD. Skeletal, cardiac, and smooth muscle failure in Duchenne muscular dystrophy. Pediatr Neurol. 1996;14:7–12. doi: 10.1016/0887-8994(95)00251-0. [DOI] [PubMed] [Google Scholar]
- 4.Bushby K, Connor E. Clinical outcome measures for trials in Duchenne muscular dystrophy: report from International Working Group meetings. Clin Invest. 2011;1:1217–1235. doi: 10.4155/cli.11.113. [DOI] [PMC free article] [PubMed] [Google Scholar]
- 5.Mazzone E, Martinelli D, Berardinelli A, et al. North Star Ambulatory Assessment, 6-minute walk test and timed items in ambulant boys with Duchenne muscular dystrophy. Neuromuscul Disord. 2010;20:712–716. doi: 10.1016/j.nmd.2010.06.014. [DOI] [PubMed] [Google Scholar]
- 6.Mazzone ES, Messina S, Vasco G, et al. Reliability of the North Star Ambulatory Assessment in a multicentric setting. Neuromuscul Disord. 2009;19:458–461. doi: 10.1016/j.nmd.2009.06.368. [DOI] [PubMed] [Google Scholar]
- 7.McDonald CM, Henricson EK, Han JJ, et al. The 6-minute walk test as a new outcome measure in Duchenne muscular dystrophy. Muscle Nerve. 2010;41:500–510. doi: 10.1002/mus.21544. [DOI] [PubMed] [Google Scholar]
- 8.Wu JS, Darras BT, Rutkove SB. Assessing spinal muscular atrophy with quantitative ultrasound. Neurology. 2010;75:526–531. doi: 10.1212/WNL.0b013e3181eccf8f. [DOI] [PMC free article] [PubMed] [Google Scholar]
- 9.Zaidman CM, Connolly AM, Malkus EC, Florence JM, Pestronk A. Quantitative ultrasound using backscatter analysis in Duchenne and Becker muscular dystrophy. Neuromuscul Disord. 2010;20:805–809. doi: 10.1016/j.nmd.2010.06.019. [DOI] [PMC free article] [PubMed] [Google Scholar]
- 10.Jansen M, van Alfen N, Nijhuis van der Sanden MW, van Dijk JP, Pillen S, de Groot IJ. Quantitative muscle ultrasound is a promising longitudinal follow-up tool in Duchenne muscular dystrophy. Neuromuscul Disord. 2012;22:306–317. doi: 10.1016/j.nmd.2011.10.020. [DOI] [PubMed] [Google Scholar]
- 11.Bhansing KJ, Hoppenreijs EP, Janssen AJ, et al. Quantitative muscle ultrasound: a potential tool for assessment of disease activity in juvenile dermatomyositis. Scand J Rheumatol. 2014;43:339–341. doi: 10.3109/03009742.2013.879674. [DOI] [PubMed] [Google Scholar]
- 12.Bickerstaffe A, Beelen A, Zwarts MJ, Nollet F, van Dijk JP. Quantitative muscle ultrasound and quadriceps strength in patients with post-polio syndrome. Muscle Nerve. 2015;51:24–29. doi: 10.1002/mus.24272. [DOI] [PubMed] [Google Scholar]
- 13.Pillen S, Tak RO, Zwarts MJ, et al. Skeletal muscle ultrasound: correlation between fibrous tissue and echo intensity. Ultrasound Med Biol. 2009;35:443–446. doi: 10.1016/j.ultrasmedbio.2008.09.016. [DOI] [PubMed] [Google Scholar]
- 14.Canny J. A computational approach to edge detection. IEEE Trans Pattern Anal Mach Intell. 1986;8:679–698. [PubMed] [Google Scholar]
- 15.Gudmundsson M, El-Kwae EA, Kabuka MR. Edge detection in medical images using a genetic algorithm. IEEE Trans Med Imaging. 1998;17:469–474. doi: 10.1109/42.712136. [DOI] [PubMed] [Google Scholar]
- 16.Zwehl W, Levy R, Garcia E, et al. Validation of a computerized edge detection algorithm for quantitative two-dimensional echocardiography. Circulation. 1983;68:1127–1135. doi: 10.1161/01.cir.68.5.1127. [DOI] [PubMed] [Google Scholar]
- 17.Aarnink RG, Pathak SD, de la Rosette JJ, Debruyne FM, Kim Y, Wijkstra H. Edge detection in prostatic ultrasound images using integrated edge maps. Ultrasonics. 1998;36:635–642. doi: 10.1016/s0041-624x(97)00126-1. [DOI] [PubMed] [Google Scholar]
- 18.Hammoude A. Edge detection in ultrasound images based on differential tissue attenuation rates. Ultrason Imaging. 1999;21:31–42. doi: 10.1177/016173469902100103. [DOI] [PubMed] [Google Scholar]
- 19.Mahmoud A, Morsy A, de Groot E. A new gradient-based algorithm for edge detection in ultrasonic carotid artery images. Proceedings of the Annual International Conference of the IEEE Engineering in Medicine and Biology Society; Piscataway, NJ. Institute of Electrical and Electronics Engineers; 2010. pp. 5165–5168. [DOI] [PubMed] [Google Scholar]
- 20.Peters SA, den Ruijter HM, Palmer MK, et al. Manual or semi-automated edge detection of the maximal far wall common carotid intima-media thickness: a direct comparison. J Intern Med. 2012;271:247–256. doi: 10.1111/j.1365-2796.2011.02422.x. [DOI] [PubMed] [Google Scholar]
- 21.Chen CM, Lu HH, Han KC. A textural approach based on Gabor functions for texture edge detection in ultrasound images. Ultrasound Med Biol. 2001;27:515–534. doi: 10.1016/s0301-5629(00)00323-9. [DOI] [PubMed] [Google Scholar]
- 22.Hou ZJ, Wei GW. A new approach to edge detection. Pattern Recognit. 2002;35:1559–1570. [Google Scholar]
- 23.Zaidman CM, Wu JS, Wilder S, Darras BT, Rutkove SB. Minimal training is required to reliably perform quantitative ultrasound of muscle. Muscle Nerve. 2014;50:124–128. doi: 10.1002/mus.24117. [DOI] [PMC free article] [PubMed] [Google Scholar]
- 24.Rutkove SB, Geisbush TR, Mijailovic A, et al. Cross-sectional evaluation of electrical impedance myography and quantitative ultrasound for the assessment of Duchenne muscular dystrophy in a clinical trial setting. Pediatr Neurol. 2014;51:88–92. doi: 10.1016/j.pediatrneurol.2014.02.015. [DOI] [PMC free article] [PubMed] [Google Scholar]
- 25.Bushby K, Finkel R, Birnkrant DJ, et al. Diagnosis and management of Duchenne muscular dystrophy, part 1: diagnosis, and pharmacological and psychosocial management. Lancet Neurol. 2010;9:77–93. doi: 10.1016/S1474-4422(09)70271-6. [DOI] [PubMed] [Google Scholar]
- 26.Shklyar I, Geisbush TR, Mijialovic AS, et al. Quantitative muscle ultrasound in Duchenne muscular dystrophy: a comparison of techniques. Muscle Nerve. 2015;51:207–213. doi: 10.1002/mus.24296. [DOI] [PMC free article] [PubMed] [Google Scholar]
- 27.Schreiber A, Smith WL, Ionasescu V, et al. Magnetic resonance imaging of children with Duchenne muscular dystrophy. Pediatr Radiol. 1987;17:495–497. doi: 10.1007/BF02388288. [DOI] [PubMed] [Google Scholar]
- 28.Arai Y, Osawa M, Fukuyama Y. Muscle CT scans in preclinical cases of Duchenne and Becker muscular dystrophy. Brain Dev. 1995;17:95–103. doi: 10.1016/0387-7604(95)00006-w. [DOI] [PubMed] [Google Scholar]
- 29.Torriani M, Townsend E, Thomas BJ, Bredella MA, Ghomi RH, Tseng BS. Lower leg muscle involvement in Duchenne muscular dystrophy: an MR imaging and spectroscopy study. Skeletal Radiol. 2012;41:437–445. doi: 10.1007/s00256-011-1240-1. [DOI] [PMC free article] [PubMed] [Google Scholar]
- 30.Pillen S, van Alfen N, Sorenson EJ, et al. Assessing spinal muscular atrophy with quantitative ultrasound. Neurology. 2011;76:933–934. doi: 10.1212/WNL.0b013e3182068eed. [DOI] [PubMed] [Google Scholar]
- 31.Janssen BH, Pillen S, Voet NB, Heerschap A, van Engelen BG, van Alfen N. Quantitative muscle ultrasound versus quantitative MRI in facioscapulohumeral dystrophy. Muscle Nerve. 2014;50:968–975. doi: 10.1002/mus.24247. [DOI] [PubMed] [Google Scholar]


