

Abstract
Purpose
Age-related macular degeneration (AMD) is a progressive disease with multifactorial etiology. There is a need to identify clinical features that are harbingers of advanced disease. We evaluated morphologic features of the retina and choroid on optical coherence tomography (OCT) to determine if they predict progression to advanced disease.
Methods
Progressors transitioned from early or intermediate AMD to advanced disease (n = 40 eyes), and were matched on baseline AMD grade and follow-up interval to nonprogressors who did not develop advanced AMD (n = 40 eyes). Features of the neurosensory retina, photoreceptors, retinal pigment epithelium (RPE), and choroid were evaluated. Logistic regression was used to evaluate univariate associations between features and progression to overall advanced AMD, geographic atrophy (GA), and neovascular disease (NV). Multivariate associations based on stepwise regression models were also assessed.
Results
Ellipsoid zone disruption was associated with progression to overall advanced AMD and NV (odds ratios [ORs]: 17.9 and 30.6; P < 0.001), with a similar trend observed for GA. Drusenoid RPE detachment, RPE thickening, and retinal pigmentary hyperreflective material were significantly associated with higher risk of progression to advanced AMD (ORs: 5.0–8.5) and NV (ORs: 10.8–17.2). Pigmentary hyperreflective material was associated with progression to GA (OR: 7.5, P = 0.009). Total retinal thickness, pigmentary hyperreflective material, nascent GA features, and choroidal vessel abnormalities were independently associated with progression to advanced AMD in a multivariate stepwise model.
Conclusions
Abnormalities in the photoreceptors, retinal thickness, RPE, and choroid were associated with higher risk of developing advanced AMD. These findings provide insights into disease progression, and may be helpful to identify earlier endpoints for clinical studies.
Keywords: age-related macular degeneration, choroidal neovascularization, geographic atrophy, optical coherence tomography, progression
Age-related macular degeneration (AMD), the leading cause of irreversible loss of visual function in patients over age 60 in developed countries, is a multifactorial disease with both genetic and environmental risk factors.1–3 Manifestations of advanced AMD include neovascular disease (NV) and geographic atrophy (GA). Both are preceded by early and intermediate stages that are characterized by pigmentary abnormalities and drusen, although predictive morphologic features are not yet established and are worthy of investigation.
With the advancement of in vivo imaging, optical coherence tomography (OCT) is capable of noninvasive visualization of the retina and choroid that is close to histopathologic resolution, allowing for identification of disease biomarkers that surpass standard clinical investigation.4 Soft drusen in the macular area are a well-established clinical feature associated with AMD progression.5–7 OCT further refines disease risk assessment by revealing qualitative and quantitative imaging of the neurosensory retinal layers and retinal pigment epithelium (RPE) that are not readily appreciated on ophthalmologic examination.8 For example, drusen volume and their tomographic reflectivity were found to be associated with progression to advanced stages of AMD.9,10 Despite such advances, established OCT biomarkers cannot fully predict the timing or transition to advanced disease, or which presentation—NV or GA—a given eye will develop.
Although anti-vascular endothelial growth factor (VEGF) injections are available for patients with NV, these are not curative. No treatment is currently available for patients with GA. There is, therefore, an unmet need to identify robust biomarkers that could be used to monitor disease severity and assess risk of progression prior to the onset of advanced disease. In addition, it is still debatable whether NV and GA are distinct entities of different etiology. Mechanisms related to VEGF upregulation are involved in the development of NV, while VEGF dysregulation is associated with choriocapillaris degeneration and GA.11 Dysregulation of the alternative complement pathway has also been implicated in the development of both advanced presentations.12–14 These endpoints may, therefore, have overlapping disease mechanisms. Our study evaluates morphologic features of the retina and choroid on OCT that may be precursors of progression to overall advanced AMD, NV, and GA.
Methods
Study Population and Definition of Progression
All participants were enrolled in prospective epidemiologic studies of AMD beginning in 1988 (Ophthalmic Epidemiology and Genetics Service, Tufts Medical Center, Boston, MA, USA). Participants were derived from clinic populations and nationwide referrals and were prospectively followed. This research adhered to the tenets of the Declaration of Helsinki and was performed under approved institutional review board protocol. Written informed consent was obtained from all participants.
AMD stage was classified by clinical history, ocular examination, and all available imaging modalities, including color fundus photography, fundus autofluorescence, fluorescein angiography, and OCT. Fundus autofluorescence was particularly relevant to monitor GA, while fluorescein angiography was useful in monitoring NV. Grades were defined using the Clinical Age-Related Maculopathy Staging system: grade 1, no AMD (no drusen or a few small drusen < 63 μm); grade 2, early AMD (intermediate-size drusen 63–124 μm); grade 3, intermediate AMD (large drusen ≥ 125 μm); grade 4, GA (with or without foveal involvement); and grade 5, NV.15
The selection process for this study from our OCT cohort is outlined in Supplementary Figure S1. Participants were eligible for this study of AMD progression if they had spectral-domain OCT imaging (Cirrus; Carl Zeiss Meditec, Inc., Dublin, CA, USA) available for review (n = 573 participants) with at least one year of follow-up. The inclusion interval for this study was from 2009 to 2016. In this cohort, mean age was 77.1 ± 12.6 years and mean follow-up time was 9.1 ± 7.1 years. Eligible study eyes were classified as having either early or intermediate AMD at baseline with at least 12 months follow-up with high-quality OCT imaging. Participants without a confirmed diagnosis of AMD, advanced AMD in both eyes at baseline, poor image quality that could compromise the qualitative assessments, or less than 1 year of follow-up time after the baseline OCT scan were not eligible for inclusion. Scans with signal strength less than 7 were excluded due to poor quality as has been previously reported.16 Additional exclusion criteria included the presence of any concomitant feature that could compromise the assessment of imaging data or confound the interpretation of study results, such as ocular media opacity or retinal detachment. Fellow eyes of included participants could present with any AMD stage. A total of 302 participants were considered to be eligible based on these criteria.
Progressors (n = 40) transitioned from early or intermediate AMD to NV or GA in the study eye over the follow-up interval. Presence of NV and GA was determined by a combination of the clinical history and examination, as well as multimodal imaging including color fundus photography, fundus autofluorescence, fluorescein angiography, and OCT. Nonprogressors (n = 262) did not develop advanced AMD, and a subset of this group (n = 40) was matched on baseline AMD stage and follow-up interval to the progressor cohort in a 1-to-1 ratio for further systematic imaging analysis. Therefore, among 80 eyes in this study, there were 40 progressors to overall advanced AMD (20 each for NV and GA) and 40 matched nonprogressors.
Systematic Analysis of OCT Scans
A standardized grading form was used to systematically assess clinical features of interest in the retina and choroid on OCT. For progressors, cross-sectional, structural OCT scans were evaluated at baseline, annually, and at the last examination prior to development of advanced AMD. For nonprogressors, images were assessed at baseline, annually, and at the most recent exam.
The OCT scanning protocols included high-definition (HD) 1 Line scan, HD 5 Line scan, and macular cube over a 6- by 6-mm square. All available scans for each visit were systematically evaluated. Morphologic features of the neurosensory retina, RPE, and choroid were analyzed independently by two reading center–certified graders experienced in the analysis of OCT imaging (EAN and RNL). Both readers were masked to progression status. Disagreements were resolved by open adjudication with assistance from a senior grader (DF). Kappa statistics were calculated for each OCT feature in order to assess inter-grader reliability, and ranged from 0.82 to 0.97 for the 15 features evaluated.
In addition to the clinical examination and multimodal imaging assessment mentioned above, signs of NV on OCT included intraretinal or subretinal fluid with or without the presence of subretinal hyperreflective material, fibrovascular pigment epithelium detachment (PED) defined as an irregular PED of heterogeneous internal reflectivity correspondent to NV on multimodal imaging, or disciform scar. Signs of GA on OCT were loss of the full-thickness outer retina, including the following layers: outer nuclear layer (ONL), external limiting membrane (ELM), ellipsoid zone, photoreceptor outer segments, interdigitation zone, and RPE, associated with hypertransmission of OCT signal below Bruch's membrane.17
Inner and outer neurosensory retinal thicknesses were classified as preserved or abnormal, and were qualitatively evaluated based on the contour of the retinal architecture. Abnormal thickness was defined as focal irregularity (thickening or thinning) of a given retinal layer in comparison to adjacent areas throughout the cross-sectional OCT scan. The integrity of the ELM, ellipsoid zone, photoreceptor outer segments, interdigitation zone, and RPE was also assessed. Each layer was classified as preserved (rectilinear OCT signal of homogeneous reflectivity throughout the scan), irregular (misaligned OCT signal of heterogeneous reflectivity throughout the scan), or disrupted (optically empty spaces at the level of a given layer and OCT signal of markedly heterogeneous reflectivity throughout the scan). The RPE was also considered disrupted if hypertransmission of OCT signal below Bruch's membrane was present.
Other distinct outer retinal abnormalities were also assessed. Presence of pigmentary hyperreflective material through the neurosensory retina was evaluated as previously described, representing migration of the RPE.18 Focal thickening of the RPE layer on OCT corresponded clinically to focal hyperpigmentation. Drusenoid PEDs were defined by voluminous confluent soft drusen detaching the RPE.
Subsidence of the outer plexiform layer (OPL) and inner nuclear layer (INL) and the presence of a hyporeflective wedge-shaped band within the limits of the ONL were classified as present or absent, and were evaluated using previously defined criteria.17 These features were recently characterized as “nascent GA”.17 Other features typically associated with subsidence of the INL and OPL include abnormality of the ELM, disruption of the ellipsoid zone and RPE, and traces of hypertransmission of OCT signal below Bruch's membrane.
The choroidal vessels were qualitatively evaluated as preserved or irregular, based on the gross appearance of each layer throughout the cross-sectional OCT scan. Subfoveal choroidal thickness, defined as the distance between Bruch's membrane and the choroidal–scleral interface, was also measured with the OCT built-in measurement tool. The mean value obtained by the two assessors for each eye at each visit was analyzed. Mean subfoveal choroidal thickness for progressors and nonprogressors was ranked into quintiles according to the mean value prior to progression, with quintiles 2 through 4 and quintile 5 compared separately to the first quintile.
Statistical Analysis
Analyses of OCT features were based on individual eyes. Presence of each feature at multiple time points was evaluated prior to the development of advanced AMD in each subgroup: overall advanced AMD (either NV or GA combined), and NV or GA separately.
Univariate associations with progression to overall advanced AMD, NV, and GA were evaluated. Exact logistic regression models were used to estimate the associations between each OCT feature and progression to each of the three endpoints. Odds ratios (ORs) and 95% confidence intervals (CIs) were obtained, and were adjusted for age and sex. A permutation test P value was obtained using PROC MULTTEST with the Cochran-Armitage test option. The permutation test was conducted with adjustment for age–sex groups that were defined as follows: (1) male, age < median (75.94 years for overall advanced AMD); (2) male, age ≥ median; (3) female, age < median; and (4) female, age ≥ median.
In order to evaluate the multivariate associations between all OCT features and AMD progression, we combined individual features into composite feature groups, including (1) total retinal thickness; (2) photoreceptor layer; (3) features of nascent GA; (4) and RPE abnormalities. Total retinal thickness was considered preserved if both the inner and outer retinal layers were preserved, and was considered abnormal otherwise. The photoreceptor layer was evaluated based on the status of the ellipsoid zone, photoreceptor outer segments, and interdigitation zone, and was considered preserved only if all three variables were evaluated as preserved. The three features indicative of nascent GA (hyporeflective wedge-shaped band, subsidence of the OPL and INL) were combined. Nascent GA was considered absent only if all three distinct features were absent. Two RPE variables (RPE thickening and integrity of the RPE layer) were also combined. RPE abnormalities were considered absent if both variables were absent, and were considered present otherwise. For mean subfoveal thickness, quintiles 2 through 5 were considered together and were compared to quintile 1. The original variables for the ELM, drusenoid PED, pigmentary hyperreflective material, and choroidal abnormalities were retained for use in these analyses.
A multivariate model containing all features was assessed after adjustment for age and sex, and the STEPWISE selection option of PROC LOGISTIC was used to determine the features most predictive of progression to each advanced outcome, with P < 0.05 for a feature to enter the model and P < 0.10 to remain in the model. All nine features were considered together in one analysis and were subsequently included or not included in the final model. All statistical analyses were performed using SAS version 9.4 (SAS Institute, Inc., Cary, NC, USA). A P value < 0.05 was considered statistically significant.
Results
The mean age for the progressors was 76.2 years and was 74.1 years for the nonprogressors. The mean follow-up times for progressors and nonprogressors were 5.2 and 5.6 years, respectively. The distribution of each OCT feature during early and intermediate AMD stages for all progressors and nonprogressors is presented in Table 1. The univariate associations of these features with progression to overall advanced AMD, NV, and GA are also displayed. Progressors to overall advanced AMD tended to have abnormal outer (P < 0.001) and inner (P = 0.008) retinal thickness, irregularity or disruption of the ELM (P = 0.001), a drusenoid PED (P < 0.001), thickening of the RPE (P = 0.001), pigmentary hyperreflective material (P < 0.001), features of nascent GA (including presence of the hyporeflective wedge-shaped band, subsidence of the OPL, subsidence of the INL, P values from 0.007 to <0.001), and irregularities of the choroidal vessels (P < 0.001). Irregularity or disruption of the photoreceptor outer segments, interdigitation zone, and RPE layer was not associated with progression to overall advanced AMD.
Table 1.
Associations Between OCT Retinal and Choroidal Features and Progression to Overall Advanced AMD, NV, and GA

Similar results were observed in separate analyses of the NV and GA subgroups, with some differences existing between the two. Among eyes that eventually progressed to NV, there was a higher likelihood of irregularity or disruption of the ellipsoid zone (P < 0.001), presence of drusenoid PED (P < 0.001), and thickening of the RPE (P = 0.003). These features were not significantly associated with GA. Abnormal inner retinal thickness (P = 0.02), subsidence of the OPL (P < 0.001), and subsidence of the INL (P < 0.001) were significantly associated with progression to GA, but not to NV. All other OCT features evaluated did not differ between the two advanced AMD presentations.
Mean subfoveal choroidal thickness was significantly thinner among progressors to NV compared to nonprogressors (170.3 vs. 221.8 μm; P = 0.03). The difference in thickness was not as large for overall advanced AMD (200.2 vs. 234.0 μm; P = 0.11) and GA (230.1 vs. 246.2 μm; P = 0.50) for progressors and nonprogressors, respectively, although a protective effect was suggested for comparisons of quintiles 2 through 4 to quintile 1 for overall advanced AMD (OR: 0.3; P = 0.05). Similar trends were observed for NV and GA, but were not statistically significant.
The evaluation of combined OCT retinal and choroidal features revealed similar associations with progression. Results for overall advanced AMD are presented in Table 2. For this endpoint, abnormal total retinal thickness was associated with higher odds of disease progression, as were irregularity or disruption of the ELM, drusenoid PED, retinal pigmentary hyperreflective material, features of nascent GA, and choroidal vessel abnormalities (all P < 0.001). A suggestive result of reduced mean subfoveal choroidal thickness for progressors versus nonprogressors was observed in a comparison of the second through fifth quintiles to the first (OR: 0.3; 95% CI: 0.1–1.1; P = 0.06). A multivariate stepwise model of progression identified four features that were significantly associated with progression to overall advanced AMD. Abnormal total retinal thickness (OR: 5.0; 95% CI: 1.0–24.9; P = 0.05), pigmentary hyperreflective material (OR: 5.0; 95% CI: 1.0–24.4; P = 0.05), features of nascent GA (OR: 5.2; 95% CI: 1.2–22.8; P = 0.03), and irregularities of the choroidal vessels (OR: 6.1; 95% CI: 1.5–25.6; P = 0.01) were associated with a higher risk of progression compared to the reference categories for each variable. These multivariate associations are illustrated in Figure 1.
Table 2.
Associations Between Combined OCT Retinal and Choroidal Features and Progression to Overall Advanced AMD
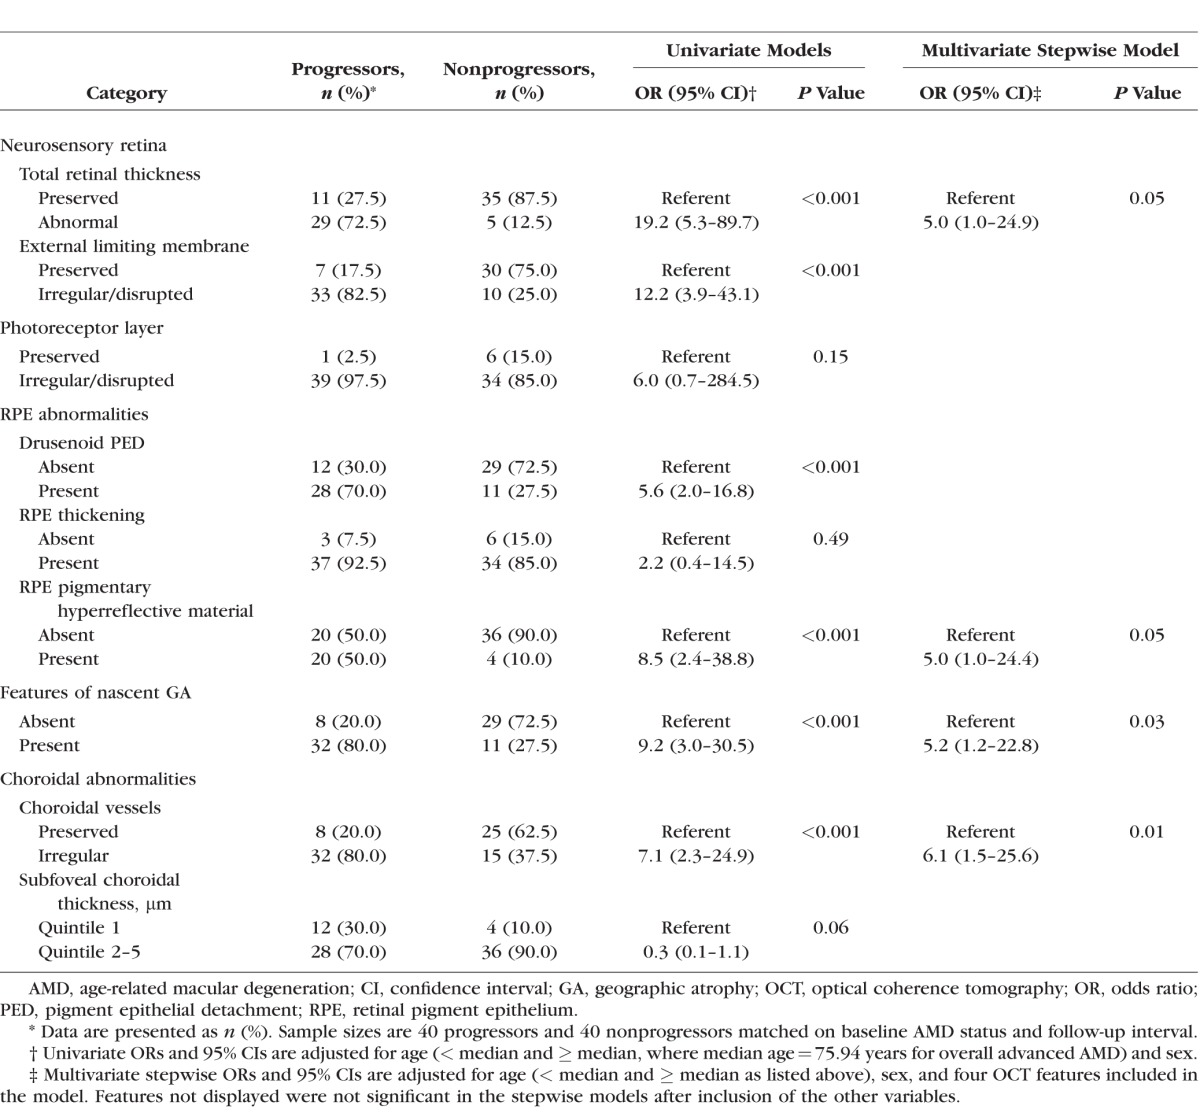
Figure 1.

Retinal and choroidal features associated with progression to overall advanced age-related macular degeneration. The forest plot displays four optical coherence tomography (OCT) features that were significantly associated with progression to advanced age-related macular degeneration based on multivariate stepwise models. Odds ratios (ORs) and 95% confidence intervals (CIs) are presented for retinal thickness abnormalities, retinal pigment epithelial (RPE) pigmentary hyperreflective material, features of nascent geographic atrophy (GA), and choroidal abnormalities.
Progression to the distinct NV and GA presentations was also evaluated, and results are shown in Table 3. Presence of a drusenoid PED was significantly associated with NV only (P < 0.001). Combined features of nascent GA were significantly associated with progression to GA (P < 0.001), but did reveal a suggestive result for NV (P = 0.07). The separate stepwise models for NV and GA ultimately identified one feature for each presentation: total retinal thickness (P = 0.002) and the combined features of nascent GA (P = 0.001), respectively. Results for the separate analyses of each advanced presentation should be interpreted with caution given the small sample sizes.
Table 3.
Associations Between Combined OCT Retinal and Choroidal Features and Progression to NV and GA

Representative features are illustrated in eyes that developed advanced AMD over time. Figure 2 shows progression from intermediate AMD to NV within 2 years with pigmentary clumping evident on OCT. In Figure 3, the left eye developed NV after 2 years and was treated with three anti-VEGF injections. Three years later, RPE atrophy developed with no residual signs of NV or fibrovascular tissue. Figure 4 shows progression from early AMD to GA within 4 years. Ellipsoid zone irregularities and pigmentary mobilization were observed on OCT prior to progression. Figure 5 shows progression from intermediate AMD to GA within 5 years. Pigmentary hyperreflective material, ellipsoid zone irregularities, and ONL thinning on OCT preceded the development of GA.
Figure 2.

Progression from intermediate age-related macular degeneration to neovascular disease. Baseline color fundus photograph (A) and optical coherence tomography (OCT) (C) show confluent drusen and drusenoid retinal pigment epithelial detachment that evolve to neovascular disease (NV) (B, D). Pigmentary clumping was evident from baseline through progression to NV (arrows in A, B, D).
Figure 3.

Progression from intermediate age-related macular degeneration to neovascular disease and eventually evolving to atrophy of the retinal pigment epithelium. Baseline color fundus photograph (A) and optical coherence tomography (OCT) (D) show confluent drusen, drusenoid retinal pigment epithelial (RPE) detachment, and pigmentary clumping ([A] arrow). This appears as pigmentary hyperreflective material on OCT ([D] arrow). Two years later, neovascularization developed with subretinal hemorrhage evident on color photograph (B) and intraretinal fluid on OCT (E). This eye was treated with three anti-vascular endothelial growth factor injections. Three years later (C, F), RPE atrophy evolved with no residual signs of neovascularization or fibrovascular tissue. Figure insert (C) shows fundus autofluorescence imaging clearly documenting the area of RPE atrophy.
Figure 4.

Progression from early age-related macular degeneration to geographic atrophy. At baseline (A, D), ellipsoid zone irregularities and drusen are documented, with relatively preserved outer nuclear layer (ONL) thickness ([D] arrow). One year later (B, E), mild pigmentary mobilization is evident in the macula ([B] arrow), while optical coherence tomography (OCT) shows thinning of the ONL and worsening of ellipsoid zone irregularities ([E] arrow) with pigmentary mobilization. Three years later, disruption of the ellipsoid zone was associated with focal patch of geographic atrophy ([C] arrow), defined on OCT by loss of full-thickness outer retina, including ONL, external limiting membrane, ellipsoid zone, photoreceptor outer segments, interdigitation zone, and retinal pigment epithelium, associated with hypertransmission of OCT signal below Bruch's membrane ([F] arrow).
Figure 5.

Progression from intermediate age-related macular degeneration to geographic atrophy. At baseline (A, C), optical coherence tomography (OCT) shows pigmentary hyperreflective material ([C] arrow), retinal pigment epithelial split, and ellipsoid zone irregularities. Two years later (D), outer nuclear layer (ONL) thinning is evident. One year later (E), ONL thinning progresses while OCT signs of geographic atrophy (GA) become more evident with hypertransmission. Three years later (B, F), a large GA lesion (dashed line) is characterized by the hypertransmission sign on OCT ([F] arrow).
Discussion
Our study of OCT features among AMD progressors and nonprogressors suggests that abnormalities at the level of the photoreceptors, particularly the ellipsoid zone, were associated with higher risk of progression to overall advanced AMD as well as NV and GA separately. These results indicate that early anatomic changes occur at the level of the photoreceptors in eyes that will eventually progress to advanced disease. Of note, photoreceptor dysfunction has been previously described in intermediate AMD and nascent GA, as assessed by low-luminance visual acuity and microperimetry.19 It has also been identified in clinically preserved macular areas in the topography of quiescent NV20 or surrounding overt GA lesions.21,22 Prior evidence of early photoreceptor dysfunction in the course and progression of AMD is in alignment with our anatomic findings.
In addition, many of our findings were similar for NV and GA, suggesting that these clinical manifestations may have similar disease mechanisms. Both NV and GA coexist in a large proportion of advanced AMD cases, as revealed by recent advances in ocular fundus imaging.23–26 Furthermore, AMD genes to date are associated with both presentations, with only a few sharing stronger associations for one advanced subtype.2,12,13,27
Total retinal thickness and RPE abnormalities, including pigmentary hyperreflective material, were also associated with a higher likelihood of progression to advanced disease. In addition, OCT features characterizing “nascent GA”17 were related to progression to overall advanced AMD. These features, including the presence of a hyporeflective wedge-shaped band within the limits of the ONL and subsidence of the OPL and INL, also preceded progression to GA. At present, the definition of GA is based on variable imaging modalities and generally denotes complete loss of the photoreceptors, RPE, and choriocapillaris. One may speculate whether “nascent GA” is still in fact a manifestation of intermediate AMD, or if the onset of advanced disease has already occurred and cell loss toward overt GA is irreversible.19
Choroidal abnormalities, as assessed by preservation or irregularity of the choroidal vessels, also appeared to be associated with progression, independent of other features. The mean subfoveal choroidal measurements were lower (thinner) among progressors to NV compared to nonprogressors. However, when comparing the thinnest versus upper quintiles of this measurement, choroidal thickness was suggestive but not a significant predictor. There is a recognized limitation in assessing the choroidal vasculature using only structural, cross-sectional OCT.28 Superior in vivo imaging of the choriocapillaris has been achieved with OCT angiography, while medium and large choroidal vessels are better appreciated using structural en face OCT.28
Extensive choriocapillaris loss was recently described in postmortem eyes with clinically documented NV and GA.29 Choriocapillaris attenuation progressed with AMD severity, and loss was observed even in early and intermediate AMD stages.29 Previous histologic studies have reported choriocapillaris loss underlying drusen, occurring very early in disease pathogenesis,30,31 as well as reduced choroidal vessel density and diameter with advanced AMD.32–34 Prior studies also reveal discordant results in evaluating the relationship between subfoveal choroidal thickness and advanced AMD. This inconsistency may be explained by the wide variability of choroidal morphology and limitations of the qualitative and quantitative choroidal assessment on standard cross-sectional OCT.28 The evaluation of reticular pseudodrusen was limited in this study, and no definitive conclusions related to this feature could be made. Reticular pseudodrusen correspond to subretinal drusenoid deposits characterized on histopathology, and have been associated with advanced AMD.35
Strengths of our study include the well-characterized and longstanding cohort with comprehensive imaging and clinical data allowing for the assessment of tomographic features associated with higher risk of progression over several years. The availability of such a resource allowed for the evaluation of a relatively large number of eyes that eventually progressed to advanced disease in comparison to eyes with the same baseline AMD status that did not progress during the same follow-up interval. The systematic evaluation of OCT features by experienced assessors enhanced reliability and reproducibility of the results.
In summary, our study evaluated clinical OCT features in early and intermediate AMD eyes in order to identify biomarkers associated with a higher risk of progression to advanced disease. Results indicate that there are early anatomic changes in the retina, RPE, and choroid seen on OCT that are indicators of future progression to advanced AMD, including both NV and GA. These findings provide insights into AMD progression, and may also be valuable when considering earlier anatomic endpoints for clinical studies.
Supplementary Material
Acknowledgments
The authors thank Jay Duker, MD, Department of Ophthalmology, Tufts University School of Medicine, for his helpful suggestions. They also thank Bernard Rosner, PhD, Channing Division of Network Medicine, Harvard Medical School, for his assistance with statistical programming and analyses.
Supported by Grant R01-EY011309 from the National Institutes of Health; the Massachusetts Lions Eye Research Fund, Inc., New Bedford, MA, USA; the International Retinal Research Foundation, Inc., Birmingham, AL, USA; the American Macular Degeneration Foundation, Northampton, MA, USA; and the Age-Related Macular Degeneration Research Fund, Ophthalmic Epidemiology and Genetics Service, Tufts Medical Center, Tufts University School of Medicine, Boston, MA, USA (JMS). RNL and EAN were supported by CAPES Foundation, Ministry of Education of Brazil, Brasilia, DF, Brazil.
Disclosure: D. Ferrara, Roche (I), Genentech, Inc. (E); R.E. Silver, None; R.N. Louzada, None; E.A. Novais, None; G.K. Collins, None; J.M. Seddon, Novartis (F), Apellis (C)
References
- 1. Lim LS,, Mitchell P,, Seddon JM,, Holz FG,, Wong TY. Age-related macular degeneration. Lancet. 2012; 379: 1728–1738. [DOI] [PubMed] [Google Scholar]
- 2. Sobrin L,, Seddon JM. Nature and nurture- genes and environment- predict onset and progression of macular degeneration. Prog Retin Eye Res. 2014; 40: 1–15. [DOI] [PMC free article] [PubMed] [Google Scholar]
- 3. Friedman DS,, O'Colmain BJ,, Munoz B,, et al. Prevalence of age-related macular degeneration in the United States. Arch Ophthalmol. 2004; 122: 564–572. [DOI] [PubMed] [Google Scholar]
- 4. Chen TC,, Cense B,, Pierce MC,, et al. Spectral domain optical coherence tomography: ultra-high speed, ultra-high resolution ophthalmic imaging. Arch Ophthalmol. 2005; 123: 1715–1720. [DOI] [PubMed] [Google Scholar]
- 5. Cukras C,, Agron E,, Klein ML,, et al. Natural history of drusenoid pigment epithelial detachment in age-related macular degeneration: Age-Related Eye Disease Study Report No. 28. Ophthalmology. 2010; 117: 489–499. [DOI] [PMC free article] [PubMed] [Google Scholar]
- 6. Klein ML,, Ferris FL, III,, Armstrong J,, et al. Retinal precursors and the development of geographic atrophy in age-related macular degeneration. Ophthalmology. 2008; 115: 1026–1031. [DOI] [PubMed] [Google Scholar]
- 7. Shim SH,, Kim SG,, Bae JH,, Yu HG,, Song SJ. Risk factors for progression of early age-related macular degeneration in Koreans. Ophthalmic Epidemiol. 2016; 23: 80–87. [DOI] [PubMed] [Google Scholar]
- 8. Abdelfattah NS,, Zhang H,, Boyer DS,, et al. Drusen volume as a predictor of disease progression in patients with late age-related macular degeneration in the fellow eye. Invest Ophthalmol Vis Sci. 2016; 57: 1839–1846. [DOI] [PubMed] [Google Scholar]
- 9. Folgar FA,, Yuan EL,, Sevilla MB,, et al. Drusen volume and retinal pigment epithelium abnormal thinning volume predict 2-year progression of age-related macular degeneration. Ophthalmology. 2016; 123: 39–50. [DOI] [PubMed] [Google Scholar]
- 10. Veerappan M,, El-Hage-Sleiman AM,, Tai V,, et al. Optical coherence tomography reflective drusen substructures predict progression to geographic atrophy in age-related macular degeneration. Ophthalmology. 2016; 123: 2554–2570. [DOI] [PMC free article] [PubMed] [Google Scholar]
- 11. Keir LS,, Firth R,, Aponik L,, et al. VEGF regulates local inhibitory complement proteins in the eye and kidney. J Clin Invest. 2017; 127: 199–214. [DOI] [PMC free article] [PubMed] [Google Scholar]
- 12. Fritsche LG,, Igl W,, Bailey JN,, et al. A large genome-wide association study of age-related macular degeneration highlights contributions of rare and common variants. Nat Genet. 2016; 48: 134–143. [DOI] [PMC free article] [PubMed] [Google Scholar]
- 13. Seddon JM,, Francis PJ,, George S,, Schultz DW,, Rosner B,, Klein ML. Association of CFH Y402H and LOC387715 A69S with progression of age-related macular degeneration. JAMA. 2007; 297: 1793–1800. [DOI] [PubMed] [Google Scholar]
- 14. Sobrin L,, Ripke S,, Yu Y,, et al. Heritability and genome-wide association study to assess genetic differences between advanced age-related macular degeneration subtypes. Ophthalmology. 2012; 119: 1874–1885. [DOI] [PMC free article] [PubMed] [Google Scholar]
- 15. Seddon JM,, Sharma S,, Adelman RA. Evaluation of the clinical age-related maculopathy staging system. Ophthalmology. 2006; 113: 260–266. [DOI] [PubMed] [Google Scholar]
- 16. Yehoshua Z,, Rosenfeld PJ,, Gregori G,, et al. Progression of geographic atrophy in age-related macular degeneration imaged with spectral domain optical coherence tomography. Ophthalmology. 2011; 118: 679–686. [DOI] [PMC free article] [PubMed] [Google Scholar]
- 17. Wu Z,, Luu CD,, Ayton LN,, et al. Optical coherence tomography-defined changes preceding the development of drusen-associated atrophy in age-related macular degeneration. Ophthalmology. 2014; 121: 2415–2422. [DOI] [PubMed] [Google Scholar]
- 18. Willoughby AS,, Ying GS,, Toth CA,, et al. Subretinal hyperreflective material in the Comparison of Age-Related Macular Degeneration Treatments Trials. Ophthalmology. 2015; 122: 1846–1853. [DOI] [PMC free article] [PubMed] [Google Scholar]
- 19. Wu Z,, Ayton LN,, Luu CD,, Guymer RH. Microperimetry of nascent geographic atrophy in age-related macular degeneration. Invest Ophthalmol Vis Sci. 2014; 56: 115–121. [DOI] [PubMed] [Google Scholar]
- 20. Querques G,, Srour M,, Massamba N,, et al. Functional characterization and multimodal imaging of treatment-naive “quiescent” choroidal neovascularization. Invest Ophthalmol Vis Sci. 2013; 54: 6886–6892. [DOI] [PubMed] [Google Scholar]
- 21. Pilotto E,, Convento E,, Guidolin F,, et al. Microperimetry features of geographic atrophy identified with en face optical coherence tomography. JAMA Ophthalmol. 2016; 134: 873–879. [DOI] [PubMed] [Google Scholar]
- 22. Takahashi A,, Ooto S,, Yamashiro K,, et al. Photoreceptor damage and reduction of retinal sensitivity surrounding geographic atrophy in age-related macular degeneration. Am J Ophthalmol. 2016; 168: 260–268. [DOI] [PubMed] [Google Scholar]
- 23. Bhisitkul RB,, Mendes TS,, Rofagha S,, et al. Macular atrophy progression and 7-year vision outcomes in subjects from the ANCHOR, MARINA, and HORIZON studies: the SEVEN-UP study. Am J Ophthalmol. 2015; 159: 915–924. [DOI] [PubMed] [Google Scholar]
- 24. Daniel E,, Shaffer J,, Ying GS,, et al. Outcomes in eyes with retinal angiomatous proliferation in the Comparison of Age-Related Macular Degeneration Treatments Trials (CATT). Ophthalmology. 2016; 123: 609–616. [DOI] [PMC free article] [PubMed] [Google Scholar]
- 25. Kaszubski P,, Ben Ami T,, Saade C,, Smith RT. Geographic atrophy and choroidal neovascularization in the same eye: a review. Ophthalmic Res. 2016; 55: 185–193. [DOI] [PMC free article] [PubMed] [Google Scholar]
- 26. Saade C,, Ganti B,, Marmor M,, Freund KB,, Smith RT. Risk characteristics of the combined geographic atrophy and choroidal neovascularisation phenotype in age-related macular degeneration. Br J Ophthalmol. 2014; 98: 1729–1732. [DOI] [PMC free article] [PubMed] [Google Scholar]
- 27. Yu Y,, Reynolds R,, Rosner B,, Daly MJ,, Seddon JM. Prospective assessment of genetic effects on progression to different stages of age-related macular degeneration using multistate Markov models. Invest Ophthalmol Vis Sci. 2012; 53: 1548–1556. [DOI] [PMC free article] [PubMed] [Google Scholar]
- 28. Ferrara D,, Waheed NK,, Duker JS. Investigating the choriocapillaris and choroidal vasculature with new optical coherence tomography technologies. Prog Retin Eye Res. 2016; 52: 130–155. [DOI] [PubMed] [Google Scholar]
- 29. Seddon JM,, McLeod DS,, Bhutto IA,, et al. Histopathological insights into choroidal vascular loss in clinically documented cases of age-related macular degeneration. JAMA Ophthalmol. 2016; 134: 1272–1280. [DOI] [PMC free article] [PubMed] [Google Scholar]
- 30. Mullins RF,, Johnson MN,, Faidley EA,, Skeie JM,, Huang J. Choriocapillaris vascular dropout related to density of drusen in human eyes with early age-related macular degeneration. Invest Ophthalmol Vis Sci. 2011; 52: 1606–1612. [DOI] [PMC free article] [PubMed] [Google Scholar]
- 31. Whitmore SS,, Sohn EH,, Chirco KR,, et al. Complement activation and choriocapillaris loss in early AMD: implications for pathophysiology and therapy. Prog Retin Eye Res. 2015; 45: 1–29. [DOI] [PMC free article] [PubMed] [Google Scholar]
- 32. Lutty G,, Grunwald J,, Majji AB,, Uyama M,, Yoneya S. Changes in choriocapillaris and retinal pigment epithelium in age-related macular degeneration. Mol Vis. 1999; 5: 35. [PubMed] [Google Scholar]
- 33. McLeod DS,, Grebe R,, Bhutto I,, Merges C,, Baba T,, Lutty GA. Relationship between RPE and choriocapillaris in age-related macular degeneration. Invest Ophthalmol Vis Sci. 2009; 50: 4982–4991. [DOI] [PMC free article] [PubMed] [Google Scholar]
- 34. Ramrattan RS,, van der Schaft TL,, Mooy CM,, de Bruijn WC,, Mulder PG,, de Jong PT. Morphometric analysis of Bruch's membrane, the choriocapillaris, and the choroid in aging. Invest Ophthalmol Vis Sci. 1994; 35: 2857–2864. [PubMed] [Google Scholar]
- 35. Schmitz-Valckenberg S,, Alten F,, Steinberg JS,, et al. Reticular drusen associated with geographic atrophy in age-related macular degeneration. Invest Ophthalmol Vis Sci. 2011; 52: 5009–5015. [DOI] [PubMed] [Google Scholar]
Associated Data
This section collects any data citations, data availability statements, or supplementary materials included in this article.