

Abstract
Background
China is faced with a daunting challenge to equality and efficiency in health resources allocation and health services utilization in the context of rapid economic growth. This study sought to evaluate the equality and efficiency of health resources allocation and health services utilization in China.
Methods
Demographic, economic, and geographic area data was sourced from China Statistical Yearbook 2012–2016. Data related to health resources and health services was obtained from China Health Statistics Yearbook 2012–2016. Furthermore, we evaluated the equality of health resources allocation based on Gini coefficient. Concentration index was used to measure the equality in utilization of health services. Data envelopment analysis (DEA) was employed to assess the efficiency of health resources allocation.
Results
From 2011 to 2015, the Gini coefficients for health resources by population ranged between 0.0644 and 0.1879, while the Gini coefficients for the resources by geographic area ranged from 0.6136 to 0.6568. Meanwhile, the concentration index values for health services utilization ranged from −0.0392 to 0.2110. Moreover, in 2015, 10 provinces (32.26%) were relatively efficient in terms of health resources allocation, while 7 provinces (22.58%) and 14 provinces (45.16%) were weakly efficient and inefficient, respectively.
Conclusions
There exist distinct regional disparities in the distribution of health resources in China, which are mainly reflected in the geographic distribution of health resources. Furthermore, the people living in the eastern developed areas are more likely to use outpatient care, while the people living in western underdeveloped areas are more likely to use inpatient care. Moreover, the efficiency of health resources allocation in 21 provinces (67.74%) of China was low and needs to be improved. Thus, the government should pay more attention to the equality based on geographic area, guide patients to choose medical treatment rationally, and optimize the resource investments for different provinces.
Keywords: Equality, Efficiency, Health resources allocation, Health services utilization, China
Background
Equality and efficiency in health resources allocation and health services utilization are important goals pursued by health policy makers and health systems [1]. Moreover, equitable and efficient allocation of health resources is one of the basic conditions to the sustainable development of health services. The degree of attention to the equality and efficiency of health resources allocation and health services utilization issues continues to improve, but very few researchers have been undertaken into regional disparities and inefficiency of health resources allocation and health services utilization in China [2–4].
China is faced with a daunting challenge to equality and efficiency in health resources allocation and health services utilization in the context of rapid economic growth [5]. Due to the differences in economic development among the eastern, central and western regions, the health resources allocation and health services utilization in China is inequitable and inefficient [3, 6]. Compared with the developed eastern region, the central and western regions are economically underdeveloped. The eastern region has adequate health resources, whilst the central and western regions lack high-quality health resources. Additionally, the high cost of medical care services hinders the access to health services for poorer populations. In this paper, Gini coefficient was employed to evaluate the equality of health resources allocation from 2011 to 2015, concentration index was used to measure the equality in utilization of health services at the same time, and data envelopment analysis (DEA) was used to assess the efficiency of health resources allocation in the 31 provinces of China (excluding Hong Kong, Macao, and Taiwan) in 2015. The results of this study could shed light on the future health resources allocation and health services development in China.
Methods
Data sources and statistical analysis
Demographic, economic, and geographic area data was sourced from China Statistical Yearbook 2012–2016 [7–11]. Data related to health resources and health services was obtained from China Health Statistics Yearbook 2012–2016 [12–16].
Microsoft Excel 2013 was employed to calculate the Gini coefficient as well as concentration index and draw figures, and DEAP (V2.1) was used to conduct data envelopment analysis.
Gini coefficient
Because the Gini coefficient has been identified as superior tool for evaluating the equality of health resources allocation [17], we employed it to examine the equality of health resources allocation (including health care institutions, health care beds and health workers) among provinces. It is derived from the Lorenz curve, reflecting the ratio of the area between the curve and the diagonal line, to the whole area below the 45。 line. The following formula was employed to calculate the Gini coefficient:
[18],
where Wi is the cumulative proportion of the population or geographic area in each group; Yi is the cumulative proportion of the health resources in each group; Vi = Y1 + Y2 + ……Yi; i is the fractional rank in terms of per capita health resources from the lowest number to the highest number.
The Gini coefficient ranges from 0 to 1; higher Gini coefficient indicates greater inequalities; a value of less than 0.2 suggests low inequality; a value of between 0.2 and 0.3 suggests moderate inequality; a value of between 0.3 and 0.4 suggests high inequality; a value of higher than 0.4 indicates extreme inequality [17, 19–26].
Concentration index
As the concentration index has been identified as superior tool to measure the equality of health services utilization [17], we employed it to measure the equality of health services utilization (including outpatient visits, inpatients visits, and bed utilization rate) among provinces. We employed the following formula to calculate the concentration index:
where Y0 is 0 and X0 is 0; Yi is the cumulative proportion of health services in each group, Xi is the cumulative proportion of population in each group, and i is the fractional rank according to per capita GDP beginning with the lowest; CI represents the concentration index [27, 28].
The concentration index ranges from −1 to +1; the greater the absolute value of concentration index, the greater the degree of inequalities; a value of 0 indicates absolute equality; a negative value indicates a concentration of the health service on the poorer populations; a positive value indicates a concentration of the service on the richer populations [24].
Data envelopment analysis
Data envelopment analysis (DEA), first developed by Charnes et al. in 1978, is a non-parametric mathematical programming methodology that has been widely used to measure the relative efficiency or performance of decision-making units (DMUs) [29, 30]. In this study, we considered every province as an analytical unit. The Charnes, Cooper, and Rhodes (CCR) model, as the model of DEA, assumes that production is constant return to scale (CRS), which means that an increase in the inputs will lead to a proportionate increase in the outputs, and measure the overall efficiency (OE) and slack variables of each province [29]. The slack variable refers to the slack values of each province in terms of health resources allocation [29]. When the OE is 1, and all the slack variables are 0, the province is said to be relatively efficient [31]. When the technical efficiency (TE) is 1, and the scale efficiency (SE) and OE are less than 1, and all the slack variables are 0, the province is weakly efficient [32]. When the OE ranges from 0 to 1, and not all the slack variables are 0, the province is inefficient [32]. Moreover, the Banker, Charnes, Cooper (BCC) model assumes that the production is variable return to scale (VRS), which indicates that an increase in the inputs will lead to either an increase or a decrease in the outputs, and divide the OE into the TE and SE of each province [33–37].
The CCR model and BCC model out of DEA models have been identified as superior tools for measuring the relative efficiency of health resources allocation [19], so we employed them to evaluate the relative efficiency of health resources allocation in the 31 provinces of China in 2015. The number of health care institutions, the number of health care beds and the number of health workers were selected as inputs; the number of outpatient visits, the number of inpatient visits and bed utilization rate were selected as outputs.
Results
Health resources and health services in China from 2011 to 2015
Table 1 showed the health resources and health services in China from 2011 to 2015. Totally, the number of the three health resources had been increasing from 2011 to 2015. Both the number of outpatient visits and the number of inpatient visits were increased at the same time, whereas the bed utilization rate decreased from 88.5% in 2011 to 85.4% in 2015.
Table 1.
Health resources and health services in China from 2011 to 2015
| Year | Input | Output | ||||
|---|---|---|---|---|---|---|
| Health care institutions (unit) |
Health care beds (unit) |
Health workers (individuals) |
Outpatient visits (times) |
Inpatient visits (times) |
Bed utilization rate(%) | |
| 2011 | 954,389 | 5,159,889 | 8,606,040 | 2,258,837,284 | 152,976,533 | 88.5 |
| 2012 | 950,397 | 5,724,775 | 9,108,705 | 2,541,616,095 | 178,570,984 | 90.1 |
| 2013 | 974,398 | 6,181,891 | 9,780,483 | 2,741,776,872 | 192,154,557 | 89.0 |
| 2014 | 981,432 | 6,601,214 | 10,224,213 | 2,972,069,922 | 204,411,818 | 88.0 |
| 2015 | 983,528 | 7,015,214 | 10,683,881 | 3,083,640,862 | 210,537,715 | 85.4 |
Equality in the distribution of health resources
In order to evaluate the equality of health resources allocation comprehensively, we calculated the Gini coefficients both based on population and geographic area. The Gini coefficient by population means that its corresponding Lorenz curve’s x-axis is the cumulative proportion of population in each group, indicating the equality status based on population; while the Gini coefficient by geographic area means that its corresponding Lorenz curve’s x-axis is the cumulative proportion of geographic area in each group, which suggests the equality status based on geographic area.
Table 2 compared the Gini coefficients for health resources in China from 2011 to 2015. The Gini coefficients by population ranged between 0.0644 and 0.1879: 0.1845–0.1879 for the number of health care institutions, 0.0674–0.0739 for the number of health care beds, 0.0644–0.0752 for the number of health workers, which means that the distribution of the health resources shows a low level of inequality. Moreover, the Gini coefficients by geographic area ranged between 0.6136 and 0.6568: 0.6136–0.6177 for the number of health care institutions, 0.6366–0.6402 for the number of health care beds, 0.6553–0.6568 for the number of health workers, indicating that the distribution of the resources exhibits an extreme level of inequality.
Table 2.
Gini coefficients for health resources in China from 2011 to 2015
| Gini coefficient | Year | Health care institution | Health care bed | Health worker |
|---|---|---|---|---|
| Population size | 2011 | 0.1879(low inequality) | 0.0739(low inequality) | 0.0752(low inequality) |
| 2012 | 0.1869(low inequality) | 0.0708(low inequality) | 0.0716(low inequality) | |
| 2013 | 0.1859(low inequality) | 0.0674(low inequality) | 0.0686(low inequality) | |
| 2014 | 0.1860(low inequality) | 0.0685(low inequality) | 0.0658(low inequality) | |
| 2015 | 0.1845(low inequality) | 0.0693 (low inequality) | 0.0644(low inequality) | |
| Geographic size | 2011 | 0.6177(extreme inequality) | 0.6398(extreme inequality) | 0.6563(extreme inequality) |
| 2012 | 0.6136(extreme inequality) | 0.6402(extreme inequality) | 0.6568(extreme inequality) | |
| 2013 | 0.6152(extreme inequality) | 0.6392(extreme inequality) | 0.6563(extreme inequality) | |
| 2014 | 0.6145(extreme inequality) | 0.6366(extreme inequality) | 0.6553(extreme inequality) | |
| 2015 | 0.6154(extreme inequality) | 0.6390(extreme inequality) | 0.6556(extreme inequality) |
Figure 1 showed the Gini coefficients for health resources by population from 2011 to 2015. Figure 2 showed the Gini coefficients for the resources by geographic area in the meanwhile. The Gini coefficients both based on population and geographic area for the resources showed an overall downward trend, which indicates that the equality status got better.
Fig. 1.
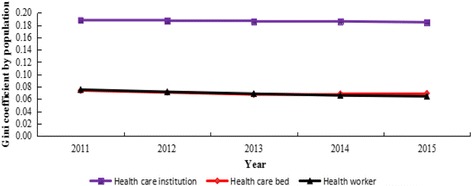
Gini coefficients for health resources by population in China from 2011 to 2015
Fig. 2.
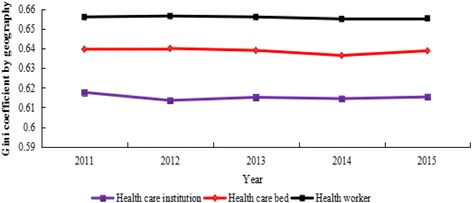
Gini coefficients for health resources by geographic area in China from 2011 to 2015
Equality in utilization of health services
Table 3 showed the concentration index values for health services utilization in China from 2011 to 2015. Meanwhile, the concentration index values for health services utilization ranged from −0.0073 to 0.2110. The concentration index values for outpatient visits, ranged from 0.1944 to 0.2110, suggesting a concentration of the service towards the richer populations. Conversely, the concentration index values for inpatients visits ranged from −0.0392 to −0.0126, and the concentration index values for bed utilization rate ranged from −0.0142 to −0.0073, indicating a concentration of these services towards the poorer populations.
Table 3.
Concentration index values for health services utilization in China from 2011 to 2015
| Year | Outpatient visits | Inpatients visits | Bed utilization rate |
|---|---|---|---|
| 2011 | 0.2110 | −0.0285 | −0.0130 |
| 2012 | 0.2035 | −0.0392 | −0.0142 |
| 2013 | 0.2033 | −0.0126 | −0.0126 |
| 2014 | 0.1975 | −0.0260 | −0.0083 |
| 2015 | 0.1944 | −0.0223 | −0.0073 |
Figure 3 showed the concentration index values for health services utilization in China from 2011 to 2015. In the meanwhile, the concentration index values for outpatient visits showed an overall downward trend, while the concentration index values for inpatients visits, bed utilization rate showed an overall upward trend, which indicated that the equality status of these services utilization got better. Meanwhile, the absolute values of concentration index for outpatient visits were significantly higher than those of other services, indicating that the equality status was the worst. On the contrary, the absolute values of concentration index for bed utilization rate were lower than those of other services, which indicates that the equality status was the best.
Fig. 3.
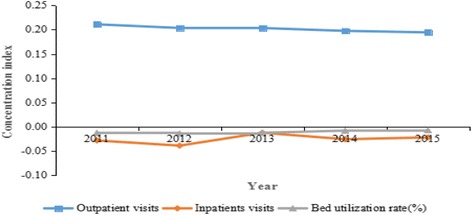
Concentration index values for health services utilization in China from 2011 to 2015
Efficiency evaluation based on data envelopment analysis
Operational efficiency analysis
Table 4 showed the efficiency values and slack values in health resources allocation of the 31 provinces in China in 2015. According to the scores, the average scores of OE, TE, and SE in the 31 provinces were 0.904, 0.921 and 0.982, respectively. Among the 31 provinces, 10 provinces (32.26%), such as Beijing, Tianjin, and Shanghai, had efficiency scores of 1 for OE, TE, and SE, and all the slack variables were 0, indicating that health resources allocation in these provinces was relatively efficient. Furthermore, 7 provinces (22.58%), such as Jiangsu, Zhejiang, and Anhui, had TE scores of 1, OE and SE scores of less than 1, a slack variable of 0, thus health resources allocation in these provinces was weakly efficient. Finally, 14 provinces (45.16%), such as Hebei, Shanxi, and Inner Mongolia, had OE, TE and SE scores of less than 1, and not all the slack variables were 0, thus they were inefficient in terms of health resources allocation. Among the 14 inefficient provinces, Shanxi had the lowest OE score of 0.588, suggesting that its efficiency was 58.80% of that of the efficient provinces. Of the 20 scale-inefficient provinces, 9 provinces (45.00%), such as Shanxi, Inner Mongolia, and Jilin, had increasing return to scale (IRS), suggesting that these scale-inefficient provinces had scales that were too small, and they had to expand their scale of operation; the remaining 11 provinces (55.00%), such as Hebei, Liaoning, and Jiangsu, had decreasing return to scale (DRS), indicating that these scale-inefficient provinces had to cut down their operations to achieve CRS.
Table 4.
Efficiency values and slack values in the 31 provinces of China in 2015
| Provinces | Overall efficiency | Technical efficiency | scale efficiency | Type of scale efficiency | S1− | S2− | S3− | S1+ | S2+ | S3+ | Relatively efficiency status |
|---|---|---|---|---|---|---|---|---|---|---|---|
| Beijing | 1.000 | 1.000 | 1.000 | − | 0 | 0 | 0 | 0 | 0 | 0 | Efficient |
| Tianjin | 1.000 | 1.000 | 1.000 | − | 0 | 0 | 0 | 0 | 0 | 0 | Efficient |
| Hebei | 0.806 | 0.817 | 0.986 | DRS | 37,342 | 62,436 | 97,330 | 0 | 0 | 4.378 | Inefficient |
| Shanxi | 0.588 | 0.591 | 0.994 | IRS | 26,227 | 74,891 | 120,527 | 0 | 0 | 9.331 | Inefficient |
| Inner Mongolia | 0.647 | 0.653 | 0.990 | IRS | 12,732 | 46,397 | 73,638 | 0 | 0 | 12.519 | Inefficient |
| Liaoning | 0.762 | 0.775 | 0.984 | DRS | 11,938 | 66,044 | 78,509 | 0 | 0 | 3.887 | Inefficient |
| Jilin | 0.706 | 0.709 | 0.995 | IRS | 8444 | 42,010 | 62,271 | 0 | 0 | 7.537 | Inefficient |
| Heilongjiang | 0.759 | 0.761 | 0.998 | IRS | 4965 | 53,164 | 68,410 | 18,611,938 | 0 | 7.441 | Inefficient |
| Shanghai | 1.000 | 1.000 | 1.000 | − | 0 | 0 | 0 | 0 | 0 | 0 | Efficient |
| Jiangsu | 0.967 | 1.000 | 0.967 | DRS | 0 | 0 | 0 | 0 | 0 | 0 | Weakly efficient |
| Zhejiang | 0.943 | 1.000 | 0.943 | DRS | 0 | 0 | 0 | 0 | 0 | 0 | Weakly efficient |
| Anhui | 0.990 | 1.000 | 0.990 | DRS | 0 | 0 | 0 | 0 | 0 | 0 | Weakly efficient |
| Fujian | 0.882 | 0.885 | 0.997 | IRS | 10,158 | 19,895 | 32,351 | 0 | 0 | 7.816 | Inefficient |
| Jiangxi | 1.000 | 1.000 | 1.000 | − | 0 | 0 | 0 | 0 | 0 | 0 | Efficient |
| Shandong | 0.797 | 0.939 | 0.848 | DRS | 4696 | 43,217 | 180,217 | 18,959,586 | 0 | 3.852 | Inefficient |
| Henan | 0.843 | 0.953 | 0.884 | DRS | 4034 | 23,184 | 77,957 | 67,288,228 | 0 | 0 | Inefficient |
| Hubei | 0.979 | 1.000 | 0.979 | DRS | 0 | 0 | 0 | 0 | 0 | 0 | Weakly efficient |
| Hunan | 1.000 | 1.000 | 1.000 | − | 0 | 0 | 0 | 0 | 0 | 0 | Efficient |
| Guangdong | 1.000 | 1.000 | 1.000 | − | 0 | 0 | 0 | 0 | 0 | 0 | Efficient |
| Guangxi | 1.000 | 1.000 | 1.000 | − | 0 | 0 | 0 | 0 | 0 | 0 | Efficient |
| Hainan | 0.904 | 0.915 | 0.988 | IRS | 428 | 3285 | 15,726 | 1,167,618 | 0 | 3.761 | Inefficient |
| Chongqing | 1.000 | 1.000 | 1.000 | − | 0 | 0 | 0 | 0 | 0 | 0 | Efficient |
| Sichuan | 0.935 | 1.000 | 0.935 | DRS | 0 | 0 | 0 | 0 | 0 | 0 | Weakly efficient |
| Guizhou | 0.951 | 0.951 | 1.000 | − | 4273 | 9532 | 12,576 | 11,209,602 | 0 | 6.534 | Inefficient |
| Yunnan | 0.992 | 1.000 | 0.992 | DRS | 0 | 0 | 0 | 0 | 0 | 0 | Weakly efficient |
| Tibet | 1.000 | 1.000 | 1.000 | − | 0 | 0 | 0 | 0 | 0 | 0 | Efficient |
| Shannxi | 0.798 | 0.800 | 0.998 | IRS | 12,444 | 42,438 | 70,079 | 0 | 0 | 5.008 | Inefficient |
| Gansu | 0.815 | 0.817 | 0.997 | IRS | 14,526 | 23,418 | 33,263 | 0 | 0 | 3.031 | Inefficient |
| Qinghai | 0.958 | 0.988 | 0.970 | IRS | 1428 | 4712 | 581 | 3,718,718 | 0 | 5.194 | Inefficient |
| Ningxia | 1.000 | 1.000 | 1.000 | − | 0 | 0 | 0 | 0 | 0 | 0 | Efficient |
| Xinjiang | 0.995 | 1.000 | 0.995 | DRS | 0 | 0 | 0 | 0 | 0 | 0 | Weakly efficient |
| Mean | 0.904 | 0.921 | 0.982 | / | 4956 | 16,601 | 29,788 | 3,901,796 | 0 | 3 | / |
S1−, S2−, S3−, S1+, S2+, and S3+ represent the slack values of health care institutions, health care beds, health workers, outpatient visits, inpatient visits, and bed utilization rate, respectively
Abbreviations: IRS increasing return to scale, DRS decreasing return to scale. -: constant return to scale
Slack variable analysis
Compared with the efficient provinces, the inefficient provinces are supposed to either reduce their inputs or increase their outputs to improve the efficiency of health resources allocation. Aiming at achieving a relatively optimal output value, the inefficient provinces should reduce the average number of health care institutions by 7316, the average number of health care beds by 24,506, and the average number of health workers by 43,973 while maintaining their current output levels unchanged. Alternatively, the inefficient provinces ought to increase the average outpatient visits by 5,759,795 and increase the bed utilization rate by 4% at the current input levels.
Discussion
From 2011 to 2015, the Gini coefficients for health care institution, health care bed, health worker by population were less than 0.2, indicating low inequality based on the above criteria. Conversely, the Gini coefficients for the three resources by geographic area exceeded 0.6 in the meanwhile, indicating extreme inequality. Obviously, the Gini coefficients by population are significantly lower than those by geographic area, indicating that there was a larger disparity in the geographic distribution of health resources than that in the population distribution, which was consistent with the finding of Jin et al. [38]. A potential explanation for this finding is that the government set the number of health resources per thousand population, rather than the number of health resources per 10,000 square km, as the allocation criterion [39]. As mentioned above, the equality status of the health resources allocation got better, which was consistent with the findings of Zhang et al. [40]. Consequently, it is reasonable to suggest the government that it should pay more attention to the equality based on geographic area when making regional health planning, perfect the allocation mechanism of health resources, and allocate more health resources to remote and economically underdeveloped provinces in order to improve the equality status of health resources allocation. Furthermore, the government ought to introduce adequate and experienced health workers in remote and economically underdeveloped provinces by giving extra subsidies and other preferential policies to ameliorate the inequality status of health worker.
The concentration index values for outpatient visits were positive, indicating that the people living in the eastern developed areas are more likely to use outpatient care than their western and central counterparts [17]. Conversely, the concentration index values for inpatients visits, bed utilization rate were negative, which indicates that the people living in western underdeveloped areas are more likely to use inpatient care than their eastern and central counterparts [17]. This disparity maybe due to the gaps in income level among the eastern, central and western regions [17]. Consequently, the government should pay attention to this phenomenon, guide patients to choose health services rationally, and control the rapid increase of health services prices.
More than 30% of provinces were relatively efficient in terms of health resources allocation. Moreover, approximately 22.58% of provinces were weakly efficient. That is to say, the scale of the existing health resources in these weakly efficient provinces was relatively smaller than others and the growth rate of outputs was higher than that in investment, thus more investment should be put to them. It is worth noting that more than 45% of provinces were relatively inefficient. In other words, the health resources in these provinces were not fully utilized at the current size. The results are consistent with Zhang’s study [41], which showed that 41.94% of the provinces in China were relatively inefficient in 2011. Thus, it is reasonable for these provinces to ameliorate their management strategies and improve the quality of health services to improve the efficiency of resource allocation.
This study has some limitations. On the one hand, the evaluation on equality and efficiency of health resources allocation and health services utilization was conducted independently in two phases, which needs to be improved in future studies. On the other hand, some representative indicators, such as the indicators related to health resources allocation were adequate; while some indicators, such as the benefits for the patients, for evaluating equality of health services were inadequate, which may have effects on the comprehensiveness of the evaluation.
Conclusion
Based on the analysis above, we find that there exist distinct regional disparities in the distribution of health resources in China, which are mainly reflected in the geographic distribution of health resources. Furthermore, the people living in the eastern developed areas are more likely to use outpatient care, while the people living in western underdeveloped areas are more likely to use inpatient care. Moreover, the efficiency of health resources allocation in 21 provinces (67.74%) of China was low and needs to be improved. Consequently, stakeholders, including government, health care institutions, and patients, should cooperate jointly to improve the equality and efficiency of health resources allocation and health services utilization.
Acknowledgements
Not applicable.
Funding
The Program of Guangxi Zhuang Autonomous Region Association for Science and Technology for Young Teachers and Graduate Students in 2016 (Item number: gui ke xie〔2016〕Z-46), The Program of Humanities and Social Science Research Center of Guangxi Medical University for Graduate Students in 2016 (Item number: 2016RWY06), Innovation Project of Guangxi Graduate Education in 2017 (Item number: YCSW2017114).
Availability of data and materials
We got the data from China Health Statistics Yearbook 2012–2016 and China Statistics Yearbook 2012–2016.
Abbreviations
- BCC model
Banker, Charnes, Cooper model
- CCR model
Charnes, Cooper, Rhodes model
- CRS
Constant return to scale
- DEA
Data envelopment analysis
- DMUs
Decision-making units
- DRS
Decreasing return to scale
- IRS
Increasing return to scale
- OE
Overall efficiency
- SE
Scale efficiency
- TE
Technical efficiency
- VRS
Variable return to scale
Authors’ contributions
HL, JS formulated the research concept and developed the primary framework of the study; JS contributed to the final manuscript; JS was involved in data collection. The final manuscript submitted for publication was read and approved by JS and HL.
Authors’ information
Jian Sun, a Master Degree Candidate in School of Humanities and Social Science, Guangxi Medical University, Nanning, Guangxi, 530021, China. Hongye Luo, a lecturer in School of Information and Management, Guangxi Medical University, Nanning, Guangxi, 530021, China.
Ethics approval and consent to participate
The study protocol was reviewed and approved by the Ethics Committee of Guangxi Medical University. All research was performed in accordance with the Declaration of Helsinki. Written informed consent was obtained from each volunteering participant based on inclusion criteria. Participants were informed that they could withdraw from the study at any point in time without any consequences and were also ensured of anonymity and confidentiality within the study.
Consent for publication
Not applicable.
Competing interests
The authors declare that they have no competing interest.
Publisher’s Note
Springer Nature remains neutral with regard to jurisdictional claims in published maps and institutional affiliations.
Contributor Information
Jian Sun, Email: 290981511@qq.com.
Hongye Luo, Email: 95560036@qq.com.
References
- 1.Zhou Z, Zhu L, Zhou Z, et al. The effects of China’s urban basic medical insurance schemes on the equity of health service utilisation: evidence from Shaanxi Province. Int J Equity Health. 2014;13(1):23. doi: 10.1186/1475-9276-13-23. [DOI] [PMC free article] [PubMed] [Google Scholar]
- 2.Liu W, Liu Y, Twum P, et al. National equity of health resource allocation in China: data from 2009 to 2013. Int J Equity Health. 2016;15:68. doi: 10.1186/s12939-016-0357-1. [DOI] [PMC free article] [PubMed] [Google Scholar]
- 3.Fang P, Dong S, Xiao J, et al. Regional inequality in health and its determinants: evidence from China. Health Policy. 2010;94(1):14–25. doi: 10.1016/j.healthpol.2009.08.002. [DOI] [PubMed] [Google Scholar]
- 4.Xie J, Fang P. Study on the configuration fairness and the utilization efficiency of inter-provincial health resource in China. Chin Health Econ. 2013;32(1):60–62. [Google Scholar]
- 5.He D, Yu H, Chen Y. Equity in the distribution of CT and MRI in China: a panel analysis. Int J Equity Health. 2013;12(1):1–15. doi: 10.1186/1475-9276-12-39. [DOI] [PMC free article] [PubMed] [Google Scholar]
- 6.Tang S, Meng Q, Chen L, et al. Tackling the challenges to health equity in China. Lancet. 2008;372(9648):1493. doi: 10.1016/S0140-6736(08)61364-1. [DOI] [PMC free article] [PubMed] [Google Scholar]
- 7.National Bureau of Statistics of China . China statistical Yearbook. Beijing: China Statistics Press; 2016. p. 2016. [Google Scholar]
- 8.National Bureau of Statistics of China . China statistical Yearbook. Beijing: China Statistics Press; 2015. p. 2015. [Google Scholar]
- 9.National Bureau of Statistics of China . China statistical Yearbook. Beijing: China Statistics Press; 2014. p. 2014. [Google Scholar]
- 10.National Bureau of Statistics of China . China statistical Yearbook. Beijing: China Statistics Press; 2013. p. 2013. [Google Scholar]
- 11.National Bureau of Statistics of China . China statistical Yearbook. Beijing: China Statistics Press; 2012. p. 2012. [Google Scholar]
- 12.National Health and Family Planning Commission of China . China health Statistics Yearbook. Beijing: Pecking Union Medical College Press; 2016. p. 2016. [Google Scholar]
- 13.National Health and Family Planning Commission of China . China health Statistics Yearbook. Beijing: Pecking Union Medical College Press; 2015. p. 2015. [Google Scholar]
- 14.National Health and Family Planning Commission of China . China health Statistics Yearbook. Beijing: Pecking Union Medical College Press; 2014. p. 2014. [Google Scholar]
- 15.National Health and Family Planning Commission of China . China health Statistics Yearbook. Beijing: Pecking Union Medical College Press; 2013. p. 2013. [Google Scholar]
- 16.National Health and Family Planning Commission of China . China health Statistics Yearbook. Beijing: Pecking Union Medical College Press; 2012. p. 2012. [Google Scholar]
- 17.Zhang T, Xu Y, Ren J, et al. Inequality in the distribution of health resources and health services in China hospitals versus primary care institutions. Int J Equity Health. 2017;16:42. doi: 10.1186/s12939-017-0543-9. [DOI] [PMC free article] [PubMed] [Google Scholar]
- 18.Sun J, Zhu P. Analysis of the allocation fairness of class B large medical equipment in Guangxi. Mod Prev Med. 2016;43(18):4370–4373. [Google Scholar]
- 19.Sun J, Wen Q. Evaluation on the equity and efficiency of health resources in Guangxi Zhuang Autonomous region. Chinese Primary Health Care. 2016;30(10):5–7. [Google Scholar]
- 20.Theodorakis PN, Mantzavinis GD. Inequalities in the distribution of rural primary care physicians in two remote neighboring prefectures of Greece and Albania. Rural Remote Health. 2005;5(3):457. [PubMed] [Google Scholar]
- 21.Matsumoto M, Koike S, Kashima S, et al. Geographic distribution of CT, MRI and PET devices in Japan: a longitudinal analysis based on National Census Data. Plos One. 2015;10(5):e0126036. doi: 10.1371/journal.pone.0126036. [DOI] [PMC free article] [PubMed] [Google Scholar]
- 22.Hatam N, Zakeri M, Sadeghi A, et al. Equity analysis of hospital beds distribution in shiraz, Iran 2014. Med J Islam Repub Iran. 2016;30:393. [PMC free article] [PubMed] [Google Scholar]
- 23.Omranikhoo H, Lotfi F, Safari H, et al. Equity in distribution of health care resources; assessment of need and access, using three practical indicators. Iran J Public Health. 2013;42(11):1299–1308. [PMC free article] [PubMed] [Google Scholar]
- 24.Yan K, Jiang Y, Qiu J, et al. The equity of China’s emergency medical services from 2010–2014. Int J Equity Health. 2017;16(1):10. doi: 10.1186/s12939-016-0507-5. [DOI] [PMC free article] [PubMed] [Google Scholar]
- 25.Horev T, Pesis-Katz I, Mukamel D. Trends in geographic disparities in allocation of health care resources in the US. Health Policy. 2004;68(2):223–232. doi: 10.1016/j.healthpol.2003.09.011. [DOI] [PubMed] [Google Scholar]
- 26.Sefiddashti S, Arab M, Ghazanfari S, et al. Trends of geographic inequalities in the distribution of human resources in healthcare system: the case of Iran. Electron Physician. 2016;8(7):2607–2613. doi: 10.19082/2607. [DOI] [PMC free article] [PubMed] [Google Scholar]
- 27.Sun J, Gu H, Wen Q, et al. Assessing equity in the distribution of high-technology medical equipment in Guangxi: evidence from an ethnic minority region in southern China. Int J Equity Health. 2017;16:81. [DOI] [PMC free article] [PubMed]
- 28.Liang S, Feng Q, Wang Y, et al. Studying on the equity of health resources allocation in the minority nationality areas sampled with Guangxi. Chin Health Serv Manage. 2015;32(9):677–680. [Google Scholar]
- 29.Cheng Z, Tao H, Cai M, et al. Technical efficiency and productivity of Chinese county hospitals: an exploratory study in Henan province, China. BMJ Open. 2015;5(9):e007267. doi: 10.1136/bmjopen-2014-007267. [DOI] [PMC free article] [PubMed] [Google Scholar]
- 30.Sun J, Wen Q. Evaluation on technical efficiency of high-tech medical equipment in county-level public hospitals in Guangxi based on DEA model. China Med Equip. 2016;13(8):108–111. [Google Scholar]
- 31.Sun J, Wen Q, Zhu H. Analysis on the equity and efficiency of health resources allocation in Guangdong province. Soft Sci Health. 2016;30(9):30–33. [Google Scholar]
- 32.Wang X, Luo H, Qin X, et al. Evaluation of performance and impacts of maternal and child health hospital services using data envelopment analysis in Guangxi Zhuang Autonomous region, China: a comparison study among poverty and non-poverty county level hospitals. Int J Equity Health. 2016;15(1):131. doi: 10.1186/s12939-016-0420-y. [DOI] [PMC free article] [PubMed] [Google Scholar]
- 33.Torabipour A, Najarzadeh M, Arab M, et al. Hospitals productivity measurement using data envelopment analysis technique. Iran J Public Health. 2014;43(11):1576–1581. [PMC free article] [PubMed] [Google Scholar]
- 34.Charalambous C, Maniadakis N, Polyzos N, et al. The efficiency of the public dental services (PDS) in Cyprus and selected determinants. BMC Health Serv Res. 2013;13(1):420. doi: 10.1186/1472-6963-13-420. [DOI] [PMC free article] [PubMed] [Google Scholar]
- 35.Li H, Dong S, Liu T. Relative efficiency and productivity: a preliminary exploration of public hospitals in Beijing, China. BMC Health Serv Res. 2014;14:158. doi: 10.1186/1472-6963-14-158. [DOI] [PMC free article] [PubMed] [Google Scholar]
- 36.Jehuappiah C, Sekidde S, Adjuik M, et al. Ownership and technical efficiency of hospitals: evidence from Ghana using data envelopment analysis. Cost Eff Resour Alloc. 2014;12(1):9. doi: 10.1186/1478-7547-12-9. [DOI] [PMC free article] [PubMed] [Google Scholar]
- 37.Kirigia J, Asbu E. Technical and scale efficiency of public community hospitals in Eritrea: an exploratory study. Heal Econ Rev. 2013;3(1):6. doi: 10.1186/2191-1991-3-6. [DOI] [PMC free article] [PubMed] [Google Scholar]
- 38.Jin J, Wang J, Ma X, et al. Equality of medical health resource allocation in China based on the Gini coefficient method. Iran J Public Health. 2015;44(4):445–457. [PMC free article] [PubMed] [Google Scholar]
- 39.The State Council of China. The national planning for medical and health service system from 2015 to 2020, Government document; 2015. Available at: www.gov.cn/zhengce/content/2015-03/30/content_9560.htm. Accessed 30 Mar 2015.
- 40.Zhang N, Sun X, Li C, et al. Analyzing the equity of health resources allocation in China based on Theil index. Chin Health Serv Manage. 2014;30(2):88–90. [Google Scholar]
- 41.Zhang X, Zhao L, Cui Z, et al. Study on equity and efficiency of health resources and services based on key indicators in China. Plos One. 2015;10(12):e0144809. doi: 10.1371/journal.pone.0144809. [DOI] [PMC free article] [PubMed] [Google Scholar]
Associated Data
This section collects any data citations, data availability statements, or supplementary materials included in this article.
Data Availability Statement
We got the data from China Health Statistics Yearbook 2012–2016 and China Statistics Yearbook 2012–2016.