

Abstract
Objective
The aim of the present study was to assess the temperature map and its reproducibility while applying two different MWA systems (915 MHz vs 2.45 GHz) in ex vivo porcine livers.
Materials and Methods
Fifteen fresh pig livers were treated using the two antennae at three different settings: treatment time of 10 minutes and power of 45 W for both systems; 4 minutes and 100 W for the 2.45 GHz system.
Trends of temperature were recorded during all procedures by means of fiber optic-based probes located at five fixed distances from the antenna, ranging between 10 mm and 30 mm. Each trial was repeated twice to assess the reproducibility of temperature distribution.
Results
Temperature as function of distance from the antenna can be modeled by a decreasing exponential trend. At the same settings, temperature obtained with the 2.45 GHz system was higher than that obtained with the 915MHz thus resulting into a wider area of ablation (diameter 17mm vs 15mm). Both systems showed good reproducibility in terms of temperature distribution (root mean squared difference for both systems ranged between 2.8 °C and 3.4 °C).
Conclusions
When both MWA systems are applied, a decreasing exponential model can predict the temperature map. The 2.45 GHz antenna causes higher temperatures as compared to the 915 MHz thus, resulting into larger areas of ablation. Both systems showed good reproducibility although better results were achieved with the 2.45 GHz antenna.
Keywords: Microwave ablation, tissue, thermometry, hyperthermal treatment, liver ablation, fiber optic sensors
INTRODUCTION
Percutaneous radiofrequency ablation (RFA) and microwave ablation (MWA) are commonly used to treat primary and metastatic liver tumors [1–7]. MWA is a relative new modality and data regarding its efficacy are fewer than those available for RFA. With both techniques, the amount of damaged tissue depends on temperature distribution within the tissue; as a consequence, effective RFA and MWA need predictable and reproducible temperature distribution within the target tumor. Indeed, during hyper-thermal treatments it is crucial to know where the lethal isotherm (60 °C to 100 °C) will occur.
MWA relies on dielectric hysteresis. Basically, an electromagnetic field is applied to the target tumor through an antenna. As a result, dipoles are forced to continuously realign with such electromagnetic field thus, producing frictional energy then converted into heating [8]. Although dielectric properties can change during treatment, MWA is relative insensitive to tissue features (e.g., impedance, perfusion, etc.); therefore, MW energy can radiate through all biological tissues thus, resulting in faster procedures and larger areas of ablations compared to RFA [8].
Common available MWA systems work in the range of 915 MHz – 2.45 GHz. However, data comparing both systems are limited [9, 10] due to the fact that MWA is a recent emerging technology. The aim of the present study was to evaluate the temperature map while applying two different MWA systems (915 MHz vs 2.45 GHz) in ex vivo porcine livers and to investigate its reproducibility.
MATERIALS AND METHODS
MWA was performed on 15 healthy ex vivo porcine livers. Trials were carried out using two different MWA systems: a 915 MHz cooled-shaft antenna (Evident Ablation System, Covidien, USA) and a 2.45 GHz cooled-shaft antenna (Emprint™ Ablation System, Covidien, USA). With the 915 MHz system each experiment lasted 10 minutes and was carried out using 45 W as output power; with the 2.45 GHz system experiments were performed with two different settings: i) 10 minutes at 45 W, aiming to compare the two systems with the same settings, and ii) 4 minutes at 100 W in order to have a similar short axis of the ablation zone (i.e. 30 mm) with respect to the 915 MHz system, according to the specifications provided by the manufacturer.
Experiments were performed at environmental temperature (22±2 °C) and the initial temperature of livers measured just before starting the treatment, was almost equal to the environmental one. Temperature was always measured along the short axis of the ablation zone by means of two Fiber Bragg grating (FBG) sensors (1 cm grating length), connected to an optical spectrum analyzer, OSA (Optical Sensing Interrogator, sm125, Micron Optics). The sensors’ output was acquired with a sample frequency of 250 Hz. FBGs were placed at 5 different distances from the antenna (i.e., 10 mm, 15 mm, 20 mm, 25 mm, 30 mm) by an ad hoc designed poly methyl methacrylate (PMMA) mask described elsewhere [11]. At the end of each trial, the treated liver was cut in order to assess the ablation zone; if by chance large vessels were included into the ablation zone, the trial was not included in the study analysis and accordingly repeated. The schematic representation of the sensors’ position is reported in Fig. 1. FBG sensors were inserted coaxially within the tissue by means of a 16G needle extracted after inserting the sensor.
Figure 1.

Schematic representation of sensors positioning.
Temperature measurements were repeated twice for each distance in order to assess reproducibility of thermal distribution when the same system was applied. At the end of each procedure, temperature data were reported as function of distance. A decreasing exponential model was used to describe the relationship between these two parameters. The exponential fitting was performed on the first set of trials and then it was tested on the second set of trials. In the end, the agreement between the experimental data and the proposed model was investigated.
All the data analysis was performed in MATLAB.
RESULTS
Results obtained with the two different systems at different settings are summarized in Table 1.
Table 1.
Temperature increase (ΔTMAX) at the end of treatments performed with the two systems. The values of the constants (a and b), as well as the R2 value for the second set of trials are also shown.
| ΔTMAX [°C] 915 MHz system, 45W, 10 min |
ΔTMAX [°C] 2.45 GHz system, 100 W, 4 min |
ΔTMAX [°C] 2.45 GHz system, 45 W, 10 min |
|||||||||||||
|---|---|---|---|---|---|---|---|---|---|---|---|---|---|---|---|
| d | trial 1 | trial 2 | exponential parameters | trial 1 | trial 2 | exponential parameters | trial 1 | trial 2 | exponential parameters | ||||||
| 10mm | 82 | 71 | a [°C] | b [mm−1] | R2 | 65 | 64 | a [°C] | b [mm−1] | R2 | 97 | 92 | a [°C] | b [mm−1] | R2 |
| 15mm | 34 | 35 | 434.9 | 0.1674 | 0.96 | 30 | 23 | 262.0 | 0.1402 | 0.95 | 55 | 53 | 435.0 | 0.1481 | 0.98 |
| 20mm | 15 | 12 | 16 | 15 | 15 | 20 | |||||||||
| 25mm | 8.3 | 7.5 | 9.2 | 13 | 10 | 12 | |||||||||
| 30mm | 5.1 | 3.9 | 5.4 | 4.1 | 5.4 | 5.2 | |||||||||
• Trials performed with the 915 MHz system
Temperature trends measured by the sensors during trials performed with the 915 MHz system at 45 W and 10 minutes are reported in Fig. 2A. Experiments showed that temperature increased along with treatment time and that the lower the distance from the antenna the higher the temperature at the end of the procedure. The decrease of temperature with distance was non-linear. Such decrease can be modeled by a decreasing exponential trend (Fig. 2B) expressed as:
| (1) |
where ΔT is the temperature increment experienced by the tissue, d is the distance from the antenna, a and b are two constants obtained by means of the fitting experimental data (a=434.9°C and b=0.1674mm−1). The good agreement between the proposed simple model and the experimental data obtained during the first set of trials was confirmed by the high value of the correlation coefficient (R2>0.99) and of the root mean squared error (RMSE ≈1.8°C). The model was also validated on the second set of trials showing good results (R2>0.96, RMSE ≈1.8°C).
Figure 2.

Temperature data obtained by using the 915 MHz system at 45 W and 10 minutes: A) increase of tissue temperature during the whole treatment at the 5 distances for the two trials; B) maximum temperature increase reached at the end of the treatment as a function of the distance. Experimental data (dots) and their best exponential fitting are also shown.
Temperature experienced by the tissue showed good reproducibility between the two repeated trials: at 10 mm, the difference between the maximum temperature experienced by the tissue between the two trials was about 11 °C, but for all the other four distances the difference was always lower than 3 °C. The root mean squared difference considering temperatures measured at the 5 distances during the two trials was 3.4 °C.
Lethal isotherms were considered where the temperature of the tissue was >60 °C at the end of the procedure. Considering an initial temperature of about 22 °C, lethal isotherms have to fulfill the requirement ΔT≥38°C. Therefore, tissue experienced lethal isotherm at 15 mm from the antenna (Fig. 2B).
• Trials performed with the 2.45 GHz system
Temperature trends measured during trials performed with the 2.45 GHz system at 45 W and 10 minutes are reported in Fig. 3A. Also in this case temperature increased along with treatment time and decreased non-linearly with the distance from the antenna.
Figure 3.

Temperature data obtained by using the 2.45 GHz system at 45 W and 10 minutes: A) increase of tissue temperature during the whole treatment at the 5 distances for the two trials; B) maximum temperature increase reached at the end of the treatment as a function of the distance. Experimental data (dots) and their best exponential fitting are also shown.
At 45 W for 10 minutes with the 2.45 GHz system, the relationship between the temperature increment and the distance from the antenna can be expressed in accordance to (1) (a=435.0 °C and b=0. 1481 mm−1, Fig. 3B). The good agreement between the proposed simple model and the experimental data obtained during the first set of trials was confirmed by the high value of the correlation coefficient (R2>0.98) and of the root mean squared error (RMSE ≈6.3 °C). The model was also validated on the second set of trials showing good results (R2>0.98, RMSE ≈4.5 °C).
Temperature experienced by the tissue showed a good reproducibility: the difference between the two trials at 10 mm was 5 °C; moreover, the root mean squared difference considering the temperature measured at the 5 distances during the two trials was 2.8 °C. The diameter of lethal isotherm occurred at 17 mm from the 2.45 GHz antenna (Fig. 3B).
Temperature trends measured during trials performed with the 2.45 GHz system at 100 W and 4 minutes are reported in Fig. 4A. Also in this case temperature increased along with treatment time and decreased non-linearly with the distance from the antenna.
Figure 4.
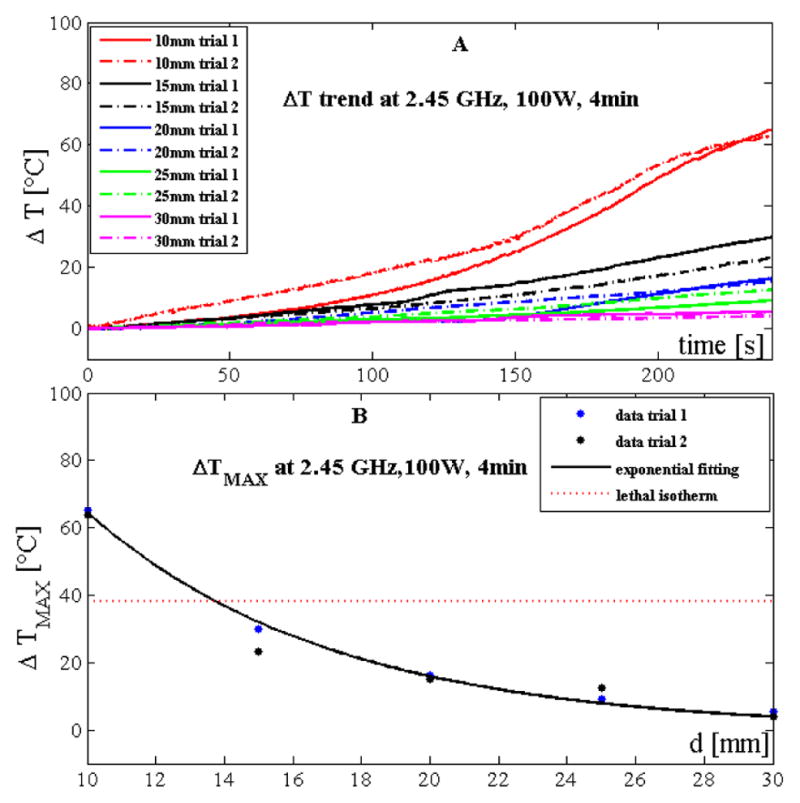
Temperature data obtained by using the 2.45 GHz system at 100 W and 4 minutes: A) increase of tissue temperature during the whole treatment at the 5 distances for the two trials; B) maximum temperature increase reached at the end of the treatment as a function of the distance. Experimental data (dots) and their best exponential are also shown.
Also in this case, the relationship between temperature increment and distance from the antenna can be expressed in accordance with (1) (a=262.0 °C and b=0.1402 mm−1, Fig. 4B). The good agreement between the proposed simple model and the experimental data obtained during the first set of trials was confirmed by the high value of the correlation coefficient (R2>0.99) and of the root mean squared error (RMSE ≈1.7 °C). The model was also validated on the second set of trials showing good results (R2>0.95, RMSE ≈4.5 °C).
Temperature experienced by the tissue showed good reproducibility: the difference between the two trials at 10 mm was 1 °C; moreover, the root mean squared difference considering the temperature measured at the 5 distances during the two trials was 2.8 °C.
With the 2.45 GHz system, tissue experienced the lethal isotherm 14 mm away from the antenna (Fig. 4B).
DISCUSSION
MWA yields several advantages compared to RFA including faster heating, radiation through all biological tissues, generation of higher temperatures (often > 100°C) and reduced exposure to the “heat-sink effect” [8]. This latter aspect is not negligible in liver given its rich vascular network [8, 14].
Currently, two different frequencies (915 MHz or 2.45 GHz) are used in MWA and we aimed at comparing both systems at the same settings and at different settings to have similar extension of the ablation zones. Such approach was slightly different than that applied by Sun et al [10], who compared both systems only at similar settings in an ex-vivo animal model. They reported higher temperature with the 915 MHz antenna as compared to the 2.45 GHz one [10]. Although we compared both antennas with only one similar setting (10 minutes, 45W), we found higher temperatures with the 2.45 GHz antenna as compared to the 915MHz. As a consequence, the ablation zone was wider with the 2.45 GHz (i.e. 17mm) as compared to the 915 MHz (i.e. 15mm). The discrepancy between our results and those obtained by Sun et al may be explained by the different type of 2.45 GHz device we have used, which incorporates a new technology (Thermosphere®) providing a predictive spherical area of ablation [13]. Such result is critical in tumor ablation and is achieved by combining three different levels of control:
“field control”: due to the specific design of the antenna, electrons moving within the antenna are focused on its tip. As a consequence, the electromagnetic energy is focused on the tip of the device thus, contributing to generate the precise desired shape (i.e. spherical) of the electromagnetic field.
“thermal control”: it is achieved by a continuous saline-mediated internal cooling of the entire antenna. This process avoids high-temperature direct contact between the antenna and the target tissue thus preventing tissue eschar and sticking.
“wave-length control”: as tissue coagulates and desiccates during the ablative process, fluids move peripherally away from the probe thus, determining a continuous change of the dielectric properties of the tissue consistent with an increased wavelength of the field. This results into an elongated and elliptical shape of the ablation zone. On the contrary, the new “wave-length control” technology allows a constant and favorable material environment in close proximity to the probe thus, avoiding a strong influence on the ablation area mediated by tissue changes during the ablation.
An example of the spherical shape of the ablated region we have obtained at the end of our trials performed with the 2.45 GHz device is shown in Fig. 5A and compared to the more elliptical shape obtained with 915 MHz antenna (Fig. 5B).
Figure 5.

A) Spherical ablated region obtained by using the 2.45 GHz antenna and B) elliptical ablated region obtained with 915 GHz antenna. In both cases, the contours of the ablation zone are marked.
As regards peak temperature, our results are in line with those obtained by Sun et al. regarding the 915 MHz system [10]: they found a peak temperature of 62 °C at a distance of 15 mm with the 915 MHz system at 50 W after 10 minutes of treatment (corresponding to a delivered energy of 50 W × 600 s = 30000 J). On the other hand, we found a temperature increase of 34 °C and 35 °C (which corresponds to a peak temperature of 56 °C and 57 °C) during the two trials performed with the same system, at the same distance and treatment time and with a slightly lower output power (i.e., 45 W, delivered energy 45 W × 600 s = 27000 J).
As regards the trials performed with the 2.45 Ghz systems at different settings (100 W, 4 min and 45 W, 10 min), higher temperatures were obtained in the second case, despite the lower power applied, due to longer treatment time. In fact, during the treatment performed at 45W, 10min the energy delivered was 27000J (45W × 600s = 27000J) vs 24000J delivered at 100W, 4min (100W × 240s = 24000J).
In our trials, temperature was measured by means of fiber optic sensors. They are based on fiber Bragg technology and their performance has been already assessed during hyper-thermal laser ablations [15, 16]. These sensors are not prone to inaccuracy due to heat conduction and absorption errors affecting thermocouples and thermistors [17]; moreover, they can be employed in harsh environmental conditions of very strong electromagnetic fields [18]. Lastly, the use of the custom made PMMA mask allowed highly accurate insertion of the sensors at selected distance from the antenna, as also reported in previous studies [11, 19].
In terms of reproducibility of the area of ablation, our study showed that both systems are reliable either when the same antenna is applied either when both systems are applied with different settings. The 2.45 GHz antenna was more reliable than the 915 MHz especially, but not only, at reduced distance from the antenna (Table 1, data regarding temperature at 10 mm) probably due to the new Thermosphere (®) technology. Despite the type of antenna applied, temperature distribution into the biological tissue was always predicted by a decreasing exponential model, which showed good agreement with the experimental data.
A major limitation of our study was that trials were performed on healthy ex vivo porcine livers thus, underestimating the impairment of blood perfusion (i.e., “heat-sink effect”). Moreover, MWA was performed at environmental temperature, which is lower than in vivo systemic temperature (22 °C vs 37 °C). These two effects work against each other; therefore, it may be speculated that a sort of compensation exists between these two effects. A further limitation is that experiments were performed with a limited number of settings.
In conclusion, temperature increase and diameters of lethal isotherm generated by the two MWA systems (915 MHz and 2.45 GHz) can be predicted by a decreasing exponential model. The 2.45GHz antenna causes higher temperature compared to the 915 MHz thus, resulting into larger areas of ablation. Both systems showed good reproducibility although better results were achieved with the 2.45 GHz antenna.
Acknowledgments
Role of the funding source
This study has been partially supported by the California Institute for Regenerative Medicine and by the National Institutes of Health (Grant P30 CA033572). Emiliano Schena was supported by a Grant from the “Campus Bio-Medico” Alumni Association.
Footnotes
Conflict of interest
All the authors declare that there is no financial interest or any other potential conflict of interest.
Publisher's Disclaimer: This is a PDF file of an unedited manuscript that has been accepted for publication. As a service to our customers we are providing this early version of the manuscript. The manuscript will undergo copyediting, typesetting, and review of the resulting proof before it is published in its final citable form. Please note that during the production process errors may be discovered which could affect the content, and all legal disclaimers that apply to the journal pertain.
References
- 1.Lu MD, Xu HX, Xie XY, Yin XY, Chen JW, Kuang M, Xu ZF, Liu GJ, Zheng YL. Percutaneous microwave and radiofrequency ablation for hepatocellular carcinoma: a retrospective comparative study. J Gastroenterol. 2005;40(11):1054–1060. doi: 10.1007/s00535-005-1671-3. [DOI] [PubMed] [Google Scholar]
- 2.Livraghi T, Meloni F, Di Stasi M, Rolle E, Solbiati L, Tinelli C, Rossi S. Sustained complete response and complications rates after radiofrequency ablation of very early hepatocellular carcinoma in cirrhosis: Is resection still the treatment of choice? Hepatology. 2008;47(1):82–9. doi: 10.1002/hep.21933. [DOI] [PubMed] [Google Scholar]
- 3.Solbiati L, Ahmed M, Cova L, Ierace T, Brioschi M, Goldberg SN. Small liver colorectal metastases treated with percutaneous radiofrequency ablation: local response rate and long-term survival with up to 10-year follow-up. Radiology. 2012;265(3):958–68. doi: 10.1148/radiol.12111851. [DOI] [PubMed] [Google Scholar]
- 4.Liu Y, Zheng Y, Li S, Li B, Zhang Y, Yuan Y. Percutaneous microwave ablation of larger hepatocellular carcinoma. Clin Radiol. 2013;68(1):21–6. doi: 10.1016/j.crad.2012.05.007. [DOI] [PubMed] [Google Scholar]
- 5.Ierardi AM, Floridi C, Fontana F, Chini C, Giorlando F, Piacentino F, Brunese L, Pinotti G, Bacuzzi A, Carrafiello G. Microwave ablation of liver metastases to overcome the limitations of radiofrequency ablation. Radiol Med. 2013;118(6):949–61. doi: 10.1007/s11547-013-0968-1. [DOI] [PubMed] [Google Scholar]
- 6.Cazzato RL, Buy X, Alberti N, Fonck M, Grasso RF, Palussière J. Flat-Panel Cone-Beam Ct-Guided Radiofrequency Ablation of Very Small (≤1.5 cm) Liver Tumors: Technical Note on a Preliminary Experience. Cardiovasc Intervent Radiol. 2015 Feb;38(1):206–12. doi: 10.1007/s00270-014-1019-6. [DOI] [PubMed] [Google Scholar]
- 7.Nikfarjam M, Muralidharan V, Christophi C. Mechanisms of focal heat destruction of liver tumours. J Surg Res. 2005;127(2):208–223. doi: 10.1016/j.jss.2005.02.009. [DOI] [PubMed] [Google Scholar]
- 8.Brace CL. Microwave ablation technology: what every user should know. Curr Probl Diagn Radiol. 2009;38(2):61–67. doi: 10.1067/j.cpradiol.2007.08.011. [DOI] [PMC free article] [PubMed] [Google Scholar]
- 9.Leung U, Kuk D, D’Angelica MI, Kingham TP, Allen PJ, DeMatteo RP, Jarnagin WR, Fong Y. Long-term outcomes following microwave ablation for liver malignancies. Brit J Surg. 2015;102(1):85–91. doi: 10.1002/bjs.9649. [DOI] [PMC free article] [PubMed] [Google Scholar]
- 10.Sun Y, Cheng Z, Dong L, Zhang G, Wang Y, Liang P. Comparison of temperature curve and ablation zone between 915-and 2450-MHz cooled-shaft microwave antenna: results in ex vivo porcine livers. Eur J Radiol. 2012;81(3):553–557. doi: 10.1016/j.ejrad.2011.02.013. [DOI] [PubMed] [Google Scholar]
- 11.Schena E, Saccomandi P, Giurazza F, Caponero MA, Mortato L, Di Matteo FM, Panzera F, Del Vescovo R, Beomonte Zobel B, Silvestri S. Experimental assessment of CT-based thermometry during laser ablation of porcine pancreas. Phys Med Biol. 2013;58(16):5705–5716. doi: 10.1088/0031-9155/58/16/5705. [DOI] [PubMed] [Google Scholar]
- 12.Lubner MG, Brace CL, Ziemlewicz TJ, Hinshaw JL, Lee FT., Jr Microwave ablation of hepatic malignancy. Semin Intervent Radiol. 2013;30(1):56–66. doi: 10.1055/s-0033-1333654. [DOI] [PMC free article] [PubMed] [Google Scholar]
- 13.Ierardi AM, Mangano A, Floridi C, Dionigi G, Biondi A, Duka E, Lucchina N, Lianos GD, Carrafiello G. A new system of microwave ablation at 2450 MHz: preliminary experience. Updates Surg. 2015 Mar;67(1):39–45. doi: 10.1007/s13304-015-0288-1. [DOI] [PubMed] [Google Scholar]
- 14.Yu NC, Raman SS, Kim YJ, Lassman C, Chang X, Lu DS. Microwave liver ablation: influence of hepatic vein size on heat-sink effect in a porcine model. J Vasc Interv Radiol. 2008;19(7):1087–1092. doi: 10.1016/j.jvir.2008.03.023. [DOI] [PubMed] [Google Scholar]
- 15.Saccomandi P, Schena E, Caponero MA, Di Matteo FM, Martino M, Pandolfi M, Silvestri S. Theoretical analysis and experimental evaluation of laser-induced interstitial thermotherapy in ex vivo porcine pancreas. IEEE T Bio-Med Eng. 2012;59(10):2958–2964. doi: 10.1109/TBME.2012.2210895. [DOI] [PubMed] [Google Scholar]
- 16.Saccomandi P, Schena E, Giurazza F, Del Vescovo R, Caponero MA, Mortato L, Panzera F, Cazzato RL, Grasso FR, Di Matteo FM, Silvestri S, Zobel BB. Temperature monitoring and lesion volume estimation during double-applicator laser-induced thermotherapy in ex vivo swine pancreas: A preliminary study. Laser Med Sci. 2014;29(2):607–614. doi: 10.1007/s10103-013-1360-z. [DOI] [PubMed] [Google Scholar]
- 17.Schena E, Majocchi L. Assessment of temperature measurement error and its correction during Nd: YAG laser ablation in porcine pancreas. Int J Hyperther. 2014;30(5):328–334. doi: 10.3109/02656736.2014.928832. [DOI] [PubMed] [Google Scholar]
- 18.Taffoni F, Formica D, Saccomandi P, Di Pino G, Schena E. Optical fiber-based MR-compatible sensors for medical applications: An overview. Sensors. 2013;13(10):14105–14120. doi: 10.3390/s131014105. [DOI] [PMC free article] [PubMed] [Google Scholar]
- 19.Saccomandi P, Schena E, Silvestri S. Techniques for temperature monitoring during laser-induced thermotherapy: an overview. Int J Hyperther. 2013;29(7):609–619. doi: 10.3109/02656736.2013.832411. [DOI] [PubMed] [Google Scholar]