Abstract
The precise control of an ion channel’s gate by environmental stimuli is crucial to the fulfillment of its biological role. The gate in Slo1 channels is regulated by two separate stimuli, intracellular Ca2+ concentration and membrane voltage. Thus, Slo1 is central to understanding the relationship between intracellular Ca2+ and membrane excitability. Here we present the Slo1 structure in the absence of Ca2+ and compare it with the Ca2+-bound channel. Ca2+ binding at two unique binding sites per subunit stabilizes an expanded conformation of the Ca2+ sensor gating ring. These conformational changes are propagated from the gating ring to the pore through covalent linkers and through protein interfaces formed between the gating ring and the voltage sensors. The gating ring and voltage sensors are directly connected through these interfaces, which allow membrane voltage to regulate gating of the pore by influencing the Ca2+ sensors.
Introduction
This study attempts to understand how Ca2+ and membrane voltage regulate Slo1 channel opening. As in other voltage-dependent K+ channels, Slo1 channel open probability changes according to a sigmoidal shaped function of membrane voltage1. To a first approximation, higher intracellular Ca2+ concentrations shift the midpoint of this function so that the channels open at less depolarized voltages2. Viewed from a different but equally useful perspective, again to a first approximation, membrane depolarization increases the affinity of Ca2+ to open the channel3. What is the physical basis of this coupling between Ca2+ dependent and voltage-dependent activation? To address this question we have determined the structure of Slo1 in the absence of Ca2+ to compare with the structure in the presence of Ca2+ (ref companion paper). Large conformational changes within the Ca2+ sensor are transmitted to the pore and to the voltage sensor. The Ca2+-bound and Ca2+-free structures permit a physical model that rationalizes the influence that membrane voltage has on Ca2+ activation. The model also provides a framework for understanding Slo1 gating properties that extend beyond a first approximation description. These properties include multi-exponential dwell time distributions, cooperativity in Ca2+ activation, and degrees of coupling between the pore, Ca2+ sensors and voltage sensors3,4,5,6.
The conformational changes presented here are consistent with many but not all of the conclusions reached based on past mutagenesis data. Full consistency is impossible because different studies have put forth opposing conclusions on properties such as the degree and even direction of cooperative interaction in Ca2+ binding3,6,7 and degree of functional interaction between voltage sensors and Ca2+ sensors4,8. Thus, the mechanistic hypotheses put forth here are structure based and can be tested with further experimentation.
Structure of Slo1 in EDTA
Images of the frozen hydrated Aplysia californica Slo1 channel vitrified in the presence of 1 mM EDTA were recorded (Extended Data Fig. 1). Four distinct classes (EDTA structure classes) were generated with overall resolutions ranging from 3.8 to 4.1 Å. These are related to each other by a rotation of the transmembrane domain (TMD) up to 8° about the central four-fold axis of the channel (Extended Data Fig. 2a). The cytosolic tail domains (CTDs), which form the gating ring, are internally similar to one another and therefore focused refinement with a soft mask containing only the gating ring was used to improve this region, which resolved to 3.5 Å (Extended Data Fig. 3). By contrast, focused refinement of the TMD degraded features of the map, consistent with non-uniformity of structure in the TMD. The non-uniformity was most evident in the degree of S6 closure (Extended Data Fig. 2c–e). Consideration of the EDTA structure focuses on the class in which the inner helices have adopted the most closed conformation (Fig. 1b and Extended Data Fig. 2).
Figure 1. Comparison of Ca2+-bound and EDTA Slo1 structures.
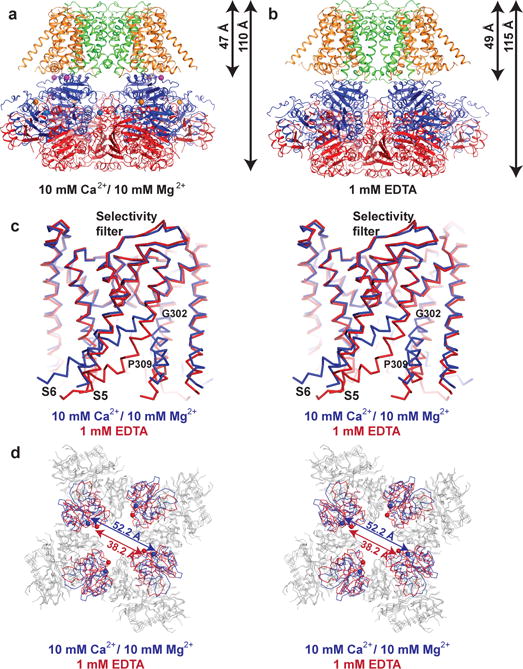
a, b, Ribbon diagrams of Ca2+-bound (a) and EDTA (b) Slo1 with individual domains colored uniquely (orange, VSD; green, pore domain; blue, RCK1; red, RCK2). c, Superposition of the Slo1 pore domain in the Ca2+-bound (blue) and EDTA (red) states aligned by their pore helices and selectivity filters. d, Superposition of the Slo1 gating rings in the Ca2+-bound (blue) and EDTA (red) states aligned by their RCK2 domains (grey). The spheres represent the locations of the Cα atom of K320.
Influence of Ca2+ and Mg2+ on Slo1
Ca2+ and Mg2+ have a major effect on the conformation of Slo1 that is most easily appreciated in a video comparing the Ca2+ and EDTA structures (Fig. 1a,b, Extended Data Fig. 4 and Supplementary Video 1). These ions induce a 5 Å shortening of the channel along its pore axis associated with a compression of the gating ring against the TMD (Fig. 1a,b). Accompanying this compression the S5 helices splay outward away from the pore axis and the S6 helices change their position and shape (Fig. 1c). The S6 helices, which line the ion conduction pathway, bend at P309 and project 8 Å further towards the cytoplasm in the EDTA structure. In the Ca2+ structure they bend instead at G302 near the selectivity filter. These differences account for a wide (minimum diameter 20 Å below P309) aqueous channel leading from the cytoplasm to the selectivity filter in the Ca2+ structure and a relatively narrower (minimum diameter 10 Å below P309) channel in the EDTA structure (Extended Data Fig. 2e).
Associated with conformational changes in the TMD, Ca2+ also induces conformational changes in the gating ring similar to those observed in gating ring only crystal structures9,10 (Fig. 1d). The RCK1 domain N-lobes of the gating ring, which face the TMD, tilt in a rigid body fashion away from the pore axis in the Ca2+ structure relative to the EDTA structure. The correlation of this expansion of the N-lobes with repositioning of S6 helices in the TMD is mediated at least in part through a polypeptide chain linkage that directly tethers the C-terminus of S6 to the N-terminus of the RCK1 N-lobe. In addition, protein interfacial interactions that will be discussed later also appear to mediate the propagation of conformational changes between the gating ring and TMD.
Chemical basis of Ca2+ activation
The structure shows clearly why Ca2+ binding to two sites per subunit on the gating ring causes the channel to open. One of these sites (Ca2+ bowl site) is located near the interface between RCK domains of adjacent subunits (Fig. 2a, b). When Ca2+ binds at this site acidic amino acid side-chains and main-chain carbonyl oxygen atoms from a loop on one subunit (called the Ca2+ bowl) cradle the ion from one side, while ion coordination is made complete through contribution of an asparagine residue (N438) borrowed from the RCK1 N-lobe of the adjacent subunit. To approach the Ca2+ ion within an appropriate ligand distance the RCK1 N-lobe has to move to its open conformation (Fig. 2b). The second Ca2+ site (RCK1 site) is located between the RCK1 N-lobe and the rest of the RCK1 domain from the same subunit (Fig. 2a, c). When Ca2+ binds at this site acidic amino acid side-chains and main-chain carbonyl oxygen atoms from the RCK1 domain surround most of the ion, but here again ion coordination is completed through the contribution of an aspartate residue (D356) borrowed from the RCK1 N-lobe. And again, an appropriate ligand distance requires the RCK1 N-lobe to adopt its open conformation (Fig. 2c). Thus, the coordination of Ca2+ at both sites shifts the equilibrium for the position of the RCK1 N-lobe, favoring its open conformation. In this manner the free energy of Ca2+ binding is directly converted to mechanical work to expand the RCK1 N-lobes and thus to open the pore.
Figure 2. Comparison of the Ca2+ binding sites.
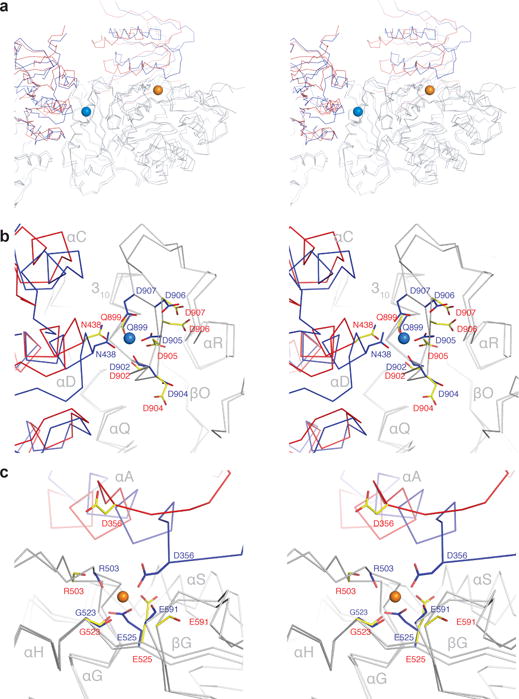
a, Stereo view of the Ca2+ binding sites in the Ca2+-bound (blue) and EDTA (red) states aligned by their RCK2 domains (grey). Spheres represent the Ca2+ bowl (marine blue) and RCK1 site (orange) ions in the Ca2+-bound state. b, c, Stereo view of the Ca2+ bowl site (b) and the Ca2+ RCK1 site (c) in the Ca2+-bound (blue) and EDTA (red) states.
As a result of the chemical interactions described above, tilting of an RCK1 N-lobe to its expanded conformation simultaneously completes both Ca2+ binding sites (Fig. 2a). This structural observation implies the existence of positive cooperativity between Ca2+ binding sites on the channel, because Ca2+ coordination at one site should tend to render the other site complete and thereby increase its affinity for Ca2+. A second possible source of non-independence in the functioning of the two unique Ca2+ binding sites can be found in their structural connectivity within a subunit. The side-chain of R503, whose main-chain carbonyl oxygen atom coordinates Ca2+ in the RCK1 site, forms an ionized hydrogen bond with E912 and a cation-π interaction with Y914 (ref companion paper). E912 and Y914 both reside on the Ca2+ bowl loop. Thus, the two Ca2+ binding sites within a single subunit are structurally connected to each other through these interactions. For this reason, Ca2+ binding at one site could possibly exert an influence on the other site.
The fundamental property of cooperativity between Ca2+ sites has been established on the basis of functional studies3,5,6,7,11,12,13,14. The underlying basis for this cooperativity has been unclear, especially since different studies using mutagenesis have reached different conclusions as to the magnitude and even the sign (positive or negative) of the cooperative interactions3,6,7. On the basis of the atomic structures we propose a mechanism for positive cooperative interactions between Ca2+ binding sites in the wild type channel. This mechanism entails a rigid body tilting of the RCK1 N-lobe that simultaneously completes both sites. We think that this mechanism, together with the multiplicity of sites, contributes to the high Hill coefficients that have been documented for Slo1 channels15,16,17.
Allosteric communication between gating ring and TMD
Ca2+ binding induces conformational changes in the gating ring that are transmitted to the pore. The polypeptide linkers connecting the RCK1 N-lobes to the S6 helices provide one obvious structural element for transmitting force from the gating ring to the pore (Fig. 3a). These linkers are partly α-helical and partly extended; their intrinsic structures are essentially identical in the Ca2+ and EDTA forms of the channel. They undergo a large positional displacement laterally, each as a rigid unit, in response to Ca2+-induced tilting of the RCK1 N-lobes. Based on mutational studies in which amino acids were deleted or added, the linker-gating ring complex has been described as a passive spring13. Given that the linkers do not lengthen perceptibly when Ca2+ binding expands the pore, any spring properties perhaps arise from within the gating ring or bending of the S6 helices when the channel opens.
Figure 3. Inter-domain interfaces.
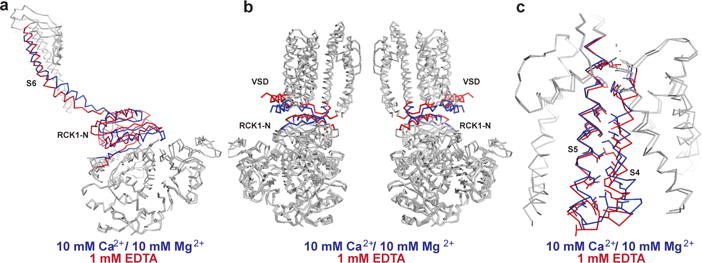
a, Superposition of a single subunit aligned by the RCK2 domains. S6 and RCK1 N-lobe are colored blue in the Ca2+-bound state and red in the EDTA state. b, Superposition of Ca2+-bound (blue) and EDTA (red) states aligned by their RCK2 domains with front and rear subunits of the TMD and gating ring removed. c, Superposition of the TMD of a single subunit aligned by the pore helix and selectivity filter. S4 and S5 are colored blue in the Ca2+-bound state and red in the EDTA state. Interacting residues on S4 and S5 are shown as sticks.
The RCK1 N-lobes also form a specific protein-protein interface (585 Å2 per subunit in the Ca2+ structure) with the voltage sensors and the S4–S5 linkers that connect the voltage sensors to the pore (Figs. 3b and 4). Ca2+-induced conformational changes in the gating ring alter these interfaces and produce an outward (away from the pore axis) displacement of the voltage sensors near their cytoplasmic surface where they contact the RCK1 N-lobes (Figs. 3b and 4). The S4 helices shift slightly but maintain their relative proximity to the S5 helices, suggesting that strong favorable interactions between S4 and S5 resist their coming apart (Fig. 3c). Consequently, the outward (laterally away from the pore) displacement of the voltage sensors and S4–S5 linkers produces a similar outward displacement of the S5 helices near the cytoplasmic surface (Figs. 3c and 4). Thus it appears that Ca2+-induced tilting of the RCK1 N-lobes transmits force to the pore through two pathways, one that directly pulls open the S6 helices through covalent linker attachments and the other that is indirectly mediated through non-covalent protein-protein interfaces formed between the RCK1 N-lobes and the voltage sensors/S4–S5 linkers. The latter pathway splays open the voltage sensors and S5 helices, the former simultaneously pulls open the S6 helices.
Figure 4. Voltage sensor-RCK1 N-lobe interface.
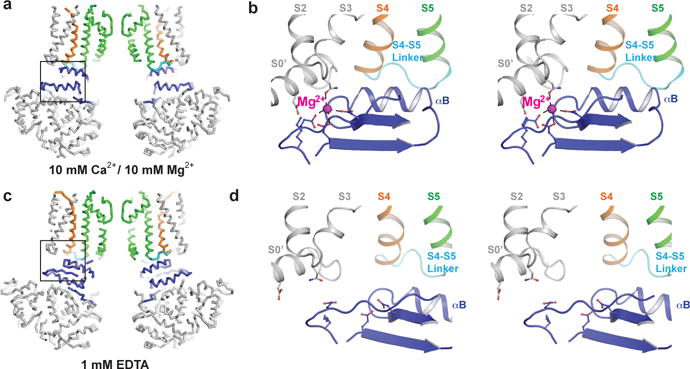
a, c, Wire diagram of Ca2+-bound (a) and EDTA (c) states with front and rear subunits of the TMD and gating ring removed. S4 is colored orange, S4–S5 linker cyan, pore domain green, RCK1 N-lobe blue and remaining residues grey. b, d, Stereo view of voltage-sensor-RCK1 interface of Ca2+-bound (b) and EDTA (d) states. The Mg2+ ion is shown as a magenta sphere in the Ca2+-bound state. Residues that form the Mg2+ coordination site are shown as sticks.
The organization of functional domains in Slo1 gives rise to a source of inter-subunit cooperativity. Because voltage sensors are not domain-swapped (i.e. voltage sensors contact pore domains from the same polypeptide chain) and RCK domains in the gating ring are domain-swapped, each RCK1 N-lobe exerts force on two subunits simultaneously. Consider for example the Ca2+-induced tilting of a specific RCK1 N-lobe: while it pulls on the S6 helix from its own subunit, at the same time it splays the voltage sensor/S4–S5 linker from an adjacent subunit by virtue of its domain-swapped disposition with respect to the TMD. The applied action of each RCK1 N-lobe onto two adjacent TMD subunits provides a basis for understanding the inter-subunit cooperativity of Ca2+ activation that has been demonstrated experimentally3,5,6,7,11,12,14,16.
Regulation by voltage
The above description focused on the gating ring-voltage sensor interface as a conduit for Ca2+ activation of the pore. The same interface also appears poised to transmit conformational changes that occur within the voltage sensors to regulate gating. The S4–S5 linker is one of the key structural elements on the TMD side of the interface and therefore movements of S4 helices should directly impinge on movements of the RCK1 N-lobes on the gating ring. The interface also contains a Mg2+ ion, whose binding site was predicted by mutagenesis studies10,15,18,19,20,21,22,23. In the Ca2+ structure the Mg2+ ion mediates multiple interactions that bridge the RCK1 N-lobe to the TMD via helix S0’ and the S2–S3 linker (Fig. 4b).
Figure 5 compares the conformations of the voltage sensors in the Ca2+ and EDTA structures. In EDTA the S4 helix is shifted approximately 2 Å towards the cytoplasm. This change is mediated by differences in the chemical environment (EDTA versus Ca2+) rather than membrane voltage, however, the shift occurred in the expected direction: channel closure is associated with a downward movement of gating charges. The shift occurred in this case because movement of the RCK1 N-lobes, mediated by the absence versus presence of Ca2+, is coupled to movement of the voltage sensors. Through the same coupling we would expect that voltage sensor movements driven primarily by the membrane electric field should move the RCK1 N-lobes, or at least apply a bias to their preferred position. Thus, we hypothesize that voltage-dependent gating in Slo1, at least to some extent, is mediated through voltage sensor regulation of the Ca2+ sensor.
Figure 5. Stereo view of the voltage sensor domain.
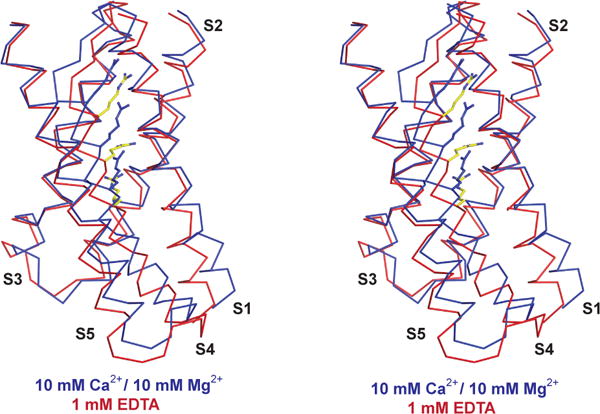
Voltage sensor of the Ca2+-bound (blue) and EDTA (red) states aligned by the pore helix and selectivity filter. Arginine side-chains on S4 are shown as sticks.
The above reasoning is based on the correlation between Ca2+-activation and the direction of voltage sensor movement rather than the degree or nature of the movement. It appears that arginine residues reach towards the same negative charged residues in both voltage sensor structures. If the membrane electric field during hyperpolarization were the primary driving force for conformational change we would expect the arginine residues to alter their side-chain rotamer conformation (i.e. to reach down) to establish new ion pairs. With reorientation of arginine side-chains the small displacement of the S4 helix observed here might be sufficient to account for the voltage-dependence of Slo1 gating. Given the facts considered in the companion paper: weak voltage-dependence with small gating charge displacement currents, a short S4–S5 linker, close packing of the S4 and S5 helices, and an incomplete gating charge transfer center, we suspect that the voltage sensor in Slo1 has evolved to be a modifier of the Ca2+ sensor through small movements that bias the conformation of the RCK1 N-lobe (ref companion paper).
Discussion
Structures of the Slo1 channel in the presence and absence of Ca2+ and Mg2+ suggest that pore opening is regulated primarily through the position of four RCK1 N-lobes on the gating ring. Ca2+ binding sites and voltage sensors determine the position of the RCK1 N-lobes. Thus, we propose that the RCK1 N-lobes are a nexus for both forms of channel regulation, as depicted (Fig. 6). At an intuitive level this proposal provides a physical basis for understanding why membrane voltage influences the Ca2+ affinity for channel activation. Membrane depolarization will favor an open conformation of the RCK1 N-lobes, which will favor a Ca2+-bound conformation of the binding sites and thus increase their apparent affinity. Similarly, Ca2+ binding will favor a depolarized conformation of the voltage sensors. This description is meant to capture an important property of the structures; that the voltage sensor communicates with the Ca2+ sensor. However, experiments under extreme conditions of voltage and Ca2+ have shown that each sensor to some degree can work independently to regulate the pore4,23,24.
Figure 6. Model of Slo1 gating by Ca2+ and voltage.
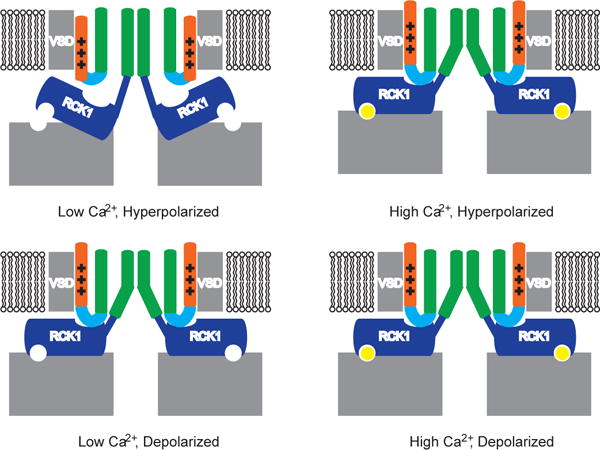
In a hyperpolarized membrane in the absence of Ca2+, the Ca2+ sites are empty, the RCK1 N-lobes adopt a closed conformation, the voltage sensors are down and the pore is closed. In a hyperpolarized membrane in the presence of high Ca2+, the Ca2+ sites are occupied, the RCK1 N-lobes adopt an open conformation and the voltage sensors tend toward an up conformation and the pore is open. In a depolarized membrane in the absence of Ca2+, the Ca2+ sites are empty, the voltage sensors are up and the RCK1 N-lobes tend toward an open conformation and the pore is open. In a depolarized membrane in the presence of Ca2+, the Ca2+ sites are occupied, the voltage sensors are up and the RCK1 N-lobes adopt an open conformation and the pore is open.
The structures and our interpretation of them are compatible with the two most prominent features of Ca2+-mediated gating in Slo1 channels: the multiplicity of Ca2+ sites and the cooperativity between them3,6,7,25,26,27. Closed state dwell time distributions as a function of Ca2+ concentration forecast the existence of multiple Ca2+ sites17,28,29. Mutagenesis studies then predicted two distinct sites per subunit, eight in total25,26,27,30. The dependence of both sites on the conformation of an RCK1 N-lobe naturally accounts for the existence of cooperativity between the sites.
The EDTA and Ca2+ structures are both 4-fold symmetric and might therefore suggest a mechanism whereby a highly concerted transition occurs upon opening. Even without symmetry restraints asymmetric classes were not observed. However, this study addressed only extreme conditions of low and high Ca2+ (and Mg2+). Based on the structures alone we see no reason why intermediate, asymmetric conformations could not exist. We posit that the probability of pore opening is a function of the state of the gating ring, which would be defined by the occupancy of its Ca2+ sites and conformations of the voltage sensors. We further imagine that under any given condition of Ca2+ and membrane voltage the gating ring would exhibit a distribution of states. This physical description would be in keeping with the multi-exponential distribution of closed states, with cooperative activation by Ca2+ and with the interplay between Ca2+ and membrane voltage to activate the channel17,28,29. This physical description is also in keeping with thermodynamic and kinetic models of Slo1 gating that have been developed over many years4,5,17.
In a model called the HA allosteric model Slo1 is treated as a K+ pore in which gating is linked by energetic coupling constants to the conformational state of Ca2+ sensors and voltage sensors4. In the context of this model we can inspect the physical basis of the linkage between the pore and its sensor modules. The Ca2+ sensors – or gating ring, with its multiple Ca2+ binding sites – are linked directly to the pore through the S6 linkers and indirectly through the non-covalent interfaces formed between the RCK1 N-lobes and the voltage sensors/S4–S5 linkers (Fig. 3). The voltage sensors are linked to the pore directly through interactions between S4 and S5 helices and indirectly through the same voltage sensor-gating ring interfaces. Given the well-formed interface between the S4–S5 linker and the RCK1 N-lobe we suspect that the coupling between the Ca2+ sensor and the voltage sensor is likely to be strong (Fig. 4). This coupling would not preclude additional direct coupling between the voltage sensor and the pore, which is a prominent feature of the HA allosteric model strongly supported by functional data4. In the present study we have only manipulated Ca2+ (and Mg2+) and therefore a real understanding of voltage sensor movements must await structural studies in electric fields.
Many K+ channels are known to close through constriction of the S6 (inner) helices. The S6-lined region of the pore is not constricted sufficiently in the EDTA structure to prevent ions from reaching the selectivity filter from the cytoplasm. This observation is consistent with the demonstrated accessibility of large organic molecules to the central cavity (below the selectivity filter) in the closed conformation of Slo1 channels31,32,33,34. To explain closure it has been proposed that S6 helix displacements are coupled to changes in the selectivity filter to prevent ion conduction31,32,33. The EDTA structure is consistent with such a mechanism at least in terms of the S6 helices being too open to preclude ion passage (the selectivity filter is unchanged from the open structure). However, we consider the issue of gate location still unsettled. The EDTA structure is the most closed in a distribution of structural classes (Extended Data Fig. 2). It is possible we have not resolved the fully closed pore. The closed gating ring only crystal structure is 3 Å narrower at the N-terminus of the RCK1 N-lobe, which might suggest that further closure is possible (Extended Data Fig. 5)9.
Methods
Cloning, expression and purification of the EDTA states
A synthetic gene fragment (Bio Basic, Inc.) encoding residues 1 to 1070 of Aplysia californica Slo1 channel was ligated into the XhoI/EcoRI cloning sites of a modified pFastBac vector (Invitrogen). The resulting protein has green fluorescent protein (GFP) and a 1D4 antibody recognition sequence (TETSQVAPA) on the C-terminus35, separated by a PreScission protease cleavage site (SNSLEVLFQ/GP).
For large-scale expression, High Five cells at a density of 1×10⁶/ml were infected with 3% (v:v) baculovirus and cultured at 27°C in sf-900 II SFM medium (Invitrogen) for 48 hours before harvesting. Cells were gently disrupted by stirring in a hypotonic solution containing 10 mM Tris-HCl pH 8.0, 3 mM dithiothreitol (DTT), 1 mM EDTA supplemented with protease inhibitors including 0.1 μg/ml pepstatin A, 1 μg/ml leupeptin, 1 μg/ml aprotinin, 0.1 mg/ml soy trypsin inhibitor, 1 mM benzamidine, 0.1 mg/ml 4-(2-Aminoethyl) benzenesulfonyl fluoride hydrochloride (AEBSF) and 1 mM phenylmethysulfonyl fluoride (PMSF). Cell lysate was then centrifuged for 30 min at 30,000 g and pellet was homogenized in a buffer containing 20 mM Tris-HCl pH 8.0, 320 mM KCl, 1 mM EDTA supplemented with protease inhibitors including 0.1 μg/ml pepstatin A, 1 μg/ml leupeptin, 1 μg/ml aprotinin, 0.1 mg/ml soy trypsin inhibitor, 1 mM benzamidine, 0.1 mg/ml AEBSF and 0.2 mM PMSF. The lysate was extracted with 1% (w:v) n-Dodecyl-β-D-Maltopyranoside (DDM) and 0.2% (w:v) Cholesterol Hemisuccinate (CHS) for an hour with stirring and then centrifuged for 40 min at 30,000 g. Supernatant was added to GFP nanobody-conjugated affinity resin (CNBr-activated Sepharose 4B resin from GE Healthcare) pre-equilibrated with wash buffer (20 mM Tris-HCl pH 8.0, 320 mM KCl, 1 mM EDTA, 0.2% DDM, 0.04% CHS, 0.1 μg/ml pepstatin A, 1 μg/ml aprotinin and 0.1 mg/ml soy trypsin inhibitor)36,37. The suspension was mixed by inversion for ~2 hours. Beads were first washed with 10 column volumes of wash buffer in batch mode and then collected on a column by gravity, washed with another 10 column volumes of wash buffer. The protein was then digested on resin with PreScission protease (~20:1 w:w ratio) overnight with gentle rocking. Flow-through was then collected, concentrated and further purified on a Superose-6 size exclusion column in 20 mM Tris-HCl pH 8.0, 450 mM KCl, 1 mM EDTA, 20 mM DTT, 2 mM tris (2-carboxyethyl) phosphine (TCEP), 0.1 μg/ml pepstatin A, 1 μg/ml aprotinin, 0.025% DDM and 0.005% CHS. All purification procedures were carried out either on ice or at 4 °C. The peak fractions corresponding to the tetrameric Slo1 channel was concentrated to about 7 mg/ml and used for preparation of cryo-EM sample grids.
Electron microscopy sample preparation and imaging of EDTA structures
3.5 μl of purified channel in the presence of 1 mM EDTA was pipetted onto a glow discharged copper C-flat grids (Protochips). Grids were blotted for 4s at ~88% humidity and flash frozen in liquid nitrogen-cooled liquid ethane using an FEI Vitrobot Mark IV (FEI). Grids were transferred to an FEI Titan Krios (FEI) electron microscope operating at an acceleration voltage of 300 keV. Images were recorded in an automated fashion on a Gatan K2 Summit (Gatan) detector set to super-resolution counting mode with a super-resolution pixel size of 0.675 Å using SerialEM38. Images were recorded for 15 seconds with a sub-frame exposure time of 300 ms and a dose of ~4.5 electrons per Å2 per second (~1.4 electrons per Å2 per sub-frame) at the specimen level and ~8 electrons per pixel per second at the detector. Total accumulated dose was ~68 electrons per Å2.
Image processing and map calculation
Dose-fractionated super-resolution images were 2 × 2 down sampled by Fourier cropping (final pixel size of 1.35 Å) for whole-frame motion correction and dose filtration with unblur39. ~4,000 particles were manually selected using RELION to generate templates for automated particle selection40. Following automated particle selection in RELION, false positives were manually eliminated, resulting in 637,592 particles from 4,748 images. 256 × 256 pixel particle images were extracted from the motion-corrected and dose-filtered images in RELION. The parameters of the contrast transfer function were estimated by ctffind441.
The initial set of 637,592 particles were subjected to 2D classification in RELION to remove particles belonging to low-abundance classes and to generate projection averages for initial model generation using EMAN242. 3D classification was used to sort the remaining 453,775 particles into six classes. Three of the resulting classes, comprising 230,242 particles, appeared similar and were combined. Rotations and translations were determined for the 230,242 particles by using the 3D auto-refine algorithm of RELION, resulting in a map that achieved an overall resolution of 3.8 Å. The density was very clear for the gating ring, but was very poor for the TMD. To improve the density corresponding to the gating ring, a soft mask was generated that encompassed the gating ring and used throughout a RELION auto-refine run. The rotation and translational parameters determined by RELION for the three classes were used as the input for 30 additional cycles of refinement by FREALIGN43, during which the resolution of the reference used for alignment of the particle images was limited to 6 Å to minimize over refinement, resulting in a map that achieved a resolution of 3.5 Å as assessed by Fourier shell correlation using the 0.143 cut-off criterion44. Assuming that the poor density of the TMD was a result of conformational flexibility, another round of 3D classification using the rotational and transitional parameters determined by the auto-refine run was performed to further sort the particles into 6 classes. Of the resulting classes, four contained interpretable density for the TMD and were selected for independent refinement in RELION. The rotation and translational parameters determined by RELION for the four classes were used as the input for 10–30 additional cycles of refinement by FREALIGN, during which the resolution of the reference used for alignment of the particle images was limited to 6 Å to minimize over refinement, resulting in maps that achieved a resolution of 3.8–4.1 Å as assessed by Fourier shell correlation using the 0.143 cut-off criterion44. To improve the resolution of the EDTA reconstruction, per-particle frame alignment was performed using LM-BFGS45, followed by 2D and 3D classification in RELION. The particles that belonged to a class that closely resembled the EDTA 4 state were selected for auto-refinement in RELION. The rotation and translational parameters determined by RELION were used as the input for 30 additional cycles of refinement by FREALIGN40, during which the resolution of the reference used for alignment of the particle images was limited to 6 Å to minimize over refinement, resulting in a map that achieved a resolution of 3.8 Å as assessed by Fourier shell correlation using the 0.143 cut-off criterion41.
Local resolution estimates were calculated with ResMap46. The map was sharpened using an isotropic b-factor of −200 Å2 prior to model building and coordinate refinement. The final map was sharpened to best fit the molecular transform of the refined atomic model by diffmap (grigoriefflab.janelia.org/diffmap).
Model building and coordinate refinement
The structure of the closed human Slo1 gating ring (PDB code: 3NAF)9 was docked into the focused refinement cryo-EM density map using UCSF Chimera47 and then manually rebuilt in coot48 to fit the density.
The cryo-EM density map of one of the half-maps corresponding to a new smaller unit cell that extended 5 Å from the model in all directions was extracted. Cycles of real space refinement using phenix.real_space_refine49 with P4 symmetry imposed and reciprocal space refinement using REFMAC50 with P4 symmetry imposed were alternated with manual rebuilding in coot. Geometric and secondary structure restraints were tightly maintained throughout refinement to minimize over fitting. To monitor the effects of over fitting, the Fourier shell correlation of the refined model was determined for the half-map used during refinement (FSC work) and the half-map that was not used at any point during refinement (FSC free) (Extended Data Fig. 6).
The refined model of the gating ring and the refined model of Ca2+-bound Aplysia californica Slo1 TMD were docked into the unpolished density maps for EDTA classes 1,2 and 3 and the polished density map of EDTA class 4 using UCSF Chimera and then manually rebuilt in coot to fit the density. The models were refined in real and reciprocal space against one of the half-maps to the overall resolution of the corresponding whole map, while monitoring the effects of over fitting using the second half-map (Extended Data Fig. 6). Representative sections of the density for the polished EDTA class 4 map and the gating ring focused refined map with the refined models are shown in Extended Data Figure 7. All structure calculations were performed using software compiled by SBGrid51. Structure figures were prepared with UCSF Chimera and Pymol (Pymol version 1.7.2 Schrodinger LLC).
Extended Data
Extended Data Figure 1. Cryo-EM reconstructions of aplysia Slo1 in four EDTA classes.
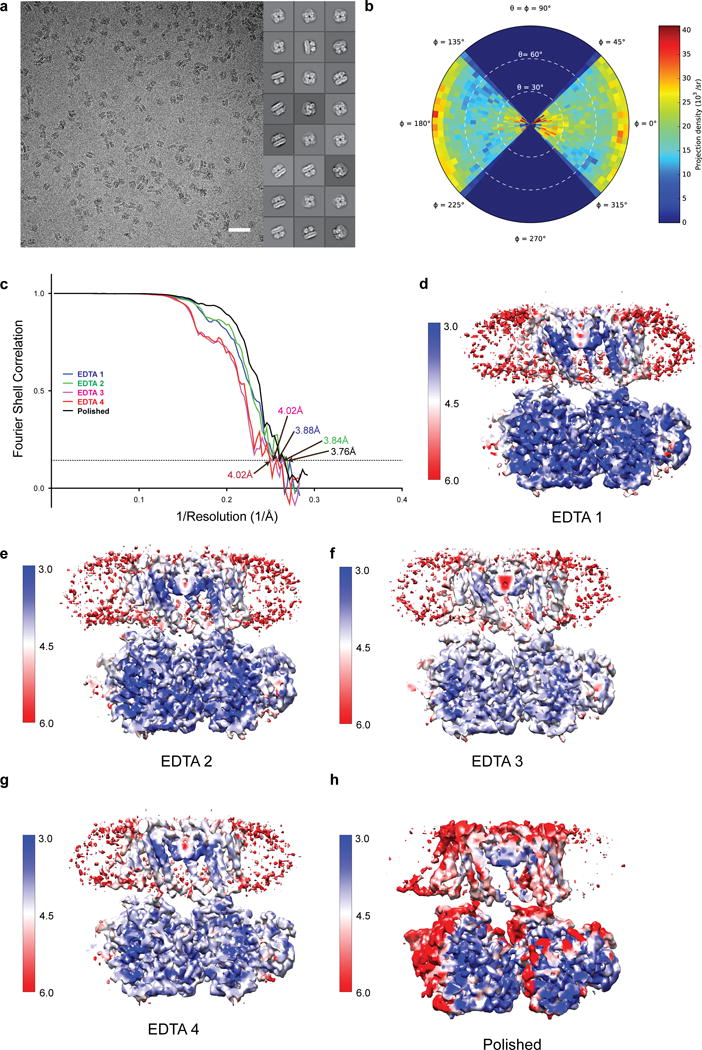
a, Representative image and 2D class averages of vitrified aplysia Slo1. Scale bar is 500 Å. b, Angular distribution plot for EDTA 4 following per-particle polishing. c, Fourier shell correlation curves for aplysia Slo1 in four EDTA states with overall resolutions estimated to be 3.88 Å (EDTA 1 – blue), 3.84 Å (EDTA 2 – green), 4.02 Å (EDTA 3 – pink), 4.02 Å (EDTA 4 – red) and 3.76 Å (EDTA 4 following per-particle polishing) on the basis of the FSC = 0.143 (dashed line) cut-off criterion. d–h, Section of the cryo-EM density maps of EDTA 1 (d), EDTA 2 (e), EDTA 3 (f), EDTA 4 (g) and EDTA 4 following per-particle polishing (h) colored by local resolution (in ångstroms).
Extended Data Figure 2. Cryo-EM structure of EDTA aplysia Slo1.
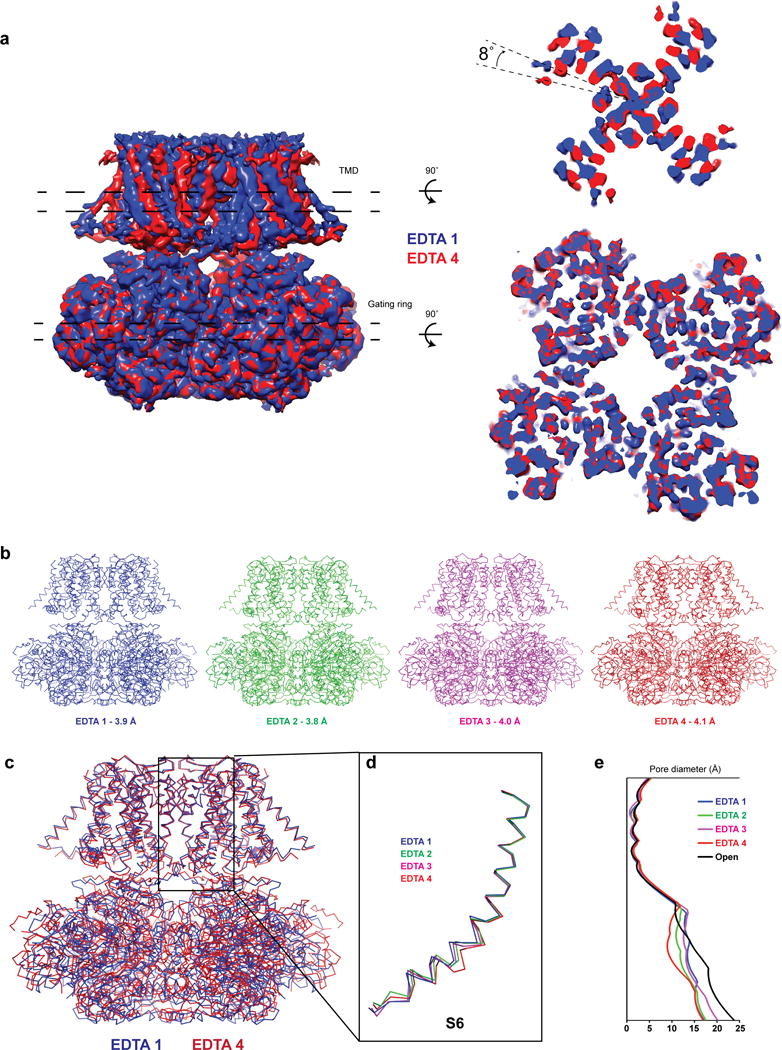
a, Cryo-EM density maps of two conformations of EDTA Slo1 aligned by their gating rings. The density slices correspond to the regions between the dashed lines in the TMD and the gating ring. b, Wire diagrams of EDTA Slo1 in four different conformations. c, Superposition of two EDTA Slo1 conformations aligned by their pore helices and selectivity filters. d, Superposition of the inner (S6) helices of the four EDTA Slo1 states aligned by their pore helices and selectivity filters. e, Plot of pore diameter along the length of the pore in the TMD for the four EDTA and the open Slo1 states.
Extended Data Figure 3. Cryo-EM reconstruction of aplysia Slo1 gating ring in the EDTA state.
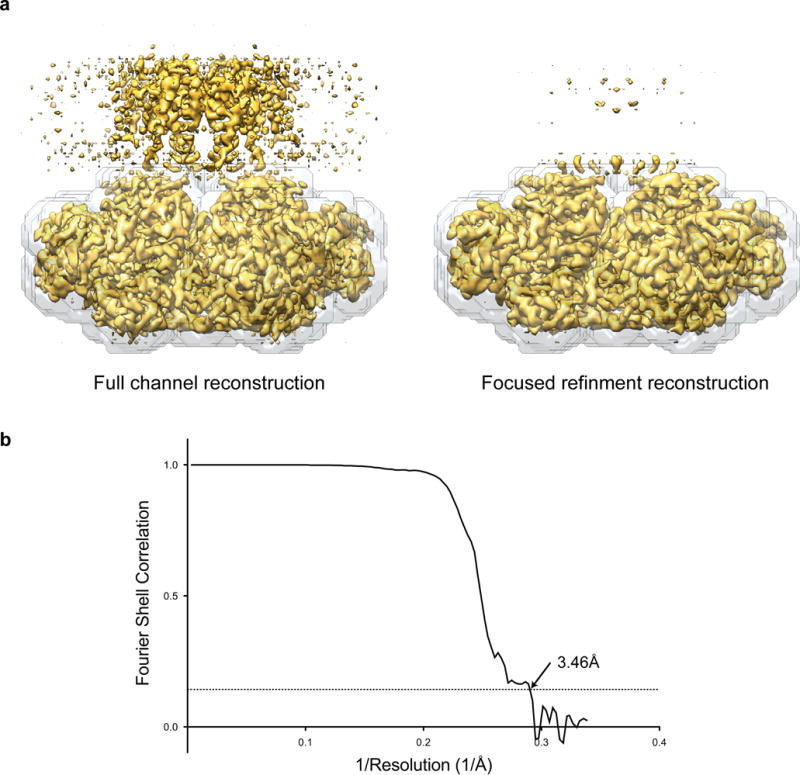
a, Cryo-EM density map of Slo1 gating ring in the EDTA state from the full channel reconstruction and following focused refinement. The mask used for focused refinement is shown as a grey transparent surface. b, Fourier shell correlation curves for focused refinement of the Slo1 gating ring with overall resolution estimated to be 3.46 Å on the basis of the FSC = 0.143 (dashed line) cut-off criterion.
Extended Data Figure 4. Comparison of cryo-EM reconstructions of aplysia Slo1 in the Ca2+-bound and EDTA states.
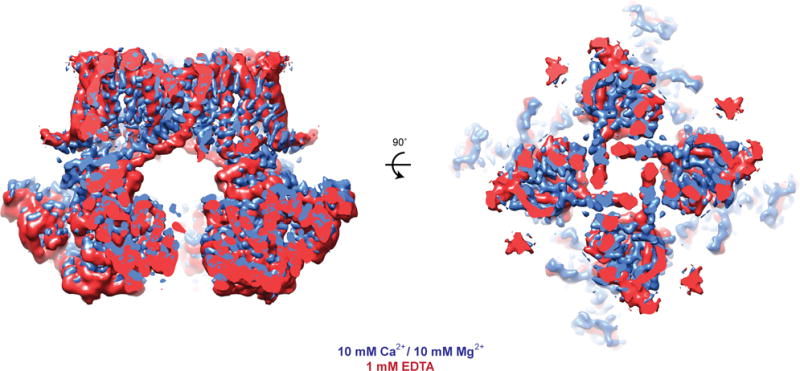
Sections of cryo-EM density of aplysia Slo1 in the Ca2+-bound (blue) and the EDTA (red) states aligned by their TMDs.
Extended Data Figure 5. Comparison of the aplysia Slo1 EDTA state with closed human Slo1 gating ring.
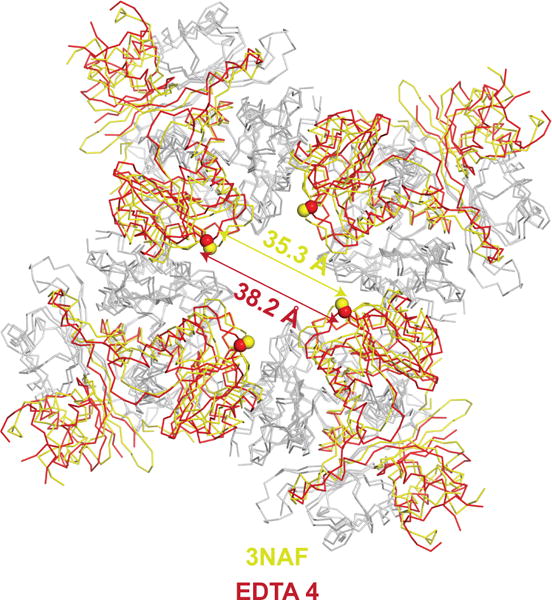
Superposition the aplysia Slo1 EDTA state (red) with closed human Slo1 gating ring (PDB ID:3NAF, yellow) aligned by their RCK2 domains (grey). The spheres represent the locations of the Cα atom of K320 of each subunit.
Extended Data Figure 6. Validation of the refined models.
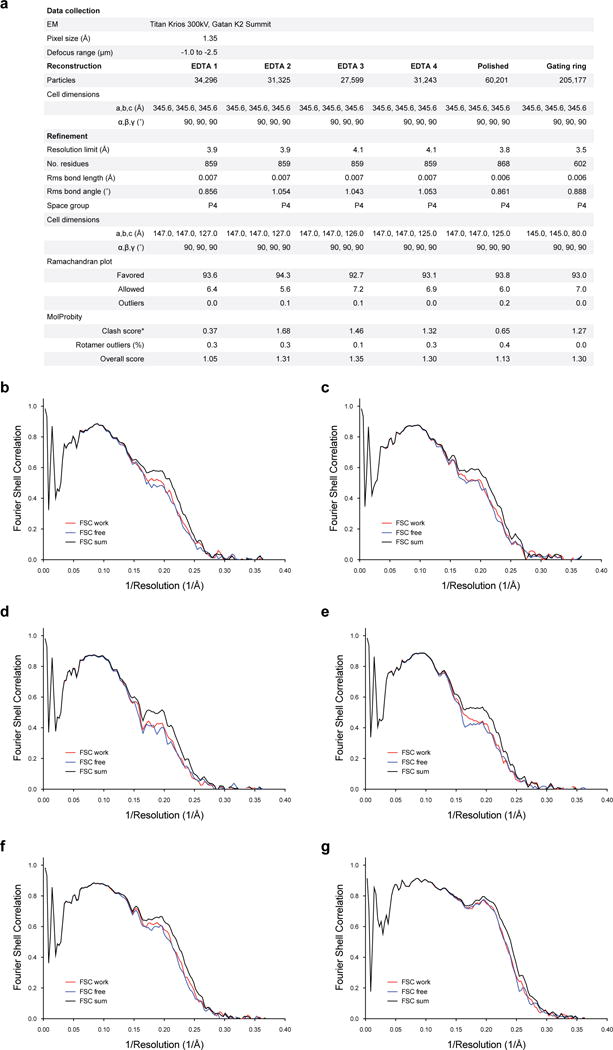
a, Refinement statistics for EDTA Slo1 models. b–g, Fourier shell correlation curves of refined model versus unmasked map for cross-validation of EDTA 1 (b), EDTA 2 (c), EDTA 3 (d), EDTA 4 (e), EDTA 4 following per-particle polishing (f) and the focused refined gating ring (g). The black curves are the refined model compared to the full data set, the red curves are the refined model compared to half-map 1 (used during refinement) and the blue curves are the refined model compared to half-map 2 (not used during refinement).
Extended Data Figure 7. Representative segments of cryo-EM density.
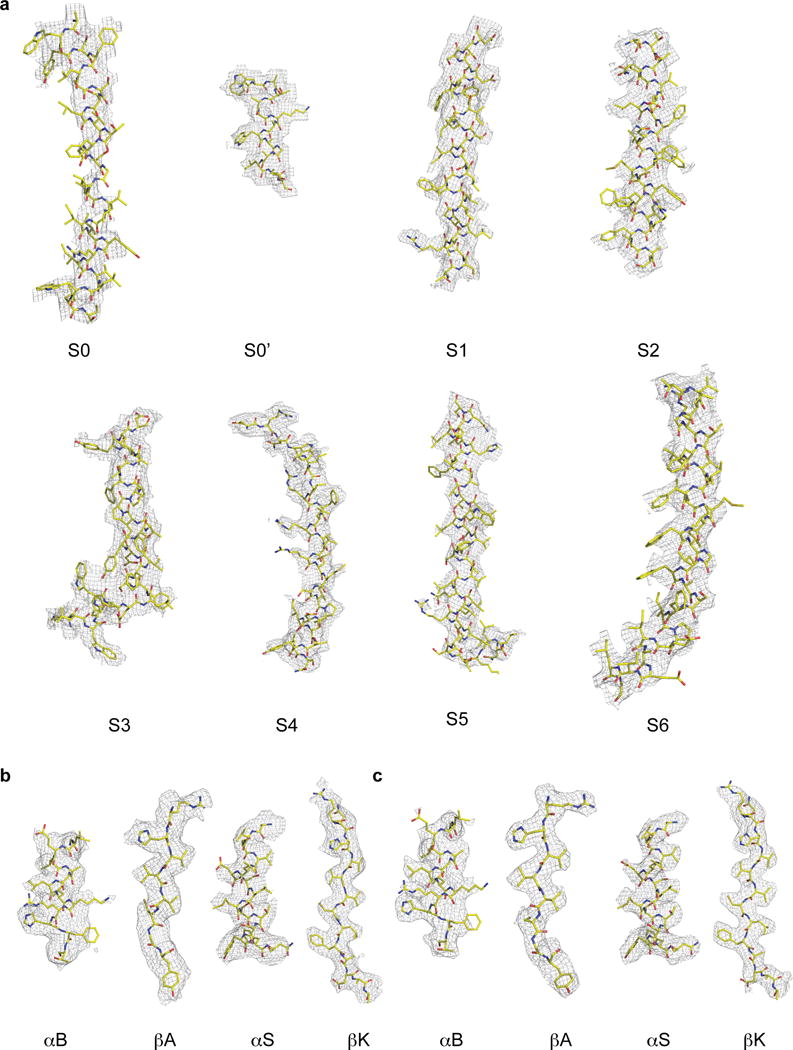
Selected density fragments from the TMD (a) and gating ring (b) of EDTA 4 following per-particle polishing and the focused refinement gating ring map (c).
Supplementary Material
Acknowledgments
We thank Z. Yu and R. Huang at the Howard Hughes Medical Institute Janelia Cryo-EM facility for assistance in data collection; R.W. Aldrich (University of Texas at Austin) for comments on the manuscript and members of the MacKinnon lab for assistance. This work was supported in part by GM43949. R.K.H. is a Howard Hughes Medical Institute postdoctoral fellow of the Helen Hay Whitney Foundation and R.M. is an investigator of the Howard Hughes Medical Institute.
Footnotes
Contributions R.K.H. and X.T. performed the experiments. R.K.H., X.T. and R.M. designed the experiments, analyzed the results and prepared the manuscript.
Competing financial interests The authors declare no competing financial interests.
The 3D cryo-EM density maps of EDTA Slo1 with low-pass filter and amplitude modification have been deposited in the Electron Microscopy Data Bank under accession numbers EMD-8141. Atomic coordinates for EDTA Slo1 have been deposited in the Protein Data Bank under accession numbers 5TJI.
References
- 1.Hille B. Ion channels of excitable membranes. 3rd. Sinauer; 2001. [Google Scholar]
- 2.Pallotta BS, Magleby KL, Barrett JN. Single channel recordings of Ca2+-activated K+ currents in rat muscle cell culture. Nature. 1981;293:471–474. doi: 10.1038/293471a0. [DOI] [PubMed] [Google Scholar]
- 3.Sweet TB, Cox DH. Measurements of the BKCa channel’s high-affinity Ca2+ binding constants: effects of membrane voltage. J Gen Physiol. 2008;132:491–505. doi: 10.1085/jgp.200810094. [DOI] [PMC free article] [PubMed] [Google Scholar]
- 4.Horrigan FT, Aldrich RW. Coupling between voltage sensor activation, Ca2+ binding and channel opening in large conductance (BK) potassium channels. J Gen Physiol. 2002;120:267–305. doi: 10.1085/jgp.20028605. [DOI] [PMC free article] [PubMed] [Google Scholar]
- 5.McManus OB, Magleby KL. Kinetic states and modes of single large-conductance calcium-activated potassium channels in cultured rat skeletal muscle. J Physiol. 1988;402:79–120. doi: 10.1113/jphysiol.1988.sp017195. [DOI] [PMC free article] [PubMed] [Google Scholar]
- 6.Qian X, Niu X, Magleby KL. Intra- and intersubunit cooperativity in activation of BK channels by Ca2+ J Gen Physiol. 2006;128:389–404. doi: 10.1085/jgp.200609486. [DOI] [PMC free article] [PubMed] [Google Scholar]
- 7.Savalli N, Pantazis A, Yusifov T, Sigg D, Olcese R. The contribution of RCK domains to human BK channel allosteric activation. J Biol Chem. 2012;287:21741–21750. doi: 10.1074/jbc.M112.346171. [DOI] [PMC free article] [PubMed] [Google Scholar]
- 8.Carrasquel-Ursulaez W, et al. Hydrophobic interaction between contiguous residues in the S6 transmembrane segment acts as a stimuli integration node in the BK channel. J Gen Physiol. 2015;145:61–74. doi: 10.1085/jgp.201411194. [DOI] [PMC free article] [PubMed] [Google Scholar]
- 9.Wu Y, Yang Y, Ye S, Jiang Y. Structure of the gating ring from the human large-conductance Ca(2+)-gated K(+) channel. Nature. 2010;466:393–397. doi: 10.1038/nature09252. [DOI] [PMC free article] [PubMed] [Google Scholar]
- 10.Yuan P, Leonetti MD, Hsiung Y, MacKinnon R. Open structure of the Ca2+ gating ring in the high-conductance Ca2+-activated K+ channel. Nature. 2012;481:94–97. doi: 10.1038/nature10670. [DOI] [PMC free article] [PubMed] [Google Scholar]
- 11.Latorre R, Vergara C, Hidalgo C. Reconstitution in planar lipid bilayers of a Ca2+-dependent K+ channel from transverse tubule membranes isolated from rabbit skeletal muscle. Proc Natl Acad Sci U S A. 1982;79:805–809. doi: 10.1073/pnas.79.3.805. [DOI] [PMC free article] [PubMed] [Google Scholar]
- 12.Moczydlowski E, Latorre R. Gating kinetics of Ca2+-activated K+ channels from rat muscle incorporated into planar lipid bilayers. Evidence for two voltage-dependent Ca2+ binding reactions. J Gen Physiol. 1983;82:511–542. doi: 10.1085/jgp.82.4.511. [DOI] [PMC free article] [PubMed] [Google Scholar]
- 13.Niu X, Qian X, Magleby KL. Linker-gating ring complex as passive spring and Ca(2+)-dependent machine for a voltage- and Ca(2+)-activated potassium channel. Neuron. 2004;42:745–756. doi: 10.1016/j.neuron.2004.05.001. [DOI] [PubMed] [Google Scholar]
- 14.Rothberg BS, Magleby KL. Gating kinetics of single large-conductance Ca2+-activated K+ channels in high Ca2+ suggest a two-tiered allosteric gating mechanism. J Gen Physiol. 1999;114:93–124. doi: 10.1085/jgp.114.1.93. [DOI] [PMC free article] [PubMed] [Google Scholar]
- 15.Golowasch J, Kirkwood A, Miller C. Allosteric effects of Mg2+ on the gating of Ca2+-activated K+ channels from mammalian skeletal muscle. J Exp Biol. 1986;124:5–13. doi: 10.1242/jeb.124.1.5. [DOI] [PubMed] [Google Scholar]
- 16.Niu X, Magleby KL. Stepwise contribution of each subunit to the cooperative activation of BK channels by Ca2+ Proc Natl Acad Sci U S A. 2002;99:11441–11446. doi: 10.1073/pnas.172254699. [DOI] [PMC free article] [PubMed] [Google Scholar]
- 17.Rothberg BS, Magleby KL. Kinetic structure of large-conductance Ca2+-activated K+ channels suggests that the gating includes transitions through intermediate or secondary states. A mechanism for flickers. J Gen Physiol. 1998;111:751–780. doi: 10.1085/jgp.111.6.751. [DOI] [PMC free article] [PubMed] [Google Scholar]
- 18.Yang H, et al. Activation of Slo1 BK channels by Mg2+ coordinated between the voltage sensor and RCK1 domains. Nat Struct Mol Biol. 2008;15:1152–1159. doi: 10.1038/nsmb.1507. [DOI] [PMC free article] [PubMed] [Google Scholar]
- 19.Yang H, et al. Mg2+ mediates interaction between the voltage sensor and cytosolic domain to activate BK channels. Proc Natl Acad Sci U S A. 2007;104:18270–18275. doi: 10.1073/pnas.0705873104. [DOI] [PMC free article] [PubMed] [Google Scholar]
- 20.Horrigan FT, Ma Z. Mg2+ enhances voltage sensor/gate coupling in BK channels. J Gen Physiol. 2008;131:13–32. doi: 10.1085/jgp.200709877. [DOI] [PMC free article] [PubMed] [Google Scholar]
- 21.Yang J, et al. Interaction between residues in the Mg2+-binding site regulates BK channel activation. J Gen Physiol. 2013;141:217–228. doi: 10.1085/jgp.201210794. [DOI] [PMC free article] [PubMed] [Google Scholar]
- 22.Shi J, et al. Mechanism of magnesium activation of calcium-activated potassium channels. Nature. 2002;418:876–880. doi: 10.1038/nature00941. [DOI] [PubMed] [Google Scholar]
- 23.Budelli G, Geng Y, Butler A, Magleby KL, Salkoff L. Properties of Slo1 K+ channels with and without the gating ring. Proc Natl Acad Sci U S A. 2013;110:16657–16662. doi: 10.1073/pnas.1313433110. [DOI] [PMC free article] [PubMed] [Google Scholar]
- 24.Horrigan FT. Perspectives on: conformational coupling in ion channels: conformational coupling in BK potassium channels. J Gen Physiol. 2012;140:625–634. doi: 10.1085/jgp.201210849. [DOI] [PMC free article] [PubMed] [Google Scholar]
- 25.Schreiber M, Salkoff L. A novel calcium-sensing domain in the BK channel. Biophys J. 1997;73:1355–1363. doi: 10.1016/S0006-3495(97)78168-2. [DOI] [PMC free article] [PubMed] [Google Scholar]
- 26.Xia XM, Zeng X, Lingle CJ. Multiple regulatory sites in large-conductance calcium-activated potassium channels. Nature. 2002;418:880–884. doi: 10.1038/nature00956. [DOI] [PubMed] [Google Scholar]
- 27.Zhang G, et al. Ion sensing in the RCK1 domain of BK channels. Proc Natl Acad Sci U S A. 2010;107:18700–18705. doi: 10.1073/pnas.1010124107. [DOI] [PMC free article] [PubMed] [Google Scholar]
- 28.Magleby KL, Song L. Dependency plots suggest the kinetic structure of ion channels. Proc Biol Sci. 1992;249:133–142. doi: 10.1098/rspb.1992.0095. [DOI] [PubMed] [Google Scholar]
- 29.Rothberg BS, Bello RA, Magleby KL. Two-dimensional components and hidden dependencies provide insight into ion channel gating mechanisms. Biophys J. 1997;72:2524–2544. doi: 10.1016/S0006-3495(97)78897-0. [DOI] [PMC free article] [PubMed] [Google Scholar]
- 30.Bao L, Rapin AM, Holmstrand EC, Cox DH. Elimination of the BK(Ca) channel’s high-affinity Ca(2+) sensitivity. J Gen Physiol. 2002;120:173–189. doi: 10.1085/jgp.20028627. [DOI] [PMC free article] [PubMed] [Google Scholar]
- 31.Li W, Aldrich RW. Unique inner pore properties of BK channels revealed by quaternary ammonium block. J Gen Physiol. 2004;124:43–57. doi: 10.1085/jgp.200409067. [DOI] [PMC free article] [PubMed] [Google Scholar]
- 32.Wilkens CM, Aldrich RW. State-independent block of BK channels by an intracellular quaternary ammonium. J Gen Physiol. 2006;128:347–364. doi: 10.1085/jgp.200609579. [DOI] [PMC free article] [PubMed] [Google Scholar]
- 33.Geng Y, Niu X, Magleby KL. Low resistance, large dimension entrance to the inner cavity of BK channels determined by changing side-chain volume. J Gen Physiol. 2011;137:533–548. doi: 10.1085/jgp.201110616. [DOI] [PMC free article] [PubMed] [Google Scholar]
- 34.Zhou Y, Xia XM, Lingle CJ. Cysteine scanning and modification reveal major differences between BK channels and Kv channels in the inner pore region. Proc Natl Acad Sci U S A. 2011;108:12161–12166. doi: 10.1073/pnas.1104150108. [DOI] [PMC free article] [PubMed] [Google Scholar]
- 35.Wong JP, Reboul E, Molday RS, Kast J. A carboxy-terminal affinity tag for the purification and mass spectrometric characterization of integral membrane proteins. J Proteome Res. 2009;8:2388–2396. doi: 10.1021/pr801008c. [DOI] [PMC free article] [PubMed] [Google Scholar]
- 36.Rothbauer U, et al. A versatile nanotrap for biochemical and functional studies with fluorescent fusion proteins. Mol Cell Proteomics. 2008;7:282–289. doi: 10.1074/mcp.M700342-MCP200. [DOI] [PubMed] [Google Scholar]
- 37.Fridy PC, et al. A robust pipeline for rapid production of versatile nanobody repertoires. Nat Methods. 2014;11:1253–1260. doi: 10.1038/nmeth.3170. [DOI] [PMC free article] [PubMed] [Google Scholar]
- 38.Mastronarde DN. Automated electron microscope tomography using robust prediction of specimen movements. J Struct Biol. 2005;152:36–51. doi: 10.1016/j.jsb.2005.07.007. [DOI] [PubMed] [Google Scholar]
- 39.Grant T, Grigorieff N. Measuring the optimal exposure for single particle cryo-EM using a 2.6 A reconstruction of rotavirus VP6. Elife. 2015;4:e06980. doi: 10.7554/eLife.06980. [DOI] [PMC free article] [PubMed] [Google Scholar]
- 40.Scheres SH. RELION: implementation of a Bayesian approach to cryo-EM structure determination. J Struct Biol. 2012;180:519–530. doi: 10.1016/j.jsb.2012.09.006. [DOI] [PMC free article] [PubMed] [Google Scholar]
- 41.Rohou A, Grigorieff N. CTFFIND4: Fast and accurate defocus estimation from electron micrographs. J Struct Biol. 2015;192:216–221. doi: 10.1016/j.jsb.2015.08.008. [DOI] [PMC free article] [PubMed] [Google Scholar]
- 42.Bell JM, Chen M, Baldwin PR, Ludtke SJ. High resolution single particle refinement in EMAN2.1. Methods. 2016;100:25–34. doi: 10.1016/j.ymeth.2016.02.018. [DOI] [PMC free article] [PubMed] [Google Scholar]
- 43.Lyumkis D, Brilot AF, Theobald DL, Grigorieff N. Likelihood-based classification of cryo-EM images using FREALIGN. J Struct Biol. 2013;183:377–388. doi: 10.1016/j.jsb.2013.07.005. [DOI] [PMC free article] [PubMed] [Google Scholar]
- 44.Rosenthal PB, Henderson R. Optimal determination of particle orientation, absolute hand, and contrast loss in single-particle electron cryomicroscopy. J Mol Biol. 2003;333:721–745. doi: 10.1016/j.jmb.2003.07.013. [DOI] [PubMed] [Google Scholar]
- 45.Rubinstein JL, Brubaker MA. Alignment of cryo-EM movies of individual particles by optimization of image translations. J Struct Biol. 2015;192:188–195. doi: 10.1016/j.jsb.2015.08.007. [DOI] [PubMed] [Google Scholar]
- 46.Kucukelbir A, Sigworth FJ, Tagare HD. Quantifying the local resolution of cryo-EM density maps. Nat Methods. 2014;11:63–65. doi: 10.1038/nmeth.2727. [DOI] [PMC free article] [PubMed] [Google Scholar]
- 47.Pettersen EF, et al. UCSF Chimera–a visualization system for exploratory research and analysis. J Comput Chem. 2004;25:1605–1612. doi: 10.1002/jcc.20084. [DOI] [PubMed] [Google Scholar]
- 48.Emsley P, Lohkamp B, Scott WG, Cowtan K. Features and development of Coot. Acta Crystallogr D Biol Crystallogr. 2010;66:486–501. doi: 10.1107/S0907444910007493. [DOI] [PMC free article] [PubMed] [Google Scholar]
- 49.Adams PD, et al. The Phenix software for automated determination of macromolecular structures. Methods. 2011;55:94–106. doi: 10.1016/j.ymeth.2011.07.005. [DOI] [PMC free article] [PubMed] [Google Scholar]
- 50.Brown A, et al. Tools for macromolecular model building and refinement into electron cryo-microscopy reconstructions. Acta Crystallogr D Biol Crystallogr. 2015;71:136–153. doi: 10.1107/S1399004714021683. [DOI] [PMC free article] [PubMed] [Google Scholar]
- 51.Morin A, et al. Collaboration gets the most out of software. Elife. 2013;2:e01456. doi: 10.7554/eLife.01456. [DOI] [PMC free article] [PubMed] [Google Scholar]
Associated Data
This section collects any data citations, data availability statements, or supplementary materials included in this article.


