

Abstract
Quantitative measurement of chemically cross-linked proteins is crucial to reveal dynamic information about protein structures and protein-protein interactions and how these are differentially-regulated during stress, aging, drug treatment and most perturbations. Previously, we demonstrated how quantitative in vivo cross-linking (CL) with stable isotope labeling of amino acids in cell culture enables both heritable and dynamic changes in cells to be visualized. In this work, we demonstrate the technical feasibility of proteome-scale quantitative in vivo cross-linking (CL) - MS using isotope labeled protein interaction reporter (PIR) cross-linkers and E. coli as a model system. This isotope labeled cross-linkers approach, combined with Real-time Analysis of Cross-linked peptide Technology (ReACT) developed earlier in our lab, enables quantification of 941 non-redundant cross-linked peptide pairs from a total of 1213 fully identified peptide pairs in two biological replicate samples, through comparison of MS1 peak intensity of the light and heavy cross-linked peptide pairs. For targeted relative quantification of cross-linked peptide pairs, we further developed a PRM-based assay to accurately probe specific site interaction changes in a complex background. The methodology described in this work provides reliable tools for both large-scale and targeted quantitative CL-MS useful for any sample where SILAC labeling may not be practical.
Keywords: quantitative CL-MS, PIR, isotope labeling, proteome-scale, in vivo protein interactions
Graphical abstract
INTRODUCTION
Chemical cross-linking combined with mass spectrometry is an emerging structural biology tool that provides information on the spatial proximity of two amino acid residues in proteins. The insights gained from CL-MS can be translated into structural information about protein folding, architecture of protein complexes, and topologies of protein interaction interfaces1–3. Beyond successful applications on purified protein and protein complexes, recent developments on CL-MS technology and informatics have promoted this field to proteome-scale studies of protein-protein interaction networks in cell lysates4–6 and living cells7–11. As protein structures and protein interactions are dynamic and highly dependent on their molecular and cellular environment, quantitative mapping of the edges of protein interaction networks is important for elucidating how protein conformations and interactions change in their native complex background12.
Quantitative cross-linking MS (qCL-MS) has been demonstrated with purified proteins and protein complexes using isotope labeled cross-linking reagents such as d0/d4 - bis(sulfosuccinimidyl) suberate13, 14, d0/d12-disuccinimidyl suberate15, and d0/d6-biotinylated azo-lysine-targeted enrichable cross-linkers6. An in vivo qCL-MS approach based on SILAC (stable isotope labeling by an amino acids in cell culture) and the PIR technology16, 17 recently developed in our lab, has extended applications of qCL-MS to proteome-scale18. This large-scale qCL-MS strategy was applied to compare changes in protein structures and interactions in multidrug-resistant human carcinoma cells18 and probe in vivo conformational dynamics of heat shock protein 90 and its interactors in response to drug inhibitors19. For potential applications on large-scale biological samples where SILAC is not practical, we introduce the concepts and use of isotope labeled-PIR structures, which can be applied to quantification of any type of cross-linking samples, such as tissues, organs, and body fluids from plants, animals and humans. These peptide-like PIR cross-linkers are universally available at a cost-effective price as they can be easily synthesized in-house using solid-phase peptide synthesizer or purchased through any custom peptide synthesis services. In this work the heavy and light PIR pair, biotin-aspartate proline-N-hydroxyphthalimide (BDP-NHP), and its heavy counterpart, d8-biotin-aspartate proline-N-hydroxyphthalimide (d8-BDP-NHP), are described and used to demonstrate technical feasibility of large-scale qCL-MS by in vivo cross-linking of E. coli cells using the isotope labeled PIR pair. With careful consideration of the sites of heavy isotope incorporation in the BDP-NHP cross-linker, both heavy and light form of cross-linked peptide pair release reporter ions of the same mass upon CID MS/MS. In this way, the Real-time Analysis for Cross-linked peptide Technology (ReACT)9, developed for assigning PIR cross-linked peptide pairs ‘on-the-fly’, can identify cross-linked relationships of heavy or light PIR cross-linked peptides using only a single reporter mass. Upon peptide pair identification from LC-ReACT analysis of pooled light/heavy PIR cross-linked samples, relative quantification is carried out by extracting MS1 signals from the light and heavy PIR-cross-linked precursor ions. Moreover, Parallel Reaction Monitoring (PRM) has evolved as a widely-available approach for quantitation in many labs to provide proteome quantitative measurements. We further demonstrate that PRM-based targeted quantification of heavy and light PIR peptide pairs has wide dynamic range, good accuracy and offers a new general capability to study protein conformational and interaction changes within a complex background that could be used in many mass spectrometry labs.
EXPERIMENTAL SECTION
Synthesis of d0-/d8- BDP-NHP Cross-linkers
Light and heavy forms of the Protein Interaction Reporter (PIR) cross-linkers BDP-NHP and d8-BDP-NHP were synthesized in house according to a protocol described previously9. Briefly, Biotin Asparate Proline (BDP)9 were synthesized using Fmoc chemistry and then esterified to produce activated n-hydroxyphthalamide ester. Succinic anhydride with d4-deuterium substitution was used to synthesize the d8-BDP-NHP cross-linker.
E. coli Sample Preparation for Large-scale qCL-MS
E. coli K12 cells were cultured in LB medium and the cell suspensions were harvested at OD 0.6~0.8. Before cross-linking, the cells were washed three times with PBS buffer and resuspended in minimum amount of 170 mM Na2HPO4 (pH 7.4). Subsequently, the cell suspensions were split into two equal halves, and in vivo cross-linking reactions were conducted by adding d0-BDP-NHP and d8-BDP-NHP separately into each half of the cell suspension at a final concentration of 10 mM. The E. coli cells were incubated with the PIR cross-linkers by constant mixing at room temperature for 1 hr. After the reaction finished, the cells were washed with PBS, lysed by cryo-grinding and ultrasonication in 8 M urea/100 mM Tris-HCl pH 8.0/150 mM NaCl. Bicinchoninic acid assay (Thermo Pierce, Rockford, IL) was conducted to determine the protein concentration of the cell lysate. Based on the measured protein concentration, the d0-/d8-BDP-NHP differentially cross-linked E. coli proteins were pooled with total protein mass ratio of 1:2 and 2:1. Each pooled cell lysate sample containing 8 mg of d0-/d8-BDP-NHP cross-linked E. coli proteins was reduced, alkylated, digested by trypsin (1:100 enzyme/protein mass ratio) overnight. The digested peptides were desalted with C18 Sep-Pak columns (Waters, Milford, MA), separated into three fractions by strong cation exchange (SCX) HPLC (250×10 mm, Luna 5 μm diameter, 100 Å pore size particles, Phenomenex, Torrance, CA). A binary solvent gradient (Solvent A, 7 mM KH2PO4 (pH 2.6) /30%ACN, Solvent B, 7 mM KH2PO4 (pH 2.6) /350 mM KCl / 30% ACN) with a mobile phase flow rate of 1.5 mL/min was set as follows for SCX fractionation: 0–2.5 min, 0% B; 2.5–7.5 min, 0–5% B; 7.5–47.5 min, 5–60% B; 47.5–67.5 min, 60–100%B; 67.5–77.5 min, 100%B. Samples eluted during 42.5–52.5 min, 52.5–62.5 min, 62.5–87.5 min were collected separately and concentrated by vacuum centrifugation. To further enrich the cross-linked peptides, the collected SCX fractions were incubated with UltraLink monomeric avidin (Thermo Pierce, Rockford, IL) and the cross-linked peptides were eluted from the beads in 70% ACN and 0.5% formic acid. Finally, the enriched cross-linked peptides were concentrated by vacuum centrifuge and resuspended in 0.1% formic acid for subsequent LC-ReACT MS analysis.
Sample Preparation for PRM Based Relative Quantification
Two aliquots of 1 mg/mL BSA dissolved in 170 mM Na2HPO4 (pH 7.4) were cross-linked with 1 mM of d0- and d8- BDP-NHP separately at room temperature for 1hr, and then reduced, alkylated, digested. After digestion, the d0- and d8-BDP-NHP differentially cross-linked BSA peptides were mixed at ratios of 1:1, 1:2, 1:5, 1:10 and 1:20. The mixed BSA peptides were desalted with C18 Sep-Pak columns, dried in vacuum centrifuge, and resuspended in 0.1% formic acid prior to LC-PRM MS analysis.
4 mg of 1:1 mixture of d0/d8 BDP-NHP cross-linked E. coli sample was reduced, alkylated and buffer exchanged against 0.1 M ammonium bicarbonate using a 30 kDa molecular weight cutoff filter (Millipore, Billerica, MA). The cross-linked proteins were then enriched by incubation with monomeric avidin beads, resulting in approximately 460 μg total protein recovered from 8 M urea elution. After trypsin digestion and C18 desalting, two aliquots of each tryptic digest were spiked with 1:5 and 5:1 d0-/d8-BDP-NHP cross-linked BSA digests respectively, with an enriched E. coli protein /BSA protein mass ratio of 190:1. These samples were used to ascertain if accurate heavy:light PIR ratios could be measured for cross-linked peptides spiked into a large background of 1:1 heavy:light PIR-cross-linked E. coli peptides.
LC-MS Analysis of Cross-linked Peptide Pairs
Mixtures of d0/d8 BDP-NHP cross-linked E. coli peptides from each SCX fraction were analyzed in technical triplicates by a Waters NanoAcquity UPLC coupled to a Thermo Velos Fourier transform ion cyclotron resonance mass spectrometer implemented with Real-time Analysis for Cross-linked peptide Technology (ReACT)9. The cross-linked peptide pairs were separated by reverse phase nanoLC using a 50 cm ×75 μm C8 column packed with 5 μm diameter, 100 Å pore size MichromMagic beads with a 4 hour 10~40% B gradient elution (solvent A: 0.1% formic acid in water, solvent B: 0.1% formic acid in acetonitrile). Peptides eluted from the nanoLC column with charge states greater than 4 were subjected to CID MS/MS, and the generated fragment ions were detected by the ICR cell. The candidate cross-linked peptide ions were determined in real-time by examining the presence of reporter ion mass (m/z 752.4129) and fragment ion masses satisfying the PIR mass relationship (precursor mass = reporter ion mass + peptide α mass + peptide β mass) within 20 ppm of mass tolerance among the top 500 fragment ions in the MS/MS spectra. Upon the discovery of PIR mass relationship for a cross-linked peptide pair precursor ion ‘on-the-fly’, each individual peptide ion released by CID was further selected and subjected to low-resolution CID MS3 fragment ion analysis. Two MS/MS/MS scans were acquired for each released peptide ion from one cross-linked peptide pair precursor.
Heavy-light PIR cross-linked BSA peptides and samples containing cross-linked E. coli peptides spiked with cross-linked BSA peptides were analyzed by a Thermo Easy-nanoLC coupled to a Thermo Q-Exactive Plus Orbitrap mass spectrometer. The cross-linked peptide pairs were separated by a 50 cm ×75 μm C8 column (5 μm diameter, 100 Å pore size MichromMagic beads) using a 2 hour 10~40% B gradient (solvent A: 0.1% formic acid in water, solvent B: 0.1% formic acid in acetonitrile, flow rate 300 nL/min). A targeted PRM method with the following settings were applied for PRM data acquisition: mass resolution (m/z 200)17.5 k, AGC target 2e5, maximum ion injection time 100 mS, NCE 25, isolation window 1 m/z. The targeted inclusion list contains the most abundant isotope m/z of both light and heavy forms of the 13 or 15 cross-linked peptides monitored in corresponding PRM experiment (Table SI-3, SI-4).
Identification of Cross-linked Peptide Pairs
Cross-linked peptide pairs were identified by searching MS3 spectra acquired by ReACT analysis using Comet (Version 2016.01 rev. 2)16 against E. coli K12 proteome database (total 4366 target sequences, http://www.uniprot.org/) containing forward and reverse protein sequences, and mapping the identified peptide sequences to cross-linked relationships found during ReACT data acquisition. Details of the peptide pair identification process are illustrated in Figure SI-1. A comet search was conducted with the following parameters: peptide precursor mass tolerance 20 ppm, allowing for −1, 0, +1, +2, or +3 13C offsets; fragment ion mass tolerance 1.005 Da with 0.4 Da offset; static modification, carbamidomethylation of Cys (57.0215 Da); variable modifications including oxidation of Met (15.9949 Da) and BDP stump modification (197.0324 for d0-BDP-NHP, 201.0597 for d8-BDP-NHP) of Lys and N-termini, where ‘stump’ is the residual group from the cross-linker that remains on lysine side chain or peptide N-terminus after CID cleavage; considering only fully tryptic peptide sequences, and allowing for up to 3 missed tryptic cleavage. 5% false discovery rate (FDR) for peptide identification was required and only peptide sequences containing an internal Lys modified by d0 or d8-BDP stump were used to map back to the cross-linked relationships with a 20 ppm tolerance. The global FDR for identification of cross-linked peptide pairs was estimated to be 1.6%, from the ratio of number of decoy cross-linked peptide pairs (either one or both reverse peptide sequences passing 5% FDR threshold during peptide identification) to the total number of identified cross-linked peptide pairs.
Relative Quantification of Cross-linked Peptides
MS1 peak intensity based large-scale relative quantification was achieved using MassChroQ (version 2.1.1)20. Accurate mass of the light form of each cross-linked peptide pair, charge state, and MS2 scan number relevant to identification of each cross-linked peptide pair was input into MassChroQ for integration of MS1 peak intensity. The mass of the heavy form of cross-linked peptides pair was defined as 8.0504 Da modification at peptide N-terminus in MassChroQ input parameter file. All the samples from two biological replicates and three technical replicates were grouped according to their SCX fraction number for retention time alignment using the Obiwarp method21. Within each quantification group, the areas under the curves from extracted ion chromatogram were integrated for light and heavy forms of all the identified cross-linked peptide pair with 20 ppm mass tolerance of the precursor ion using the Zivy peak detection algorithm. Peak areas output from MassChroQ were converted to log2(d8/d0) ratio for each light and heavy form of cross-linked peptide pair. Further statistical processing, including removal of outlier ratios, calculation of average ratio, standard deviation and 95% confidence interval for each non-redundant cross-linked peptide pairs was carried out with functions in R. The ratios corresponding to one non-redundant cross-linked peptide pair were grouped and the outliers within each group (values smaller than (Q1−1.5×IQR) or greater than (Q3+1.5×IQR)) were removed. For cross-linked peptides with multiple measurements, the mean ratios without outliers were assigned to each non-redundant cross-linked peptide pairs.
Data from targeted PRM-based quantification of isotope labeled cross-linked peptide pairs were processed by Skyline. The m/z of each light and heavy precursor ion and their corresponding fragment ions, including two peptide ions with the BDP stump mass on the cross-linking Lys (197.0324 for d0-BDP-NHP, 201.0597 for d8-BDP-NHP), two long arm peptide ions (948.4385 Da for d0-BDP-NHP, 952.4658 Da for d8-BDP-NHP) resulting from partial cleavage of the cross-linked peptide pair, where BDP stump and the reporter group remain attached to the cross-linking Lys, and all the predicted b and y ions from each peptide, were calculated by a in-house developed program ‘ReACT2prm’ (source code download: http://brucelab.gs.washington.edu/software.html, web based application: http://xlinkdb.gs.washington.edu/xlinkdb/prmTransitionForm.php) using the cross-linked peptide sequence, cross-linking site, precursor charge state, peptide modification as input. The generated PRM transition lists were input into Skyline for extraction of MS2 peak area from each transition channel corresponding to each targeted cross-linked peptides pair. Peak areas from all relative transitions observed in both light and heavy channels were summed to provide quantitative measurement.
RESULTS AND DISSCUSSION
The chemical structures of the PIR cross-linkers d0/d8 BDP-NHP are shown in Figure 1A. Four deuterium atoms are incorporated into each arm of the MS cleavable cross-linker by d4-deuterated succinic anhydride, leading to 8 Da mass shift between the light and heavy forms of cross-linked peptide pair in full MS scans, and 4 Da mass shift between fragment ions containing the cross-linking Lys modified with BDP stump in MS2 scans. Figure 1B and 1C show an example of EICs, MS1 and MS2 spectra from a pair of 1:1 d0/d8 mixed cross-linked E. coli peptide pairs VAVIKAVR-EAKDLVESAPAALK (intra cross-link from 50S ribosomal protein). As the reporter ion composition (m/z 752.4129) remains unchanged for d8-BDP-NHP cross-linked peptide pairs (Figure 1C), a single PIR reporter ion mass was searched within ReACT during data acquisition using the mass relationship (precursor mass = reporter ion mass + peptide α mass + peptide β mass). Increase in the heavy precursor mass are counter balanced in the equation by increases in both released peptide masses, due to the isotopic content of the stumps on cross-linking Lys. Co-elution of the d0/d8 BDP-NHP cross-linked peptide pairs (Figure 1B, top) enables high-throughput relative quantification based on ratio of peak area of precursor ions by data-dependant experiment, as well as targeted quantification of cross-linked peptide pairs by ratio from peak area of fragment ions by PRM experiment. The slight retention time shift (smaller than 5 seconds) of the light/heavy cross-linked peptide pairs does not affect the relative quantification accuracy as the integrated peak areas under the curves, instead of single spectra, are used to provide relative abundance assessment of the light and heavy pairs.
Figure 1.

(A) Chemical structure of d0-BDP-NHP and d8-BDP-NHP. (B) An example of EICs (top) and high-resolution MS1 spectra (bottom) of d0 BDP-NHP and d8 BDP-NHP cross-linked E. coli peptide pairs VAVIKAVR-EAKDLVESAPAALK (intra cross-links from 50S ribosomal protein) mixed in 1:1 ratio (monoisotopic m/z 861.2138, 863.2260, +4). (C) High-resolution MS/MS spectra of the d0-BDP-NHP (top) and d8-BDP-NHP (bottom) cross-linked peptide pairs. Upon HCD, the reporter ion (m/z 752.4107), α peptide precursor VAVIKAVR (m/z 1052.6080 light, m/z 1056.6331 heavy), β peptide precursor (m/z 1638.8197 light, m/z 1642.84444 heavy) are released from BDP-NHP cross-linked peptide pairs.
MS1 Based Large-Scale Relative Quantification of Isotope Labeled Cross-linked Peptide Pairs
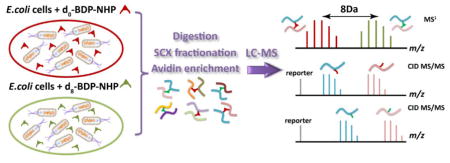
To demonstrate that large-scale chemical cross-linking by isotope labeled PIR technologies can provide useful quantitative information, we used d0- and d8- BDP-NHP PIR cross-linkers and applied them to in vivo cross-linking of E. coli cells. The workflow is illustrated by Figure 2. Briefly, E. coli cells harvested from the same batch were split into two equal halves and in vivo cross-linked with d0-BDP-NHP and d8-BDP-NHP respectively. The light/heavy PIR cross-linked cells were pooled with ratios of 1:2 and 2:1 based on total protein amounts measured after cell lysis. The pooled cross-linked proteins were digested, fractioned, affinity enriched, and analyzed by LC-ReACT. Two batches of E. coli cells were cultured to duplicate the biochemical process and LC-ReACT experiments were carried out in triplicate for samples from each SCX fraction. A total of 1213 non-redundant peptide pairs, including 933 identified in light cross-linking form and 813 identified in heavy cross-linking form, were fully identified by search against E. coli K12 database (Table SI-1). These identified cross-linked peptide pairs represent a protein-protein interaction network composed of 320 non-redundant proteins, 126 inter-protein interactions, 48 homo-dimer protein interactions, and 208 self-interactions (protein with only intra-links identified). Major hub proteins were found to have many interactors in this dataset, including D-ribose-binding periplasmic protein, outer membrane protein A, elongation factor Tu 1, which were also observed as protein interaction hubs in previously reported E. coli cross-linking networks4, 6, 9 and currently existing protein interaction databases such as IntAct22 and EciD23. The protein-protein interaction network obtained from this d0/d8 BDP-NHP CL-MS dataset is shown in Figure SI-2 and also accessible from XLinkDB 2.024, 25 website (http://xlinkdb.gs.washington.edu/xlinkdb, Network name ‘XZEcoli07132016_Bruce’). By querying available PDB structures through XLinkDB 2.0, Euclidean Cα-Cα distances from the crystal structures were computed for 665 of the 1213 identified cross-linked peptide pairs and 90% of the distances are smaller than 35 Å (Figure SI-3).
Figure 2.

Illustration of sample preparation work flow for large-scale relative quantification of differentially cross-linked E. coli cells. Two batches of cells were cultured for biological replicates. Cultured cells from one batch were split into two equal halves and cross-linked with d0-BDP-NHP and d8-BDP-NHP respectively. After cell lysis, 8 mg of cross-linked E. coli lysates were pooled in d0/d8 1:2 and 2:1 ratios based on total protein mass. The lysates were digested, fractioned by SCX, enriched with avidin beads, and then analyzed by LC-ReACT in triplicates for MS1 peak intensity based quantification.
MassChroQ was employed for peak area integration as it simply requires peptide precursor mass, charge state and retention time as the input information, performs peak alignment among replicates, and analyzes isotope labeled data. Out of the 1213 non-redundant peptide pairs identified from the combined biological replicates, 941 non-redundant peptide pairs (77.5%) were quantified, including 825 non-redundant peptide pairs quantified in the 1:2 (d0/d8) mixing samples, 771 quantified in the 2:1 (d0/d8) mixing samples, and 655 quantified in both inverse labeling experiments (Table SI-2). Figure 3 shows the histogram plots of measured log2(d8/d0) ratios of cross-linked peptide pairs from the 1:2 d0/d8 mixing sample and 2:1 d0/d8 mixing sample, with the medians centered at log2= 0.81 and −1.24 respectively, interquartile range (IQR) of 0.87 and 0.94 respectively. For cross-linked peptide pairs quantified multiple times, scatter plot of 95% confidence interval versus the mean log2(d8/d0) value is shown in Figure SI-4. The reproducibility of large-scale relative quantification is also assessed by correlation of light/heavy cross-linked peptide ratios measured in the inverse labeling replica experiments (Figure SI-5), and distribution of the differences and associated 95% confidence intervals of the light/heavy ratios measured from the inverse labeling experiments (Figure SI-6). Although outlier ratios always exist due to the low MS1 peak intensity of some cross-linked peptide pairs and spectral interference from co-eluting species, the overall quantification results obtained are consistent with the expected ratios and the variability is comparable to results from our previous SILAC qCL-MS study of human carcinoma cells (IQR of log2 Ratio=1.09, N=1054)18. Comparison of results generated using a single cross-linking reaction with mixed light/heavy SILAC-labeled cells18 with those generated here revealed the present approach with two separate cross-linking reactions using light and heavy cross-linkers prior to sample mixing did not significantly increase observed ratio variance.
Figure 3.
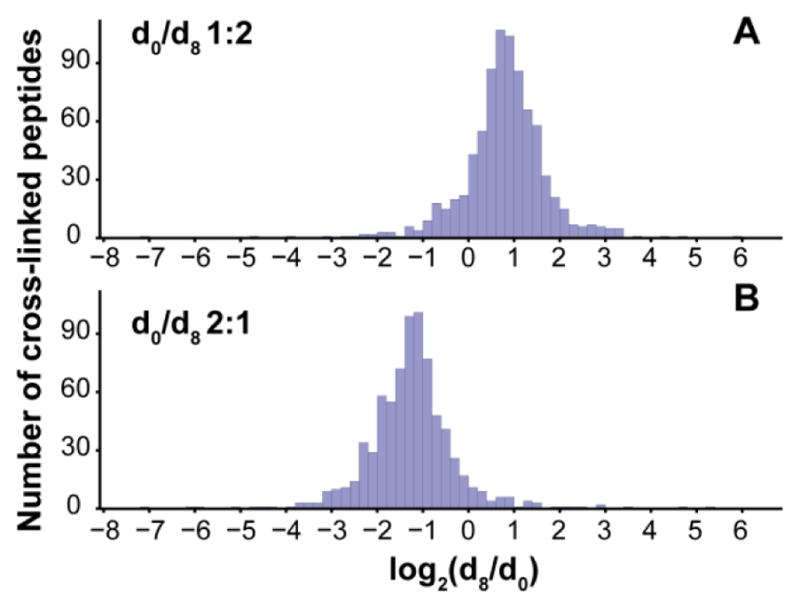
Histograms showing distribution of measured log2(d8/d0) values of cross-linked E. coli peptide pairs from the (A) 1:2 d0/d8 mixing sample (n=825, median 0.81, IQR=0.87) and (B) 2:1 d0/d8 mixing sample (n=771, median −1.24, IQR=0.94).
Targeted Relative Quantification of Isotope Labeled Cross-linked Peptide Pairs by PRM
Targeted PRM is commonly considered as an accurate and sensitive approach for peptide and protein quantification and often applied to confirm the protein abundance changes found from large-scale discovery experiments. As a proof-of-principle experiment for targeted quantification of isotope labeled cross-linked peptide pairs, d0- and d8- BDP-NHP cross-linked BSA digests were mixed with ratios of 1:1, 1:2, 1:5, 1:10, and 1:20, and a total of 13 light/heavy cross-linked peptide pairs were targeted and quantified by PRM (Table SI-3). Predicted transitions for each form of cross-linked peptide pair, including singly and doubly charged peptide precursors, b and y ions from each peptide precursor were extracted using Skyline. Figure 4A shows PRM transitions of the light and heavy forms of cross-linked BSA peptide pair SLGKVGTR-LSQKFPK from the 1:1 (d0/d8) mixing sample. The two released peptide ions with BDP stump and two long arm peptide ions with BDP stump and reporter group, are frequently observed to be the most abundant fragment ions generated by HCD. The measured log2(d8/d0) ratio for each light/heavy cross-linked peptide pair was calculated based on peak areas from summed EIC of all the transitions present in both form of the cross-linked peptide pair. As shown in Figure 4B, the observed average log2(d8/d0) ratios calculated from the 13 light/heavy pairs of cross-linked peptides measured by PRM in duplicates agree well with the expected ratios and the response appears linear over the range studied (Table SI-5).
Figure 4.

Targeted PRM based relative quantification of d0/d8 BDP-NHP cross-linked peptide pairs. (A) An example of PRM transitions of 1: 1 mixed d0-BDP-NHP (left) and d8-BDP-NHP (right) cross-linked BSA peptide pair SLGKVGTR-LSQKFPK. Only unique transitions with 4 Da mass difference between the fragment ions from light and heavy channels are shown. (B) Calibration curve showing PRM based relative quantification of 13 pairs of d0- and d8- BDP-NHP cross-linked BSA peptides mixed with ratios of 1:1, 1:2, 1:5, 1:10 and 1:20. Standard deviation of the measured Log2(d8/d0) value was calculated based on duplicate PRM measurements of 13 d0/d8 -BDP-NHP cross-linked peptide pairs (n=26). (C) PRM based relative quantification of trace amount of differentially cross-linked BSA peptides (d0/d8 1:5 deep colored, and 5:1 light colored) spiked into cross-linked E. coli cell lysate digests (d0/d8, 1:1). The E. coli cell digests were mixed with cross-linked BSA digest at a total E. coli protein /BSA mass ratio of 190:1. Three d0/d8 BDP-NHP cross-linked BSA peptide pairs and twelve d0/d8 BDP-NHP cross-linked E. coli peptide pairs were measured by PRM. Standard deviation of Log2(d8/d0) value was calculated based on triplicate PRM measurements. Insets show examples of summed EICs of differentially cross-linked peptide pair SLGKVGTR-LCVLHEKTPVSEK (purple, d0/d8 1:5 and 5:1) from BSA, and QENQIKAVR-GITLKIADGQQK (green, d0/d8 1:1) from the E. coli ABC transporter periplasmic-binding protein, in two separate PRM experiments for the two E. coli samples spiked with different BSA d0/d8 cross-linking ratio.
To mimic probing conformational or interaction changes of a specific protein through cross-linked peptide quantitation from a complex sample background, we spiked 1 part of light/heavy BDP-NHP cross-linked BSA digests (d0/d8 1:5, 5:1) into 190 parts of tryptic digests from in vivo cross-linked E. coli (d0/d8 1:1) proteins and developed a PRM assay to quantify the changes of cross-linked BSA peptide pairs in the background of cross-linked E. coli samples. Three representative BSA light/heavy cross-link pairs were monitored to quantify the changes of BSA (Table SI-3). Meanwhile, twelve frequently observed light/heavy cross-linked E. coli peptide pairs from the major protein interaction hubs and their interactors were also quantified simultaneously to provide a reference of measurement variation for those cross-links whose relative responses are not expected to change significantly (Table SI-4). Figure 4C presents the PRM quantification results from triplicate measurements of each E. coli sample spiked with cross-linked BSA (Table SI-5). The d8/d0 fold changes of the three BSA cross-linked peptide pairs monitored were close to the expected value of 1:5 and 5:1(error within 33%, N=3), while the relative quantity of twelve pairs of E. coli cross-linked peptide pairs remained close to 1:1 or log2=0 (error within 27%, N=3). The masses of quantified peptide pairs range from 2.8 kDa to 6.6 kDa. By centering the 1 m/z mass isolation window at the most abundant isotope predicted from the chemical formula of cross-linked peptide pair, co-isolation of isotope clusters from light and heavy channels was avoided and accurate quantification for peptide pair as large as 6.6 kDa was achieved.
CONCLUSIONS
This work demonstrates proteome-wide in vivo quantitative CL-MS using isotope labeled PIR cross-linkers with the model organism E. coli and enables extension of qCL-MS to in vivo samples where SILAC may not be practical. Nearly one thousand cross-linked peptide pairs from 382 interacting proteins were quantified through comparison of peak areas of light and heavy cross-linked peptide pair precursors extracted from LC-ReACT data. Similar to other MS1 based quantification approaches for proteome-scale data-dependent experiments, major challenges for accurate quantification of the cross-linked peptide pairs come from low abundance of many cross-linked species, co-elution of cross-linked and non cross-linked peptide pairs, and relatively slow instrument duty cycle for data sampling. We also demonstrated that targeted PRM based relative quantification using isotope labeled cross-linkers is a complementary approach for accurate and sensitive quantification of cross-linked peptides in complex samples. With PIR cross-linkers widely available from many peptide synthesis companies and PRM methods for reliable peptide quantification gaining widespread utility, we anticipate that the qCL-MS strategy described here could have broad impact for probing in vivo protein conformational and protein-protein interaction dynamics resultant from drug treatments, development, aging, stresses or nearly any conditional perturbations.
Supplementary Material
Figure SI-1 Identification process of light and heavy cross-linked peptide pairs from ReACT LC-MS experiments.
Figure SI-2 E. coli protein-protein interaction network obtained from the large-scale in vivo qCL-MS dataset.
Figure SI-3 Distribution of Cα-Cα distance (N=665) of the cross-linking sites discovered in this in vivo CL-MS E. coli dataset based on crystallography structure available from PDB.
Figure SI-4 Scatter plot showing 95% confidence intervals of log2(d8/d0) ratio of the cross-linked E. coli peptide pair quantified multiple times in the (A) 1:2 (d0/d8) mixing sample (N=656) and (B) 2:1(d0/d8 mixing sample (N=601).
Figure SI-5 Correlation of log2(d8/d0) ratios of cross-linked E. coli peptides measured in the 1:2 (d0/d8) mixing and those measured in 2:1 (d0/d8) mixing experiments (N=655). The blue dash lines (x=1, y= −1) indicate the expected log2 ratios and the red dash lines (x=0.81, y= −1.24) indicate median log2 ratios from the two experiments.
Figure SI-6 Histogram (N=655) (A) and scatter plot of 95% confidence intervals (N=504) (B) of the differences of absolute value of mean log2(d8/d0) ratios of cross-linked E. coli peptides measured from the 1:2 d0/d8 mixing and 2:1 d0/d8 mixing experiments.
Table SI-1 E. coli cross-linked peptides identification.xlsx.
Summary of in vivo cross-linked E. coli peptide pairs identified from each LC-ReACT run.
Table SI-2 E. coli cross-linked peptides ratio.xlsx.
Summary of Log2 (d8/d0) ratios and corresponding standard deviations, 95% confidence intervals of the light/heavy E. coli peptide pairs quantified by LC-ReACT from the 1:2 d0/d8 mixing samples and 2:1 d0/d8 mixing samples.
Table SI-3 BSA peptide pair PRM transition list.xlsx
PRM transition list of 13 light/heavy pairs of cross-linked BSA peptides corresponding to Figure 4B. The transitions for the 3 light/heavy pairs of cross-linked BSA peptides measured in Figure 4C experiment are colored in blue.
Table SI-4 E. coli peptide pair PRM transition list.xlsx
PRM transition list of 12 light/heavy pairs of cross-linked E. coli peptides corresponding to Figure 4C.
Table SI-5 PRM experiment results.xlsx.
The log2(d8/d0) ratios of light/heavy pairs of cross-linked BSA and E. coli peptides measured in PRM experiments corresponding to Figure 4B and 4C.
Acknowledgments
The authors thank all the Bruce lab members for helpful advice and support from UWPR. This work is supported by grants from the US National Institutes of Health: R01GM086688, U19AI107775, and the California Citrus Research Board: http://citrusresearch.com/: 5300-155.
Footnotes
The following files are available free of charge at ACS website http://pubs.acs.org
References
- 1.Leitner A, Faini M, Stengel F, Aebersold R. Crosslinking and Mass Spectrometry: An Integrated Technology to Understand the Structure and Function of Molecular Machines. Trends in Biochemical Sciences. 2016;41(1):20–32. doi: 10.1016/j.tibs.2015.10.008. [DOI] [PubMed] [Google Scholar]
- 2.Liu F, Heck AJR. Interrogating the architecture of protein assemblies and protein interaction networks by cross-linking mass spectrometry. Current Opinion in Structural Biology. 2015;35:100–108. doi: 10.1016/j.sbi.2015.10.006. [DOI] [PubMed] [Google Scholar]
- 3.Holding AN. XL-MS: Protein cross-linking coupled with mass spectrometry. Methods. 2015;89:54–63. doi: 10.1016/j.ymeth.2015.06.010. [DOI] [PubMed] [Google Scholar]
- 4.Yang B, Wu YJ, Zhu M, Fan SB, Lin JZ, Zhang K, Li S, Chi H, Li YX, Chen HF, Luo SK, Ding YH, Wang LH, Hao ZQ, Xiu LY, Chen S, Ye KQ, He SM, Dong MQ. Identification of cross-linked peptides from complex samples. Nature Methods. 2012;9(9):904–906. doi: 10.1038/nmeth.2099. [DOI] [PubMed] [Google Scholar]
- 5.Liu F, Rijkers DTS, Post H, Heck AJR. Proteome-wide profiling of protein assemblies by cross-linking mass spectrometry. Nature Methods. 2015;12(12):1179–1184. doi: 10.1038/nmeth.3603. [DOI] [PubMed] [Google Scholar]
- 6.Tan D, Li Q, Zhang MJ, Liu C, Ma C, Zhang P, Ding YH, Fan SB, Tao L, Yang B, Li X, Ma S, Liu J, Feng B, Liu X, Wang HW, He SM, Gao N, Ye K, Dong MQ, Lei X. Trifunctional cross-linker for mapping protein-protein interaction networks and comparing protein conformational states. Elife. 2016;5:e12509. doi: 10.7554/eLife.12509. [DOI] [PMC free article] [PubMed] [Google Scholar]
- 7.Chavez JD, Weisbrod CR, Zheng CX, Eng JK, Bruce JE. Protein Interactions, Post-translational Modifications and Topologies in Human Cells. Molecular & Cellular Proteomics. 2013;12(5):1451–1467. doi: 10.1074/mcp.M112.024497. [DOI] [PMC free article] [PubMed] [Google Scholar]
- 8.Kaake RM, Wang XR, Burke A, Yu C, Kandur W, Yang YY, Novtisky EJ, Second T, Duan JC, Kao A, Guan SH, Vellucci D, Rychnovsky SD, Huang L. Developing A New In Vivo Cross-linking Mass Spectrometry Platform to Define Protein-Protein Interactions in Living Cells. Molecular & Cellular Proteomics. 2014;13(8):S39–S39. doi: 10.1074/mcp.M114.042630. [DOI] [PMC free article] [PubMed] [Google Scholar]
- 9.Weisbrod CR, Chavez JD, Eng JK, Yang L, Zheng CX, Bruce JE. In Vivo Protein Interaction Network Identified with a Novel Real-Time Cross-Linked Peptide Identification Strategy. Journal of Proteome Research. 2013;12(4):1569–1579. doi: 10.1021/pr3011638. [DOI] [PMC free article] [PubMed] [Google Scholar]
- 10.Navare AT, Chavez JD, Zheng CX, Weisbrod CR, Eng JK, Siehnel R, Singh PK, Manoil C, Bruce JE. Probing the Protein Interaction Network of Pseudomonas aeruginosa Cells by Chemical Cross-Linking Mass Spectrometry. Structure. 2015;23(4):762–773. doi: 10.1016/j.str.2015.01.022. [DOI] [PMC free article] [PubMed] [Google Scholar]
- 11.Schweppe DK, Harding C, Chavez JD, Wu X, Ramage E, Singh PK, Manoil C, Bruce JE. Host-Microbe Protein Interactions during Bacterial Infection. Chem Biol. 2015;22(11):1521–1530. doi: 10.1016/j.chembiol.2015.09.015. [DOI] [PMC free article] [PubMed] [Google Scholar]
- 12.Bruce JE. In vivo protein complex topologies: Sights through a cross-linking lens. Proteomics. 2012;12(10):1565–1575. doi: 10.1002/pmic.201100516. [DOI] [PMC free article] [PubMed] [Google Scholar]
- 13.Schmidt C, Robinson CV. A comparative cross-linking strategy to probe conformational changes in protein complexes. Nature Protocols. 2014;9(9):2224–2236. doi: 10.1038/nprot.2014.144. [DOI] [PMC free article] [PubMed] [Google Scholar]
- 14.Fischer L, Chen ZA, Rappsilber J. Quantitative cross-linking/mass spectrometry using isotope-labelled cross-linkers. Journal of Proteomics. 2013;88:120–128. doi: 10.1016/j.jprot.2013.03.005. [DOI] [PMC free article] [PubMed] [Google Scholar]
- 15.Walzthoeni T, Joachimiak LA, Rosenberger G, Roest HL, Malmstroem L, Leitner A, Frydman J, Aebersold R. xTract: software for characterizing conformational changes of protein complexes by quantitative cross-linking mass spectrometry. Nature Methods. 2015;12(12):1185–1190. doi: 10.1038/nmeth.3631. [DOI] [PMC free article] [PubMed] [Google Scholar]
- 16.Tang XT, Munske GR, Siems WF, Bruce JE. Mass spectrometry identifiable cross-linking strategy for studying protein-protein interactions. Analytical Chemistry. 2005;77(1):311–318. doi: 10.1021/ac0488762. [DOI] [PubMed] [Google Scholar]
- 17.Tang X, Bruce JE. A new cross-linking strategy: protein interaction reporter (PIR) technology for protein-protein interaction studies. Mol Biosyst. 2010;6(6):939–947. doi: 10.1039/b920876c. [DOI] [PMC free article] [PubMed] [Google Scholar]
- 18.Chavez JD, Schweppe DK, Eng JK, Zheng C, Taipale A, Zhang Y, Takara K, Bruce JE. Quantitative interactome analysis reveals a chemoresistant edgotype. Nature Communications. 2015;6:7928. doi: 10.1038/ncomms8928. [DOI] [PMC free article] [PubMed] [Google Scholar]
- 19.Chavez JD, Schweppe DK, Eng JK, Bruce JE. In Vivo Conformational Dynamics of Hsp90 and Its Interactors. Cell Chem Biol. 2016;23(6):716–726. doi: 10.1016/j.chembiol.2016.05.012. [DOI] [PMC free article] [PubMed] [Google Scholar]
- 20.Valot B, Langella O, Nano E, Zivy M. MassChroQ: a versatile tool for mass spectrometry quantification. Proteomics. 2011;11(17):3572–3577. doi: 10.1002/pmic.201100120. [DOI] [PubMed] [Google Scholar]
- 21.Prince JT, Marcotte EM. Chromatographic alignment of ESI-LC-MS proteomics data sets by ordered bijective interpolated warping. Analytical Chemistry. 2006;78(17):6140–6152. doi: 10.1021/ac0605344. [DOI] [PubMed] [Google Scholar]
- 22.Kerrien S, Aranda B, Breuza L, Bridge A, Broackes-Carter F, Chen C, Duesbury M, Dumousseau M, Feuermann M, Hinz U, Jandrasits C, Jimenez RC, Khadake J, Mahadevan U, Masson P, Pedruzzi I, Pfeiffenberger E, Porras P, Raghunath A, Roechert B, Orchard S, Hermjakob H. The IntAct molecular interaction database in 2012. 40(D1):D841–D846. doi: 10.1093/nar/gkr1088. [DOI] [PMC free article] [PubMed] [Google Scholar]
- 23.Leon E, Ezkurdia I, Garcia B, Valencia A, Juan D. EcID. A database for the inference of functional interactions in E. coli. 2009;37:D629–D635. doi: 10.1093/nar/gkn853. [DOI] [PMC free article] [PubMed] [Google Scholar]
- 24.Zheng C, Weisbrod CR, Chavez JD, Eng JK, Sharma V, Wu X, Bruce JE. XLink-DB: database and software tools for storing and visualizing protein interaction topology data. Journal of Proteome Research. 2013;12(4):1989–1995. doi: 10.1021/pr301162j. [DOI] [PMC free article] [PubMed] [Google Scholar]
- 25.Schweppe DK, Zheng C, Chavez JD, Navare AT, Wu X, Eng JK, Bruce JE. XLinkDB 2.0: integrated, large-scale structural analysis of protein crosslinking data. Bioinformatics. 2016;32(17):2716–2718. doi: 10.1093/bioinformatics/btw232. [DOI] [PMC free article] [PubMed] [Google Scholar]
Associated Data
This section collects any data citations, data availability statements, or supplementary materials included in this article.
Supplementary Materials
Figure SI-1 Identification process of light and heavy cross-linked peptide pairs from ReACT LC-MS experiments.
Figure SI-2 E. coli protein-protein interaction network obtained from the large-scale in vivo qCL-MS dataset.
Figure SI-3 Distribution of Cα-Cα distance (N=665) of the cross-linking sites discovered in this in vivo CL-MS E. coli dataset based on crystallography structure available from PDB.
Figure SI-4 Scatter plot showing 95% confidence intervals of log2(d8/d0) ratio of the cross-linked E. coli peptide pair quantified multiple times in the (A) 1:2 (d0/d8) mixing sample (N=656) and (B) 2:1(d0/d8 mixing sample (N=601).
Figure SI-5 Correlation of log2(d8/d0) ratios of cross-linked E. coli peptides measured in the 1:2 (d0/d8) mixing and those measured in 2:1 (d0/d8) mixing experiments (N=655). The blue dash lines (x=1, y= −1) indicate the expected log2 ratios and the red dash lines (x=0.81, y= −1.24) indicate median log2 ratios from the two experiments.
Figure SI-6 Histogram (N=655) (A) and scatter plot of 95% confidence intervals (N=504) (B) of the differences of absolute value of mean log2(d8/d0) ratios of cross-linked E. coli peptides measured from the 1:2 d0/d8 mixing and 2:1 d0/d8 mixing experiments.
Table SI-1 E. coli cross-linked peptides identification.xlsx.
Summary of in vivo cross-linked E. coli peptide pairs identified from each LC-ReACT run.
Table SI-2 E. coli cross-linked peptides ratio.xlsx.
Summary of Log2 (d8/d0) ratios and corresponding standard deviations, 95% confidence intervals of the light/heavy E. coli peptide pairs quantified by LC-ReACT from the 1:2 d0/d8 mixing samples and 2:1 d0/d8 mixing samples.
Table SI-3 BSA peptide pair PRM transition list.xlsx
PRM transition list of 13 light/heavy pairs of cross-linked BSA peptides corresponding to Figure 4B. The transitions for the 3 light/heavy pairs of cross-linked BSA peptides measured in Figure 4C experiment are colored in blue.
Table SI-4 E. coli peptide pair PRM transition list.xlsx
PRM transition list of 12 light/heavy pairs of cross-linked E. coli peptides corresponding to Figure 4C.
Table SI-5 PRM experiment results.xlsx.
The log2(d8/d0) ratios of light/heavy pairs of cross-linked BSA and E. coli peptides measured in PRM experiments corresponding to Figure 4B and 4C.