Summary
In eukaryotes, up to a third of cellular proteins are targeted to the endoplasmic reticulum (ER), where they undergo folding, processing, sorting and trafficking to subsequent endomembrane compartments1. ER targeting has been shown to occur cotranslationally by the SRP (Signal Recognition Particle) pathway2 or post translationally by the mammalian TRC40 (Transmembrane Recognition Complex of 40kDa)3,4 and its homologous yeast GET (Guided Entry of Tail-anchored proteins)5,6 pathways. Despite the wide breadth of proteins that can be catered for by these two pathways, many proteins are still known to be both SRP and GET independent, hence there seems to be a critical need for an additional dedicated pathway for ER relay7,8.
We set out to uncover additional targeting proteins using unbiased high-content screening approaches. To this end, we performed a systematic visual screen using the yeast Saccharomyces cerevisiae9,10, and uncovered three uncharacterized proteins whose loss affected targeting. We suggest that these proteins work concertedly and demonstrate that they function in parallel to both SRP and GET to target a broad range of substrates. The three proteins, which we now name SND1, SND2 and SND3 (SRP-iNDependent targeting), can synthetically compensate for the loss of both the SRP and GET pathway, and act as a backup targeting system. This explains why it has previously been difficult to demonstrate complete loss of targeting for some substrates. Our discovery thus puts in place an essential piece of the ER targeting puzzle, highlighting how the targeting apparatus of the eukaryotic cell is robust, interlinked and flexible.
To uncover factors that contribute to ER targeting, we devised a high-content screen in the yeast Saccharomyces cerevisiae (Fig. 1a). We followed the fate of a model substrate, Gas1, known to both be completely SRP-independent as well as only partially dependent on GET9,10. Using automated techniques11,12, we integrated fluorescently tagged Gas1 (RFP-Gas1) into ~6000 strains harboring mutations in every yeast gene13,14 and imaged them on an automated fluorescence-microscopy platform15. We visually inspected for strains where Gas1 localized differently than WT or negative controls (cell-wall and vacuole) (Fig. 1b, Extended Data Fig. 1a). In strains mutated in the canonical translocon subunit, Sec6116, the auxiliary complex that facilitates SRP-independent translocation (Sec62, Sec63, Sec66, Sec72)17 or the GET pathway (Get3)6, Gas1 accumulated in the cytosol, where it aggregated as expected (Fig. 1b) (for a full list of genes that displayed an altered phenotype see Supplementary Table 1).
Figure 1. A systematic screen uncovers uncharacterized ER targeting elements.
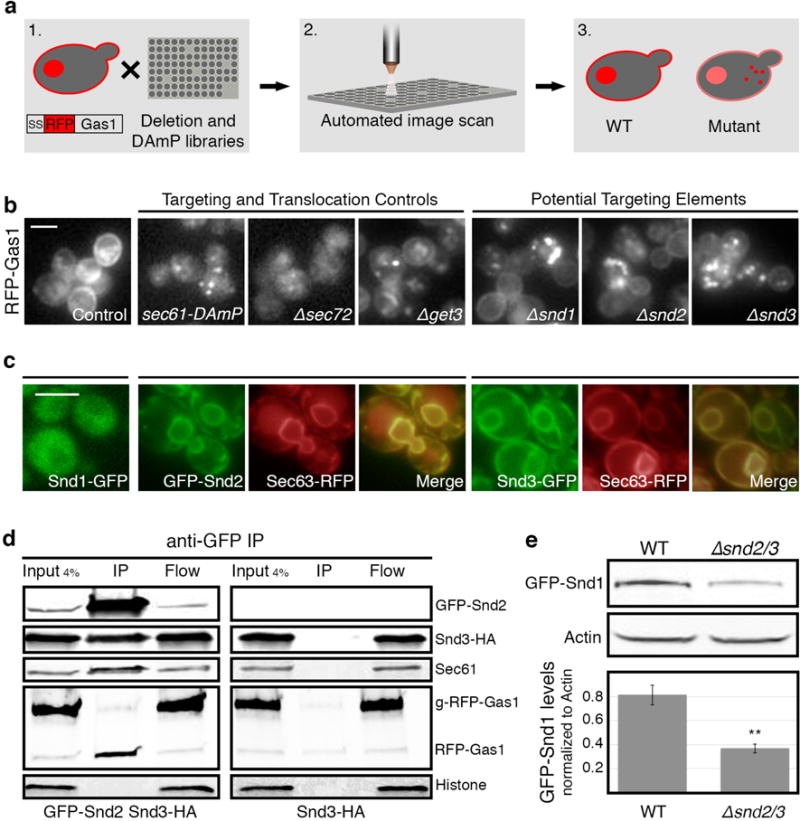
(a) A systematic screen for localization of SS-RFP-Gas1 on background of yeast mutant libraries.
(b) Mutants of SND1/2/3 (Srp iNDependent targeting), affect SS-RFP-Gas1 targeting similarly to known translocation/targeting mutants. Scale bars throughout figure, 5 μm.
(c) Localization of GFP tagged Snd1/2/3. ER is marked by Sec63-RFP.
(d) Anti-GFP immunoprecipitation of GFP-Snd2/Snd3-HA strain and the negative control Snd3-HA. GFP-Snd2 co-immunoprecipitated with Snd3-HA, Sec61, and the uninserted, cytosolic form of RFP-Gas1.
(e) GFP-Snd1 levels decrease in Δsnd2/3 compared to WT. (Data shown are means +/− s.e.m. **p<0.01, by two-tailed Student’s t-test, n=3, biological replicates).
For gel source data see Supplementary Figure 1.
Three uncharacterized mutants showed a similar mislocalization effect to Δget3 strain (Fig. 1b). Since the Gas1 foci formed in the three mutants co-localized with a soluble misfolded marker18 (Extended Data Fig. 1b), and since the mutants did not affect the localization of an SRP-dependent substrate (Extended Data Fig. 1c), we named these new elements SND (Srp-iNDependent targeting) proteins.
Snd1 (YDR186C) is predicted to be soluble (Extended Data Fig. 1d), localizes to the cytosol19 (Fig. 1c. For verification that all tagged SND proteins are functional see Extended Data Fig. 1e) and was proposed to be a peripheral ribosomal protein20. Snd2 (ENV10/YLR065C) is predicted to have four transmembrane domains (Extended Data Fig. 1d), localizes to the ER membrane (Fig. 1c) and was previously shown to affect carboxypeptidase Y (CPY) maturation21. The human orthologue of Snd2, TMEM208 (from hereon referred to as hSnd2), was previously shown to localize to the ER when tagged22. We confirmed localization of the native protein by raising antibodies against hSnd2 and could indeed detect it in canine pancreatic microsomes and enriched in ER fractions of HEK293 cells (Extended Data Fig. 1f,g). The third protein, Snd3 (PHO88/YBR106W), is predicted to have one transmembrane domain (Extended Data Fig. 1d), and is localized to the ER19 (Fig. 1c). Loss of SND3 was shown to affect secretion of the yeast acid phosphatase via an unknown mechanism23.
To understand whether the SND proteins work cooperatively in a pathway or complex we immunoprecipitated GFP-Snd2 and GFP-Snd3, and by mass spectrometry analysis found both of them to physically interact with components of the targeting and translocation apparatus of the cell (Supplementary Table 2). Interestingly, GFP-Snd2 pull downs were enriched for Snd1 (Supplementary Table 2). Snd2 also co-immunoprecipitated together with Snd3 as well as Sec61 (Fig. 1d). Moreover, we found Snd2 and Snd3 in a complex with the translocon when assayed by blue native gel electrophoresis followed by SDS-PAGE (Extended Data Fig. 2a). In support of a role in targeting substrates to the translocation machinery, we also detected an interaction between the Snd2/3 complex and the cytosolic (i.e non translocated and unglycosylated) fraction of our model substrate, RFP-Gas1 (Fig. 1d).
Next, we found that the stability of Snd1 protein is compromised in Snd2/3 mutants (Fig. 1e). Conversely, Snd2 and Snd3 localizations were altered upon loss of other SND components (Extended Data Fig. 2b). Examining their genetic interactions we observed a synthetic sick interaction between Δsnd3 and Δsnd1/2 when inspecting colony sizes (Extended Data Fig. 2c), but complete epistasis of snd3 mutants with both Snd1 and Snd2 in their effect on Gas1 aggregation (Extended Data Fig. 2d,e). As only the deletion of SND3 leads to impaired growth rate (Extended Data Fig. 2c), and as the Snd3 protein is an order of magnitude more abundant than Snd1/224, it is possible that its synthetic growth interaction is due to an additional cellular role, unrelated to its common function with SND1/2. Taken together, these findings support that the SND proteins function in a joint targeting pathway.
To directly assay whether SND proteins affect targeting and uncover their substrate range, we turned to proximity-specific ribosome-profiling25 (Fig. 2a). Indeed, a subset of transcripts were depleted on the ER membrane in the Δsnd cells, providing independent evidence that the SND machinery has a role in targeting these substrates to the ER surface as they are being translated (Fig. 2b). The proteins most affected in the Δsnd mutants have been previously shown to accumulate on the ER membrane in the presence of the translational inhibitor cycloheximide, indicative of targeting that is only loosely coupled to translation25. Interestingly, transcripts encoding proteins bearing an N′ TMD (i.e. in the first 95 amino acids, within the optimal recognition window of SRP26) did not appear to be effected, while proteins with more downstream TMDs, were depleted in all three Δsnd strains (Fig. 2c, for a full list of transcripts affected in SND mutants see Supplementary Table 3).
Figure 2. SNDs affect the targeting of proteins with downstream transmembrane domains.
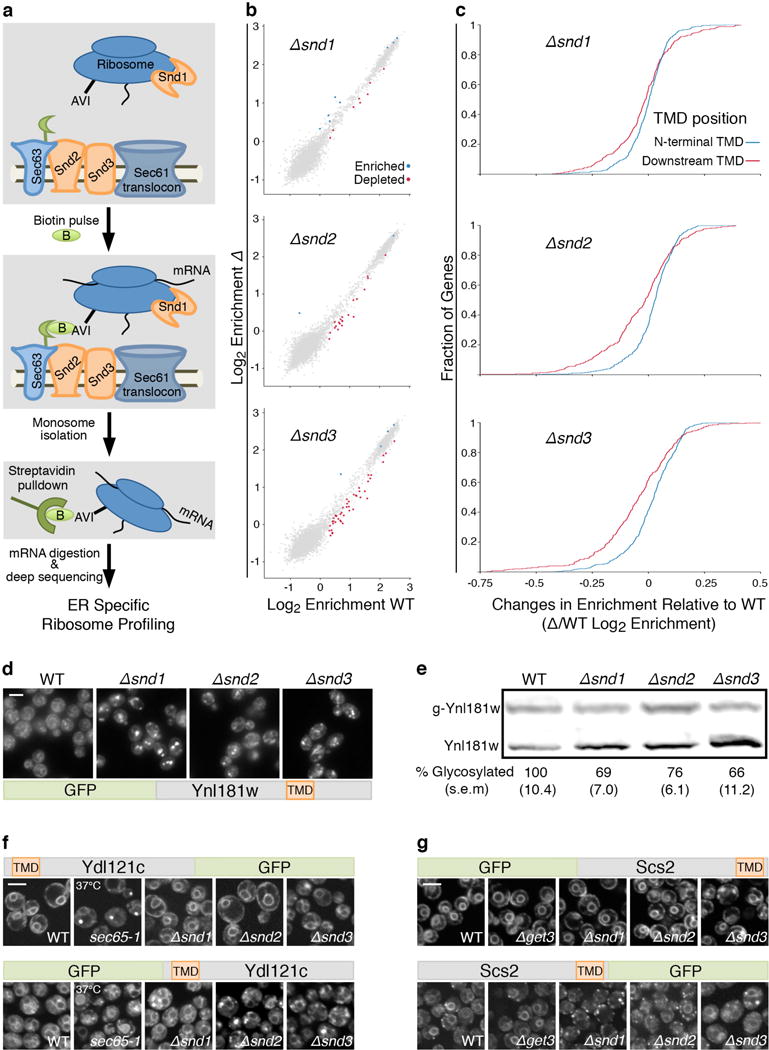
(a) Schematic of proximity-specific ribosome-profiling.
(b) Translational enrichment on the ER surface. Significantly enriched/depleted transcripts in Δsnds compared to WT: blue/red circles.
(c) Cumulative distribution of ER-enrichments of proteins with downstream TMDs (after 95 amino-acids, red) or with an N-terminal TMD (in the 1st 95 amino-acids, blue).
(d) Microscopy images of GFP-Ynl181w. Scale bars throughout figure, 5 μm.
(e) Western blot of translocation efficiency of glycosylatable HA (HA-Gly) tagged Ynl181w (data shown are means (s.e.m.), n=3, biological replicates).
(f) Microscopy of re-engineered Ydl121c or (g) Scs2, on the background of targeting mutants.
For gel source data see Supplementary Figure 1.
To verify the results of the ribosome-profiling assay, we assayed a representative secretory protein, Ynl181w, whose first TMD is in the central portion of the protein. Indeed, Ynl181w showed reduced targeting in the SND deletions by both microscopy and in-vivo translocation assays (Fig. 2d,e).
Our data suggests that the location of the first TMD within the protein is a major determinant of SND targeting and therefore merely altering the relative position of the first TMD in the protein should alter its pathway dependence. To test this idea, we re-engineered two secretory substrates to alter their TMD position and tested their targeting dependence. Indeed simply moving the TMD of two different substrates could alter their dependence on SRP, SND or GET pathways (Fig. 2f,g, Extended Data Fig. 3).
Taken together our results suggest that either SND proteins specifically recognize substrates with central TMDs or that SNDs cater for a broad substrate range, but their loss if only visible for those substrates not efficiently targeted by SRP or GET. To differentiate between these two scenarios, we turned to investigate the relationship between the SNDs, SRP and GET.
To explore the interaction between the SNDs and the SRP pathway we used the previously described sec65-1 temperature sensitive strain, which has reduced SRP function at the permissive temperature and complete loss of SRP at the restrictive one. On this background we expressed the SND genes under the inducible GAL1 promoter (Galp), which leads to either full repression (in glucose) or over-expression (in galactose). We found that slightly reduced SRP activity leads to synthetic lethality with loss of SND2 or SND3 (Fig. 3a), whereas overexpressed SND2 or SND3 could rescue a complete loss of SRP function (Fig. 3b) (although Sec65 and Snd levels remained unchanged (Extended Data Fig. 4a,b)). The rescue in viability was due to a dramatic rescue of the cell’s targeting capabilities by SND proteins (Fig. 3c,d, Extended Data Fig. 4c). These findings suggest that the SND proteins provide an alternate targeting route for a broad substrate range, which includes targets that, under normal physiological conditions, are most likely efficiently captured by SRP.
Figure 3. SND proteins can compensate for loss of SRP.
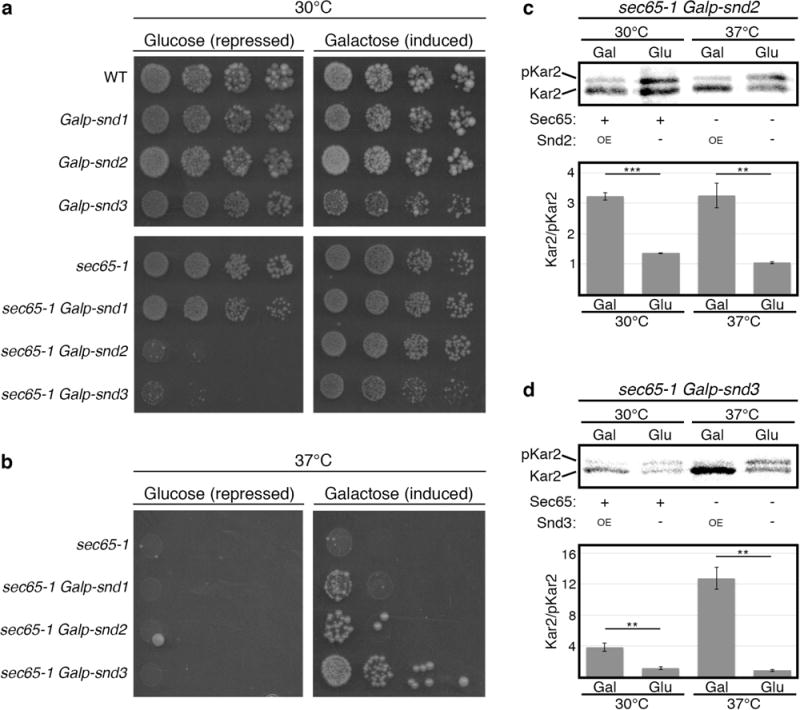
SND genes were expressed under the repressible (glucose) or inducible (galactose) Gal1 promoter.
(a) Growth in permissive-temperature (30°C) (mild compromise of SRP). Repression of SNDs leads to a synthetic-sick phenotype.
(b) Growth in restrictive temperature (37°C). Over-expression of SNDs rescues lethality.
(c, d) Metabolic labeling of Kar2. When overexpressing either SND2 (c) or SND3 (d), Kar2 was translocated significantly better than when SND2/3 were repressed (data shown are means +/− s.e.m., **p<0.01 ***p<0.001, by two-tailed Student’s t-test, n=3, biological replicates). Stronger Snd3-dependent translocation may explain the stronger rescue of this strain (b).
For gel source data see Supplementary Figure 1.
If indeed SND proteins act as a targeting pathway with a broad substrate range, then the SND and GET pathways should also act as functional backup for each other. It was previously shown27 and verified by us (Fig. 4a) that deleting SND genes becomes lethal in the absence of members of the GET pathway. However, concomitant loss of SND genes with mutants in the auxiliary translocon (Δsec72) is epistatic/additive, suggesting that the SNDs target proteins to the SRP-independent translocon (Extended Data Fig. 5a).
Figure 4. The GET and SND pathways act as backup for targeting in-vivo.
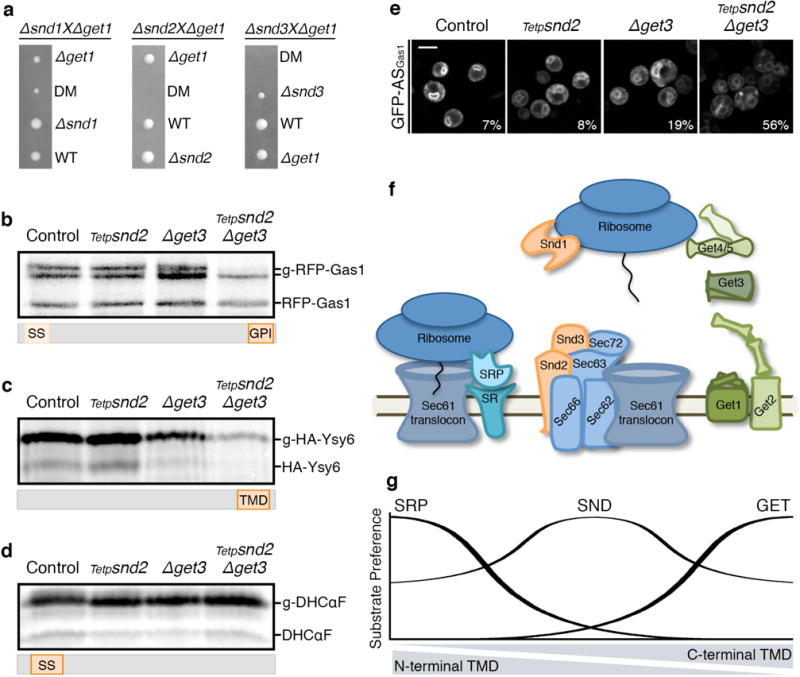
(a) Tetrads from Δsnd/Δget diploids demonstrate a synthetic sick/lethal interaction.
(b–d) Metabolic labeling of RFP-Gas1 (b), HA-Ysy6 (c) or DHCαF (d) showing decrease in translocated forms only for SRP-independent substrates in the conditional SND2/GET3 double-mutant. Accumulation of pre-inserted forms cannot be observed due to lack of proteasomal inhibition. Results repeated in three biological replicates.
(e) GFP fused to Gas1 GPI-anchoring sequence (GFP-ASGas1). Percentage of cells (from 100) with mistargeting depicted on images. Scale bar, 5 μm.
(f) Scheme of the eukaryotic ER-targeting apparatus.
(g) Model of the ER-targeting pathways’ interplay.
For gel source data see Supplementary Figure 1.
To ascertain that the cause of death of the double snd/get mutants lay in drastic alterations of targeting efficiency, we created a conditional double mutant for Snd2 and Get3, whose double deletion is synthetic lethal (Extended Data Fig. 5a,b). Metabolic labeling of RFP-Gas1 clearly demonstrated that while the single mutants (Tetp-snd2 or Δget3) had only a small effect on translocation efficiency (Extended Data Fig. 5c,d), the double mutant showed a marked decrease in mature RFP-Gas1 (Fig. 4b). The same is true for the known GET pathway substrate, the TA protein Ysy66 (Fig. 4c), verifying our hypothesis that the two pathways work in parallel to ensure robust targeting. Conversely, when we used this system to test CPY or the SRP-dependent substrate, DHCαF, their translocation was not hampered in either the single or the double mutants (Fig. 4d, Extended Data Fig. 5e,f,g), excluding any secondary effects of the double knock down.
Supporting our hypothesis that SND and GET have functional redundancy for targeting proteins with downstream targeting signals, we find that a synthetic construct of GFP fused to the C′ GPI-anchoring sequence of Gas1 (GFP-ASGas1)9 can target nicely in the absence of either SND or GET but is dramatically affected in the snd/get double mutant (Fig. 4e). Hence, our results uncover the parallel function between the SND and GET pathways in targeting proteins with downstream hydrophobic motifs.
Altogether, these data reveal that the SNDs can target a diversity of proteins with signals dispersed throughout the entire protein range. Moreover, they highlight a complex interconnected web with the two known targeting pathways that may explain the difficulty in uncovering the SND pathway originally.
Although the mechanistic details are yet to be uncovered, it is tempting to speculate the mode of function of the SND pathway (Fig. 4f). Since Snd1 is predicted to interact with ribosomes20, it may be involved in capturing nascent substrates. Snd2 and Snd3, both ER transmembrane proteins that form a complex together with the translocon (Fig. 1d, Extended Data Fig. 2a) could act as receptors in promoting substrate capture and handoff to the translocon. It would be interesting to investigate whether the human ortholog hSnd2 has a similar role in mammalian cells.
Our data shows that the three pathways, SRP, SND and GET, work in parallel to facilitate ER targeting of proteins bearing targeting motifs in all possible positions (Fig. 4g). If there is no distinct transmembrane position at which one pathway ceases to function and another steps in but rather that there is a gradual decrease/increase in affinities, this would explain the substrate overlap between the pathways and the difficulties in reaching coherent understanding of the targeting requirements for many substrates7. More generally, discovering the role of the SND proteins demonstrates once again the intricacy and complexity of the cellular network engaged in efficient targeting.
Methods
Yeast Strains and Strain Construction
Yeast strains are all based on the BY4741 laboratory strain28. Manipulations were performed using a standard PEG/LiAC transformation protocol29. All deletions were verified using primers from within the endogenous open reading frame. Primers for all genetic manipulations were either planned manually or by Primers-4-Yeast web tool30. All strains, primers and plasmids used in this study are listed in Supplementary Table 428,31–34.
Automated yeast library manipulations and high-throughput microscopy
SGA and microscopic screening were performed using an automated microscopy setup as previously described11,15, using the RoToR bench-top colony arrayer (Singer Instruments) and automated inverted fluorescent microscopic ScanR system (Olympus). Images were acquired using a 60X air lens with excitation at 490/20 nm and emission at 535/50 nm (GFP) or excitation at 575/35 nm and emission at 632/60 nm (RFP). After acquisition, images were manually reviewed using the ScanR analysis program.
Manual microscopy
Manual microscopy was performed using by one of two apparatuses: (I) Olympus IX71 microscope controlled by the Delta Vision SoftWoRx 3.5.1 software. Images were acquired using a 60X oil lens and captured by PhoetometricsCoolsnap HQ camera with excitation at 490/20 nm and emission at 528/38 nm (GFP/YFP) or excitation at 555/28 nm and emission at 617/73 nm (mCherry/RFP). (II) VisiScope Confocal Cell Explorer system, composed of a Zeiss Yokogawa spinning disk scanning unit (CSU-W1) coupled with an inverted Olympus IX83 microscope. Images were acquired using a 60X oil lens and captured by a connected PCO-Edge sCMOS camera, controlled by VisView software, with wavelength of 488nm (GFP) or 561nm (mCherry/RFP). Images were transferred to Adobe Photoshop CS6 for slight contrast and brightness adjustments.
Co-Immunoprecipitation
Lysates for immunoprecipitations were prepared from indicated strains in mid-logarithmic growth grown in YPD reach media. Cells were harvested, washed in distilled water, and resuspended in lysis buffer (50 mM Tris HCl pH 7, 150 mM NaCl) supplemented with protease inhibitors (Complete EDTA-free cocktail; Roche) and frozen in a drop-by-drop fashion in liquid nitrogen. Frozen cells were then pulverized in a ball mill (1 min at 30 Hz; Retsch), thawed with nutation. Samples were thawed in 1ml lysis buffer supplemented with protease inhibitors and 1% CHAPS (Sigma Aldrich) at 4°C for 1 hour. All samples were then clarified by centrifugation at 14000 × g at 4°C for 15 minutes. The remaining supernatant was added to GFP-trap (Chromotek) for 1 hour followed by centrifugation at 1000 × g at 4°C for 3 minutes, and the supernatant was set aside as the flow through. Beads were washed three times with lysis buffer supplemented with protease inhibitors, and bound proteins were released from the beads by a 5 minute incubation in 95°C in sample buffer. The total protein lysate, the flow through and the immunoprecipitation (IP) fraction were analyzed by western blot.
Western blot analysis
Yeast proteins were extracted either by NaOH or TCA protocol as previously described9,35 and resolved on polyacrylamide gels, transferred to nitrocellulose membranes blots, and probed with primary rabbit/mouse antibody against HA (BioLegend, 901502), GFP (Abcam ab290), RFP (Abcam ab62341), Histone H3 (Abcam ab1791), Actin (Abcam ab8224), Sec65 (kindly provided by Peter Walter) or Sec61 (kindly provided by Mathias Seedorf). The membranes were then probed with a secondary goat-anti-rabbit/mouse antibody conjugated to IRDye800 or to IRDye680 (LI-COR Biosciences). Membranes were scanned for infrared signal using the Odyssey Imaging System. Images were transferred to Adobe Photoshop CS6 for slight contrast and brightness adjustments.
Metabolic labeling
Newly synthesized yeast proteins were radioactively labeled in-vivo by a 7–10 minute pulse with [35S] methionine in either 30°C or 37°C. Labeling was stopped by adding to the cells ice-cold TCA to a final concentration of 10%. Cells were then lysed and proteins were immunoprecipitated as previously described36 with an antibody against RFP (Abcam, ab62341), HA (BioLegend, 901502), Kar2 (kindly provided by Peter Walter) or CPY (Abcam, ab113685). Protease inhibitors (Complete EDTA-free cocktail; Roche) were used throughout the extraction and immunoprecipitation process. Immunoprecipitated samples were resolved on polyacrylamide gels, which were then exposed to Phosphor Screen (GE Life Sciences) and scanned by phosphorimager. Translocation efficiency was calculated as . Differences were measures for statistical significance using two-tailed student t-test with unequal variance, as indicated in the figure legends. For the Tetp-repression experiments, doxycycline (Sigma-Aldrich) was added to the over-night culture and to the back-dilution media at a final concentration of 15 μg/ml.
Proximity specific ribosome-profiling
The ribosomal subunits RPL16a/b were conjugated to AVI-tag (biotin acceptor peptide), and Sec63 was conjugated to BirA (biotin ligase), allowing the specific biotinylation and streptavidin pull-down of ribosomes in close physical proximity to the ER membrane. By comparing the ribosomal footprints obtained from the total ribosome fraction and the streptavidin-pulled fraction, ER-localized translation enrichment was measured. Biotin induction was carried out at mid-logarithmic growth phase in the presence of cycloheximide, which was added to media 2 minutes prior to the addition of biotin, at a final concentration of 100 μg/mL. To induce biotinylation, d-biotin was added to the media to a final concentration of 10 nM and biotinylation was allowed to proceed for 2 minutes at the same temperature as growth. Cells were harvested by filtration onto 0.45 μm pore size nitrocellulose filters (Whatman), scraped from the membrane, and immediately submerged in liquid nitrogen. The following steps of monosome isolation, Streptavidin pulldown of biotinylated ribosomes, and library generation were done as previously described25.
Ribosome-profiling computational analysis
Footprint sequence
Sequencing reads were demultiplexed and stripped of 3′ cloning adapters using in-house scripts. Reads were mapped sequentially to Bowtie indices composed of rRNAs, tRNAs, and finally all chromosomes using Bowtie 1.1.0. Only uniquely-mapped, zero-mismatch reads from the final genomic alignment were used for subsequent analyses. These alignments were assigned a specific P-site nucleotide using a 15-nt offset from the 3′ end of reads.
Gene enrichments
Gene-level enrichments were computed by taking the log2 ratio of biotinylated footprint density (reads per million) within a gene coding sequence (CDS) over the corresponding density of matched input ribosome-profiling experiment. Yeast genes were excluded from all analysis if they met any of the following criteria: had fewer than 100 CDS-mapping footprints in the input sample of a particular experiment; annotated as ‘dubious’ in the SGD database; gene maps to the mitochondrial chromosome. Additionally regions where CDS overlaps another same-strand CDS were excluded from enrichment calculations.
TMD classifications
TMD positions were predicted using Phobius algorithm. TMD classification was divided based on the start site of the 1st predicted TMD: N-terminal TMDs start in the 1st 95 amino acids of the protein; downstream TMDs start after the 1st 95 amino acids of the protein.
SND-dependent genes
Genes that were dependent on SND components were identified by comparing the Sec63-BirA ER enrichments in a wild type strain (yJW1784) versus a Δsnd strain (yJW1811, yJW1812, or yJW1813) as previously described25. Briefly, log2 enrichments were separately normalized by subtracting the mean enrichment and dividing by the standard deviation of enrichments for the corresponding experiment. Genes were then binned by the minimum number of sequencing counts in either WT or Δsnd input sample, and the difference between normalized enrichments was compared within each bin. Enriched genes were defined as those genes whose Δsnd log2 enrichments were greater than 0.3 and whose enrichments increased in the Δsnd sample by at least 2 standard deviations compared to other genes in that bin. Depleted genes were defined as those genes whose wild type log2 enrichments were greater than 0.3 and whose enrichments decreased in the Δsnd sample by at least 2 standard deviations compared to other genes in that bin. Significant depletion of 10–23%, 9–42% and 14–45% was observed in Δsnd1, Δsnd2 and Δsnd3 respectively. Including or excluding SS bearing proteins had no effect on this trend. Mitochondrial proteins were excluded from the analysis.
Immunoprecipitation followed by Mass Spectrometry
Lysates for immunoprecipitations were prepared from yeast that express GFP-tagged SND genes or a constitutively expressed GFP negative control, in mid-logarithmic growth grown in YPD reach media. Cells were harvested, washed in distilled water, and resuspended in lysis buffer (50 mM Tris HCl pH 7, 150 mM NaCl) supplemented with protease inhibitors (Complete EDTA-free cocktail; Roche) and frozen in a drop-by-drop fashion in liquid nitrogen. Frozen cells were then pulverized in a ball mill (1 min at 30 Hz; Retsch), thawed with nutation. Samples were thawed in 1ml lysis buffer supplemented with protease inhibitors and 1% digitonin (Sigma Aldrich) at 4°C for 1 hour. All samples were then clarified by centrifugation at 14000 × g at 4°C for 15 minutes. The remaining supernatant was added to GFP-trap (Chromotek) for 1 hour followed by three washes with lysis buffer supplemented with protease inhibitors and 1% digitonin. Bound proteins were released from the beads by a 5 minute acidic treatment (0.2 M Glycine pH 2.5), which was neutralized with 1 M Tris pH 9.4. The eluted proteins were digested with 0.4μg sequencing grade trypsin for 2h, in the presence of 100μl of 2 M urea, 50 mM Tris HCl pH 7.5, 1 mM DTT Resulting peptides were acidified with Trifluoroacetic acid (TFA) and purified on C18 StageTips. LC-MS/MS analysis was performed on the EASY-nLC1000 UHPLC (Thermo Scientific) coupled to the Q-Exactive mass spectrometer (Thermo Scientific). Peptides were loaded onto the column with buffer A (0.5% acetic acid) and separated on a 50 cm PepMap column (75 μm i.d. 2 μm beads; Dionex) using a 4 hours gradient of 5–30% buffer B (80% acetonitrile, 0.5% acetic acid). Interactors were extracted by comparing the protein intensities to a GFP control.
Blue native gel electrophoresis
Yeast microsomes were extracted from ADHp-SND2-GFP/SND3-HA strain as described37. In brief, spheroplasts of yeast were lysed by dounce homogenization (25 strokes) in lysis buffer (0.1 M Sorbitol, 20 mM HEPES pH 7.4, 50 mM Potassium acetate, 2 mM EDTA, 1 mM DTT, 1 mM PMSF) at 4°C. The lysates were centrifuged at 1000g and the resulting supernatant at 27,000g for 10 min at 4°C. The crude membrane pellet was re-suspended in lysis buffer and layered onto a discontinuous sucrose density gradient consisting of 1.2 and 1.5 M sucrose. Following centrifugation at 100,000g for 60 min at 4°C the membranes at the 1.2–1.5 M sucrose interface were collected and washed twice in lysis buffer. The membrane pellets were re-suspended in membrane storage buffer (50 mM Nacl, 0.32 M sucrose, 20 mM HEPES pH 7.4, 2 mM EDTA containing protease inhibitors) and the protein concentration determined by a standard Bradford assay.
Microsomes were solubilized in ComplexioLyte 48 buffer (1mg/ml, Logopharm) for 30 min at 4°C38. Solubilised extracts were centrifuged at 100,000g for 30 min at 4°C and supplemented with glycerol (5%) and Coomassie G-250 (0.3%) and loaded on a 3.5–15% linear native polyacrylamide gel. The BN-PAGE gel was prepared according to39. The gel buffer contained 25 mM imidazole and 500 mM 6-Aminohexanoic acid. The cathode chamber was first filled with cathode buffer B (50 mM Tricine, 7.5 mM imidazole and 0.02% coomassie) and subsequently replaced by cathode buffer B/10 (containing 0.002% coomassie) after the gel running front had covered a third of the desired distance of electrophoresis. The anode chamber was filled with 25 mM imidazole, pH 7.0. A high molecular weight calibration kit for native electrophoresis from GE Healthcare was used as a standard. For 2D BN-PAGE, the excised lanes were equilibrated in 2D-dissociation buffer (60 mM Tris/HCl pH 6.8, 10% glycerol, 2% SDS, 5% v/v β-Mercaptoethanol, 6 M Urea) prior to separation on the second dimension by SDS-PAGE. After electro-blotting, the nitrocellulose membrane was detected with the indicated antibodies.
Analysis of human cells
The HEK293 cell line used was obtained from DSMZ (no. ACC 305). DSMZ supplied verification of authentication of the cells, tested by DSMZ via short tandem repeat loci (STR profile). The cell line is routinely tested for mycoplasma contamination. This cell line was chosen as it is routinely used for fractionation experiments.
Rough microsomes from human cells were prepared as described40. Briefly, 30×106 HEK293 cells were harvested and washed once with PBS and twice with buffer 1 (50 mM HEPES/KOH pH 7.5; 0.25 M sucrose; 50 mM KOAc; 6 mM MgOAc; 4 mM PMSF; 1 mM EDTA; 1 mM DTT; 0.1 mg/ml Cycloheximide; 0.3 U/ml RNAsin (Promega); protease inhibitor cocktail). After homogenization in buffer 1 using a glass/Teflon homogenizer the suspension was centrifuged at 1,000 g for 10 min. The supernatant was centrifuged at 10,000 g for 10 min. The new supernatant was layered onto 0.6 M sucrose in buffer 2 (50 mM HEPES/KOH pH 7.5; 0.6 M sucrose; 100 mM KOAc; 5 mM MgOAc; 4 mM DTT; 0.1 mg/ml Cycloheximide; 40 U/ml RNAsin) and centrifuged at 230,000 g for 90 min. The resulting membrane pellet was previously shown to comprise rough ER. Here, it was resuspended in buffer 2 and adjusted to 2.3 M sucrose, which was overlaid with 1.9 and 0 M sucrose, respectively, in buffer 2. After flotation at 100,000 g for 18 h, the interphase between 0 and 1.9 M sucrose, two fractions of the remaining supernatant, and the pellet were collected. After centrifugation of the interphase at 100,000 g for 1 h, the membrane pellet corresponded to purified rough ER. All steps after the first washing step were carried out on ice.
Western blots analyses employed antibodies against ß-actin (Sigma), CAML (Synaptic Systems SA7679), or rabbit antibodies that were raised against the depicted proteins: the COOH-terminal peptide of hSnd2 (KRQRRQERRQMKRL) plus an amino-terminal cysteine; against an internal peptide of SRα (KKFEDSEKAKKPVR) plus a carboxy-terminal cysteine, cross-linked to KLH. The SRα and ß-actin antibodies were visualized using ECL™ Plex goat-anti-rabbit IgG-Cy5-conjugate or ECL™ Plex goat-anti-mouse IgG-Cy3-conjugate (GE Healthcare) and the Typhoon-Trio imaging system (GE Healthcare) in combination with the Image Quant TL software 7.0 (GE Healthcare). The hSnd2 and CAML antibodies were visualized using secondary peroxidase (POD)-coupled anti-rabbit antibody (Sigma) plus ECL (GE Healthcare) and the Fusion SL luminescence-imaging system (Peqlab) in combination with the Image Quant TL software 7.0.
Data availability
The data that support the findings of this study are available from the authors on reasonable request.
Extended Data
Extended Data Figure 1.
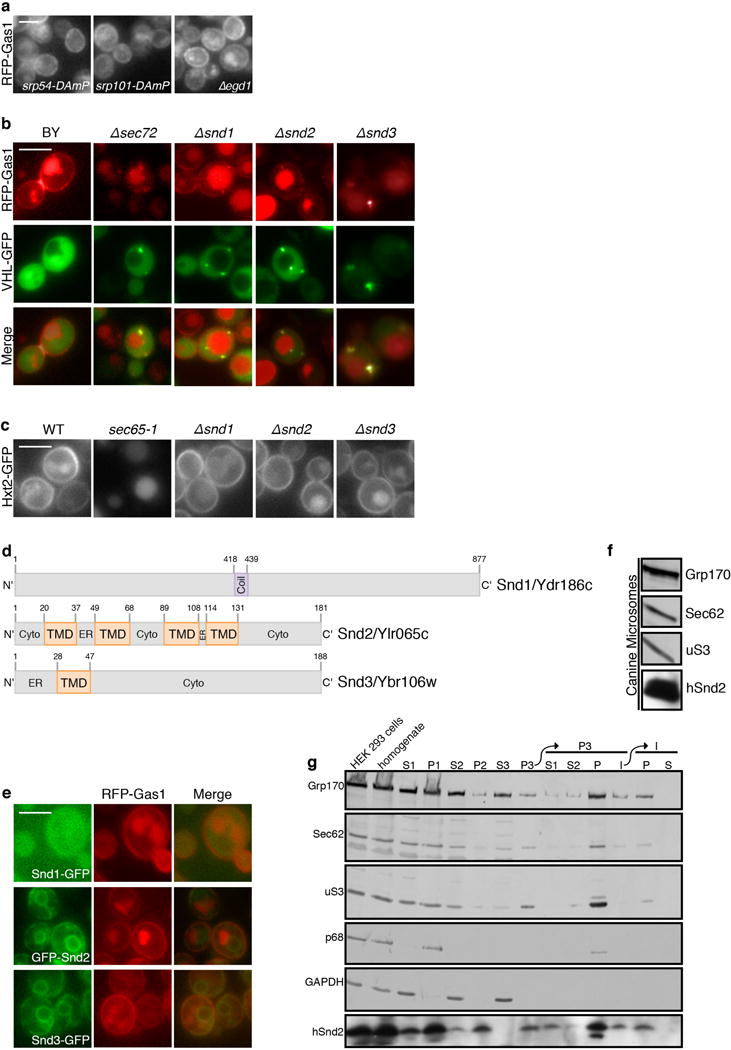
(a) RFP-Gas1 localization is not affected by mutants in SRP or NAC
Fluorescent micrographs of RFP-Gas1 confirm that it is not mislocalized when components of SRP, SRP receptor or NAC are compromised (control image can be found in Fig.1b). Scale bars throughout figure, 5 μm.
(b) SND mutants accumulate RFP-Gas1 in inclusions
Fluorescent micrographs of RFP-Gas1 confirm that its accumulation in Δsnd strains colocalize with the cytosolic inclusion marker, VHL-GFP.
(c) SND deletions do not have a non-specific effect on translation, targeting or translocation.
A fluorescently tagged SRP substrate (Hxt2-GFP) was mislocalized only in the temperature sensitive strain, sec65-1, when grown in the restrictive temperature of 37°C (under these conditions the cells are depleted for functional SRP). SND deleted strains display normal cell surface localization of Hxt2.
(d) Schemes of SND proteins
Schematic representation of the structural elements and topology-predictions of Snd1 (top), Snd2 (middle) and Snd3 (bottom). Numbers indicate the number of amino acids in the proteins.
(e) GFP-tagged SND proteins are functional
RFP-Gas1 is correctly localized in all GFP-tagged SND proteins, indicating that the tag does not disrupt their function and endogenous localization.
(f) An ortholog of Snd2 is present in canine microsomes
A mammalian ortholog of Snd2 (hSnd2) is present in canine pancreatic rough microsomes, which are routinely used as a source of mammalian ER proteins, as seen by immunoblotting with an antibody against hSnd2 which was shown to be specific in siRNA mediated gene silencing experiments.
(g) Endogenous hSnd2 is localized to the human rough ER
HEK293 cells were homogenized and subfractionated into various pellet (P) and supernatant (S) fractions. Fractions were analyzed by SDS-PAGE and immunoblotting. hSnd2 co-fractionated with the rough ER markers, Grp170 and Sec62, and the ribosomal protein uS3 but not with the nuclear and cytosolic proteins p68 and GAPDH. The areas of interest of luminescence images from a single western blot are shown.
For gel source data see Supplementary Figure 1.
Extended Data Figure 2.
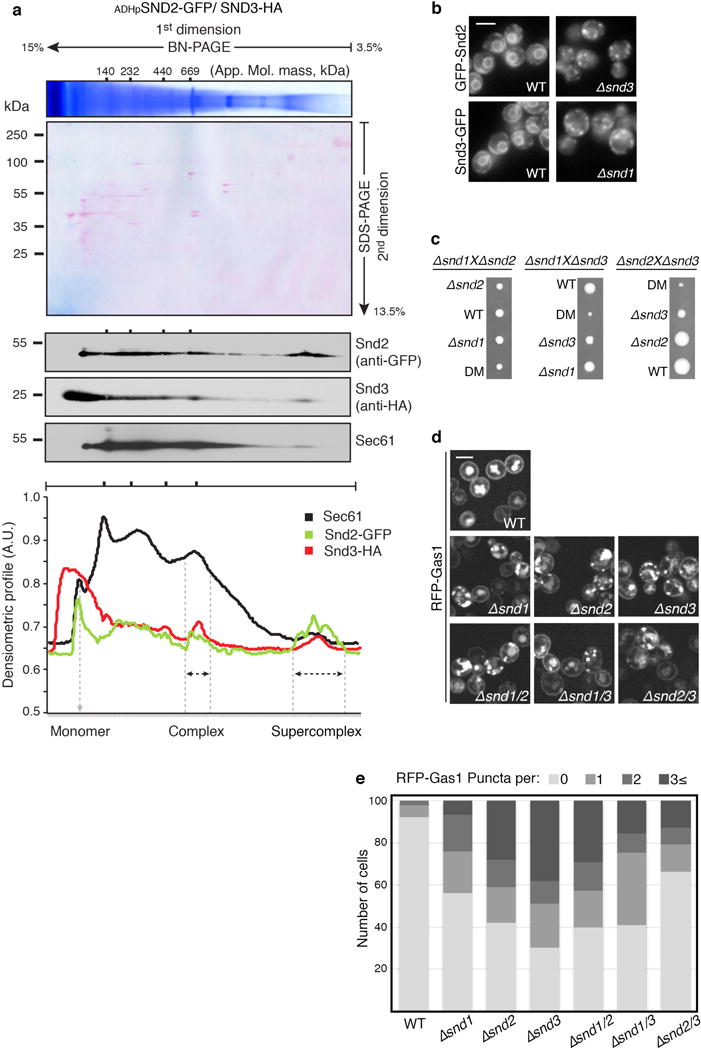
(a) Snd2 and Snd3 form a complex together with the Sec61 translocon
BN-PAGE followed by 2nd dimension SDS-PAGE. Densitometry quantification revealed that Sec61 migrates in four distinct complexes, as well as a monomer. Interestingly, we found both Snd2 and Snd3 to reside together in two of these complexes, one of an approximate molecular mass of ~669 kDa, and a second supercomplex of a higher molecular mass. We postulate that the two Sec61/SND complexes may differ in size depending on the presence of additional auxiliary components. For gel source data see Supplementary Figure 1.
(b) Loss of each SND protein affects the localization of the others
Fluorescent micrographs showing that Snd2 is mislocalized upon deletion of SND3 and Snd3 is mislocalized upon deletion of SND1, suggesting a functional dependence between the three proteins. Scale bars throughout figure, 5 μm.
(c) Growth rates reveal the genetic interactions between the SND genes
Heterozygous diploids of Δsnd were sporulated and tetrad-dissected to retrieve haploids. Tetrads obtained demonstrate an epistatic interaction between SND1 and SND2 mutants, and a synthetic sick interaction between SND3 and the SND1/2 mutants. As SND3 is more than an order of magnitude more abundant than SND1/2, it is possible that this interaction is due to an independent cellular function.
(d) RFP-Gas1 localization is comparable between SND single and double mutants
Fluorescent micrographs of RFP-Gas1 in SND single and double mutants show that they are epistatic to each other in terms of their effect on targeting.
(e) Quantification of RFP-Gas1 mis-localization in SND double mutants
Quantification of the RFP-Gas1 mislocalization phenotype in SND single and double mutants (Extended Data Fig. 2d) reveals a buffering epistatic interaction between SND genes (100 cells were counted per strain).
Extended Data Figure 3. Substrate affinity to a targeting pathway depends on the position of its transmembrane domain.
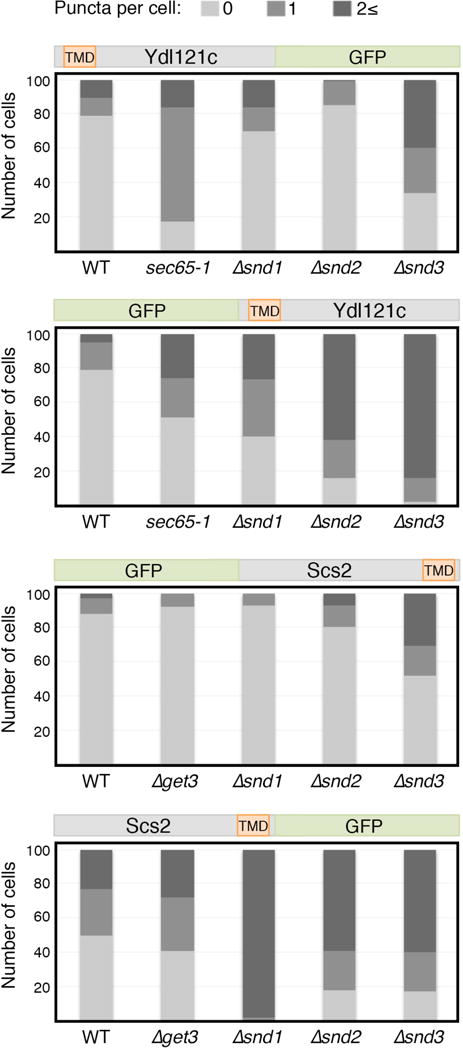
Quantification of the mislocalization phenotype in Fig. 2F and Fig. 2G confirms that re-positioning of a substrate’s TMD can alter its dependence on the different targeting pathways.
Extended Data Figure 4.
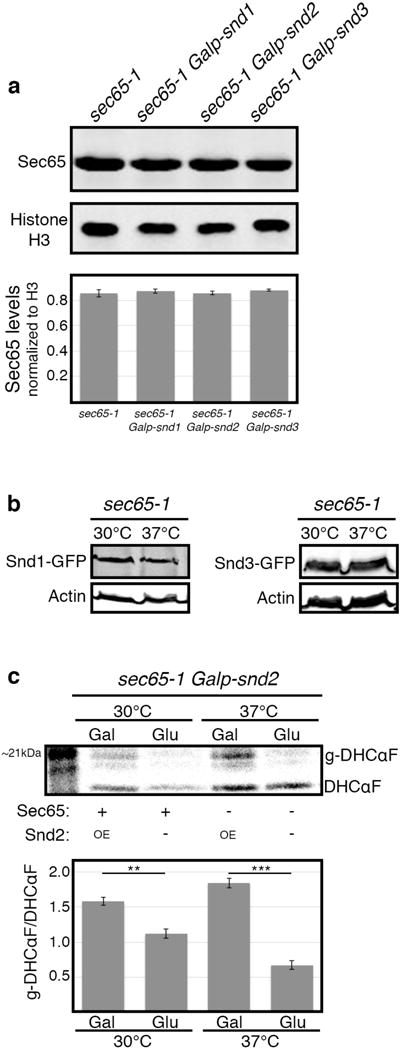
(a) Overexpression of SND genes does not affect SRP levels
SND genes were over-expressed by growth on galactose in 30°C, and levels of Sec65 protein were measured by western-blot and normalized to Histone H3 loading control. No apparent change in sec65-1 levels was detected, implying that the rescue observed in Fig. 3b–d is not due to increased SRP levels (data shown are means +/− s.e.m., n=3, biological replicates).
(b) Levels of SND proteins do not change in SRP-depleted cells
SND proteins were C-terminally tagged on the sec65-1 background, and their levels were measured by western-blot when grown in either permissive or restrictive temperatures (30°C and 37°C respectively), and normalized to Actin loading control. No apparent change in Snd1 or Snd3 levels was observed. Snd2 levels were below detection threshold (data not shown).
(c) SND2 overexpression increases the translocation of DHCαF
Pulse radioactive metabolic labeling followed by DHCαF immunoprecipitation was used to measure the translocation rate of the DHCαF. SND2 overexpression showed significantly higher translocation when compared to its repression by glucose, regardless to the functional state of sec65-1 (data shown are means +/− s.e.m. **p<0.01, ***p<0.001, by two-tailed Student’s t-test, n=3, biological replicates).
For all gel source data see Supplementary Figure 1.
Extended Data Figure 5.
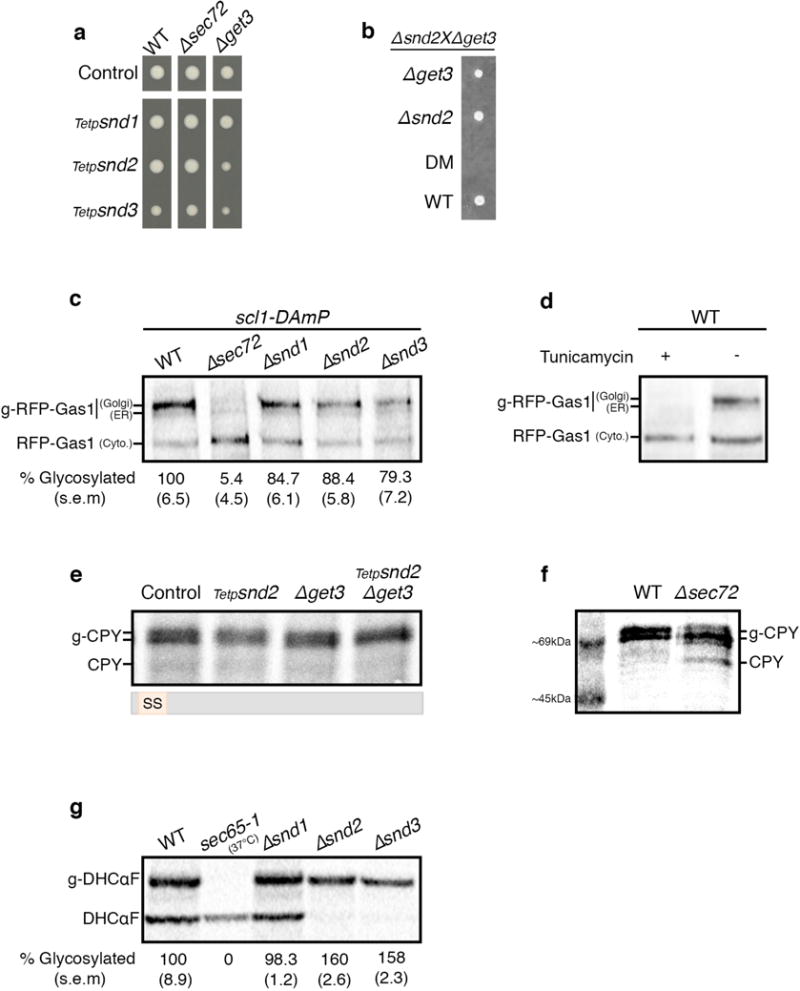
(a) Repression of SND genes is epistatic with SEC72 and synthetic sick with GET3
Growth rate of strains with the SND genes expressed under the regulation of a repressible Tet-promoter were measured when grown on Tetracycline. The growth rate of Δsec72 Tetp-SNDs conditional double mutants is identical to the control, indicating that they are epistatic to one another. The Δget3 Tetp-SNDs conditional double mutants are sick, yet viable.
(b) Double deletion of SND2 and GET3 is lethal
Heterozygous diploids of Δsnd2 and Δget3 were sporulated and tetrad-dissected to retrieve haploids. Tetrads obtained demonstrate a synthetic lethal interaction between SND2 and GET3.
(c) RFP-Gas1 translocation is moderately affected by SND single deletions
Pulse radioactive metabolic labeling followed by RFP-Gas1 immunoprecipitation was used to measure RFP-Gas1 translocation rates. Percentage of glycosylated ER and Golgi forms (indicated by 2 black lines) was reduced to 5% in Δsec72, while in Δsnd1, Δsnd2 and Δsnd3 it was reduced to 85%, 88% and 79% respectively (data shown are means (s.e.m.), n=3, biological replicates). All strains in this assay were attenuated for degradation with the scl1-DAmP proteasome hypomorphic allele.
(d) Verification of the glycosylated forms of RFP-Gas1
Pulse radioactive metabolic labeling followed by RFP-Gas1 immunoprecipitation was performed in the presence and absence of the glycosylation inhibitor Tunicamycin, allowing the identification of three forms of RFP-Gas1: Cytosolic, ER and Golgi (mature).
(e) CPY targeting is not affected by double mutants of the SND and GET pathways
Same methodology as in (c) was used to follow the SS-containing protein CPY in the conditional double mutant for SND2/GET3. A mild decrease in the glycosylated forms was observed in the SND2 single mutant, however there was no translocation defect in the GET3 single mutant or in the conditional double mutant. This result repeated in three independent biological repeats.
(f) MW of cytosolic CPY and translocated CPY (g-CPY)
CPY was metabolically labeled in a control strain and a partially translocated pool was visualized with a ladder to provide a size reference to (e).
(g) DHCαF translocation is not hampered by SND single deletions
Same methodology as in (c) was used to measure the translocation rate of the SRP-dependent substrate, DHCαF. In the temperature sensitive strain, sec65-1, in the restrictive temperature (37°C), there was no translocated substrate. Δsnd1’s translocation efficiency was comparable to the WT control. Δsnd2 and Δsnd3 translocation efficiency was significantly higher: ~160% glycosylated protein compared to the WT control (data shown are means (s.e.m.), n=3, biological repeats).
For all gel source data see Supplementary Figure 1.
Supplementary Material
Acknowledgments
We thank Schuldiner lab members for discussions and comments on the manuscript; Daniel Kaganovich, Tomer Ravid, Jeffrey Gerst, Stephen High and Howard Riezman for plasmids; Peter Walter and Mathias Seedorf for antibodies and Ido Yofe and Uri Weill for the N′ tagging plasmid and primers. Tslil Ast was supported by the Adams Fellowship Program of the Israel Academy of Sciences and Humanities. The work on human cells was supported by a DFG grant (IRTG 1830 and ZI 234/13-1) to Richard Zimmermann, generation of anti-hSnd2 antibodies was funded by HOMFOR (HOMFOR2015). Supercomplex analysis by Eric C. Arakel and Blanche Schwappach was funded by the Deutsche Forschungsgemeinschaft (SFB 1190 P04). Jonathan Weissman is supported by the NIH/NGMS (Center for RNA Systems Biology P50 GM102706 (Cate)), Elizabeth A. Costa is supported by the National Science Foundation under Grant No. 1144247. This work was funded by the Minerva foundation and the Israel Science Foundation support to Maya Schuldiner.
Footnotes
Supplementary Information is available in the online version of the paper.
Author contribution N.A., T.A. and M.S conceptualized the study; S.G.C., E.A.C and C.H.J performed computational analysis; E.A.C. performed the ribosome-profiling experiments, E.C.A. performed the blue-native page experiments, S.H., J.D., M.J., and S.S. performed the mammalian experiments, N.A. and T.A. performed all other experiments; T.A., B.S., R.Z., J.S.W. and M.S. supervised the study; N.A and M.S wrote the manuscript. All authors discussed the results and commented on the manuscript.
Ribosome-profiling data are deposited in Gene Expression Omnibus (GEO) under accession number GSE85686. The authors declare no competing financial interests.
References
- 1.Rapoport Ta. Protein translocation across the eukaryotic endoplasmic reticulum and bacterial plasma membranes. Nature. 2007;450:663–9. doi: 10.1038/nature06384. [DOI] [PubMed] [Google Scholar]
- 2.Walter P, Johnson AE. Signal sequence recognition and protein targeting to the endoplasmic reticulum membrane. Annu Rev Cell Biol. 1994;10:87–119. doi: 10.1146/annurev.cb.10.110194.000511. [DOI] [PubMed] [Google Scholar]
- 3.Favaloro V, Spasic M, Schwappach B, Dobberstein B. Distinct targeting pathways for the membrane insertion of tail-anchored (TA) proteins. J Cell Sci. 2008;121:1832–40. doi: 10.1242/jcs.020321. [DOI] [PMC free article] [PubMed] [Google Scholar]
- 4.Stefanovic S, Hegde RS. Identification of a targeting factor for posttranslational membrane protein insertion into the ER. Cell. 2007;128:1147–59. doi: 10.1016/j.cell.2007.01.036. [DOI] [PubMed] [Google Scholar]
- 5.Jonikas MC, et al. Comprehensive characterization of genes required for protein folding in the endoplasmic reticulum. Science. 2009;323:1693–7. doi: 10.1126/science.1167983. [DOI] [PMC free article] [PubMed] [Google Scholar]
- 6.Schuldiner M, et al. The GET complex mediates insertion of tail-anchored proteins into the ER membrane. Cell. 2008;134:634–45. doi: 10.1016/j.cell.2008.06.025. [DOI] [PMC free article] [PubMed] [Google Scholar]
- 7.Aviram N, Schuldiner M. Embracing the void-how much do we really know about targeting and translocation to the endoplasmic reticulum? Curr Opin Cell Biol. 2014;29:8–17. doi: 10.1016/j.ceb.2014.02.004. [DOI] [PubMed] [Google Scholar]
- 8.Ast T, Schuldiner M. All roads lead to Rome (but some may be harder to travel): SRP-independent translocation into the endoplasmic reticulum. Crit Rev Biochem Mol Biol. 2013;48:273–88. doi: 10.3109/10409238.2013.782999. [DOI] [PubMed] [Google Scholar]
- 9.Ast T, Cohen G, Schuldiner M. A network of cytosolic factors targets SRP-independent proteins to the endoplasmic reticulum. Cell. 2013;152:1134–45. doi: 10.1016/j.cell.2013.02.003. [DOI] [PubMed] [Google Scholar]
- 10.Ng DT, Brown JD, Walter P. Signal sequences specify the targeting route to the endoplasmic reticulum membrane. J Cell Biol. 1996;134:269–78. doi: 10.1083/jcb.134.2.269. [DOI] [PMC free article] [PubMed] [Google Scholar]
- 11.Cohen Y, Schuldiner M. Advanced methods for high-throughput microscopy screening of genetically modified yeast libraries. Methods Mol Biol. 2011;781:127–59. doi: 10.1007/978-1-61779-276-2_8. [DOI] [PubMed] [Google Scholar]
- 12.Tong AHY, Boone C. Synthetic genetic array analysis in Saccharomyces cerevisiae. Methods Mol Biol. 2006;313:171–92. doi: 10.1385/1-59259-958-3:171. [DOI] [PubMed] [Google Scholar]
- 13.Giaever G, et al. Functional profiling of the Saccharomyces cerevisiae genome. Nature. 2002;418:387–91. doi: 10.1038/nature00935. [DOI] [PubMed] [Google Scholar]
- 14.Breslow DK, et al. A comprehensive strategy enabling high-resolution functional analysis of the yeast genome. Nat Methods. 2008;5:711–8. doi: 10.1038/nmeth.1234. [DOI] [PMC free article] [PubMed] [Google Scholar]
- 15.Breker M, Gymrek M, Schuldiner M. A novel single-cell screening platform reveals proteome plasticity during yeast stress responses. J Cell Biol. 2013;200:839–50. doi: 10.1083/jcb.201301120. [DOI] [PMC free article] [PubMed] [Google Scholar]
- 16.Mandon EC, Trueman SF, Gilmore R. Protein translocation across the rough endoplasmic reticulum. Cold Spring Harb Perspect Biol. 2013;5:1–14. doi: 10.1101/cshperspect.a013342. [DOI] [PMC free article] [PubMed] [Google Scholar]
- 17.Harada Y, Li H, Wall JS, Li H, Lennarz WJ. Structural studies and the assembly of the heptameric post-translational translocon complex. J Biol Chem. 2011;286:2956–65. doi: 10.1074/jbc.M110.159517. [DOI] [PMC free article] [PubMed] [Google Scholar]
- 18.Kaganovich D, Kopito R, Frydman J. Misfolded proteins partition between two distinct quality control compartments. Nature. 2008;454:1088–95. doi: 10.1038/nature07195. [DOI] [PMC free article] [PubMed] [Google Scholar]
- 19.Huh WK, et al. Global analysis of protein localization in budding yeast. Nature. 2003;425:686–91. doi: 10.1038/nature02026. [DOI] [PubMed] [Google Scholar]
- 20.Fleischer TC, Weaver CM, McAfee KJ, Jennings JL, Link AJ. Systematic identification and functional screens of uncharacterized proteins associated with eukaryotic ribosomal complexes. Genes Dev. 2006;20:1294–307. doi: 10.1101/gad.1422006. [DOI] [PMC free article] [PubMed] [Google Scholar]
- 21.Ricarte F, et al. A genome-wide immunodetection screen in S. cerevisiae uncovers novel genes involved in lysosomal vacuole function and morphology. PLoS One. 2011;6:e23696. doi: 10.1371/journal.pone.0023696. [DOI] [PMC free article] [PubMed] [Google Scholar]
- 22.Zhao Y, et al. Transmembrane protein 208: a novel ER-localized protein that regulates autophagy and ER stress. PLoS One. 2013;8:e64228. doi: 10.1371/journal.pone.0064228. [DOI] [PMC free article] [PubMed] [Google Scholar]
- 23.Yompakdee C, Ogawa N, Harashima S, Oshima Y. A putative membrane protein, Pho88p, involved in inorganic phosphate transport in Saccharomyces cerevisiae. Mol Gen Genet. 1996;251:580–90. doi: 10.1007/BF02173648. [DOI] [PubMed] [Google Scholar]
- 24.Kulak NA, Pichler G, Paron I, Nagaraj N, Mann M. Minimal, encapsulated proteomic-sample processing applied to copy-number estimation in eukaryotic cells. Nat Methods. 2014;11:319–24. doi: 10.1038/nmeth.2834. [DOI] [PubMed] [Google Scholar]
- 25.Jan CH, Williams CC, Weissman JS. Principles of ER cotranslational translocation revealed by proximity-specific ribosome profiling. Science (80-) 2014 doi: 10.1126/science.1257521. [DOI] [PMC free article] [PubMed] [Google Scholar]
- 26.Noriega TR, et al. Signal recognition particle-ribosome binding is sensitive to nascent chain length. J Biol Chem. 2014;289:19294–19305. doi: 10.1074/jbc.M114.563239. [DOI] [PMC free article] [PubMed] [Google Scholar]
- 27.Pan X, et al. A DNA integrity network in the yeast Saccharomyces cerevisiae. Cell. 2006;124:1069–81. doi: 10.1016/j.cell.2005.12.036. [DOI] [PubMed] [Google Scholar]
- 28.Brachmann CB, et al. Designer deletion strains derived from Saccharomyces cerevisiae S288C: a useful set of strains and plasmids for PCR-mediated gene disruption and other applications. Yeast. 1998;14:115–32. doi: 10.1002/(SICI)1097-0061(19980130)14:2<115::AID-YEA204>3.0.CO;2-2. [DOI] [PubMed] [Google Scholar]
- 29.Gietz RD, Woods Ra. Transformation of yeast by lithium acetate/single-stranded carrier DNA/polyethylene glycol method. Methods Enzymol. 2002;350:87–96. doi: 10.1016/s0076-6879(02)50957-5. [DOI] [PubMed] [Google Scholar]
- 30.Yofe I, Schuldiner M. Primers-4-Yeast: a comprehensive web tool for planning primers for Saccharomyces cerevisiae. Yeast. 2014;31:77–80. doi: 10.1002/yea.2998. [DOI] [PubMed] [Google Scholar]
- 31.Longtine MS, et al. Additional modules for versatile and economical PCR-based gene deletion and modification in Saccharomyces cerevisiae. Yeast. 1998;14:953–61. doi: 10.1002/(SICI)1097-0061(199807)14:10<953::AID-YEA293>3.0.CO;2-U. [DOI] [PubMed] [Google Scholar]
- 32.Kitada K. Cloning of the Candida glabrata TRP1 and HIS3 genes, and construction of their disruptant strains by sequential integrative transformation. Gene. 1995;165:203–206. doi: 10.1016/0378-1119(95)00552-h. [DOI] [PubMed] [Google Scholar]
- 33.Goldstein AL, McCusker JH. Three new dominant drug resistance cassettes for gene disruption in Saccharomyces cerevisiae. Yeast. 1999;15:1541–1553. doi: 10.1002/(SICI)1097-0061(199910)15:14<1541::AID-YEA476>3.0.CO;2-K. [DOI] [PubMed] [Google Scholar]
- 34.Stirling CJ, Hewitt EW. The S. cerevisiae SEC65 gene encodes a component of yeast signal recognition particle with homology to human SRP19. Nature. 1992;356:534–7. doi: 10.1038/356534a0. [DOI] [PubMed] [Google Scholar]
- 35.Kushnirov VV. Rapid and reliable protein extraction from yeast. Yeast. 2000;16:857–60. doi: 10.1002/1097-0061(20000630)16:9<857::AID-YEA561>3.0.CO;2-B. [DOI] [PubMed] [Google Scholar]
- 36.Graham TR. Metabolic labeling and immunoprecipitation of yeast proteins. Curr Protoc Cell Biol. 2001 doi: 10.1002/0471143030.cb0706s06. Chapter 7, Unit 7.6. [DOI] [PubMed] [Google Scholar]
- 37.Wuestehube LJ, Schekman RW. Reconstitution of transport from endoplasmic reticulum to Golgi complex using endoplasmic reticulum-enriched membrane fraction from yeast. Methods Enzym. 1992;219:124–136. doi: 10.1016/0076-6879(92)19015-x. [DOI] [PubMed] [Google Scholar]
- 38.Schwenk J, et al. Functional Proteomics Identify Cornichon Proteins as Auxiliary Subunits of AMPA Receptors. Science (80-) 2009;323:1313–1319. doi: 10.1126/science.1167852. [DOI] [PubMed] [Google Scholar]
- 39.Wittig I, Braun HP, Schägger H. Blue native PAGE. Nat Protoc. 2006;1:418–428. doi: 10.1038/nprot.2006.62. [DOI] [PubMed] [Google Scholar]
- 40.Pfeffer S, et al. Structure of the mammalian oligosaccharyl-transferase complex in the native ER protein translocon. Nat Commun. 2014;5:3072. doi: 10.1038/ncomms4072. [DOI] [PubMed] [Google Scholar]
Associated Data
This section collects any data citations, data availability statements, or supplementary materials included in this article.
Supplementary Materials
Data Availability Statement
The data that support the findings of this study are available from the authors on reasonable request.


