Abstract
Antimicrobial resistance genes (ARGs) present in the environment pose a risk to human health due to potential for transfer to human pathogens. Surveillance is an integral part of mitigating environmental dissemination. Quantification of the mobile genetic element class 1 integron-integrase gene (intI1) has been proposed as a surrogate to measuring multiple ARGs. Measurement of such indicator genes can be further simplified by adopting emerging nucleic acids methods such as loop mediated isothermal amplification (LAMP). In this study, LAMP assays were designed and tested for estimating relative abundance of the intI1 gene, which included design of a universal bacteria 16S rRNA gene assay. Following validation of sensitivity and specificity with known bacterial strains, the assays were tested using DNA extracted from river and lake samples. Results showed a significant Pearson correlation (R2 = 0.8) between the intI1 gene LAMP assay and ARG relative abundance (measured via qPCR). To demonstrate the ruggedness of the LAMP assays, experiments were also run in the hands of relatively “untrained” personnel by volunteer undergraduate students at a local community college using a hand-held real-time DNA analysis device - Gene-Z. Overall, results support use of the intI1 gene as an indicator of ARGs and the LAMP assays exhibit the opportunity for volunteers to monitor environmental samples for anthropogenic pollution outside of a specialized laboratory.
Keywords: loop mediated isothermal amplification (LAMP), intI1 gene, antibiotic resistance gene surveillance, research translation, environmental water and sediment samples
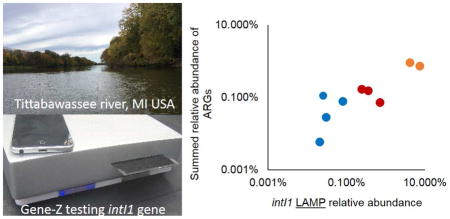
Graphical Abstract
Introduction
Environmental hotspots for antimicrobial resistant bacteria (ARBs) and antimicrobial resistance genes (ARGs) are a threat to human health because of the potential for enrichment and transfer of antimicrobial resistance. Characterization and identification of anthropogenic influence on dissemination of ARBs in the environment is critical for control and mitigation. Although, direct measurements of abundance of all ARBs and ARGs is more precise, there is also a growing interest in the use of bioindicators as a surrogate or proxy for anthropogenic pollution (Paoletti, 1999; Rockström et al., 2009). One such bioindicator gene, the class 1 integrase (intI1) (Gillings et al., 2015) has been shown to be present in many anthropogenic samples including human stool (Phongpaichit et al., 2008), wastewater treatment plants (WWTPs, Ma et al., 2013) and surrounding airborne aerosol emissions (Li et al., 2016), river sediment near WWTP effluent discharge lines (Karkman et al., 2016), ponds (M. Wang et al., 2016), landfill sites (Sun et al., 2016), untreated hospital effluents (Spindler et al., 2012), many animal hosts (Colello et al., 2015; Lluque et al., 2015), and in sediment and soils polluted or treated with metals (Oliveira-Pinto et al., 2016) and antibiotics (Cleary et al., 2016). The intI1 gene or a similar maker could eventually play a role in regulatory environmental monitoring of ARGs (Berendonk et al., 2015).
Measurement of the intI1 gene or any other nucleic-acid based marker of environmental interest is typically carried out by polymerase chain reaction (PCR) and gel electrophorese or quantitative PCR (qPCR) using conventional real-time thermocyclers. However, more rapid and simplified measurement techniques may increase broader monitoring/surveillance of intI1 as a marker of ARG abundance or anthropogenic activity. Isothermal amplification, such as loop mediated isothermal amplification (LAMP) with Bst polymerase provides a more simplistic approach because it allows amplification with minimal sample processing requirements (Williams et al., 2017) and is less influenced by PCR inhibition (Koloren et al., 2011; Stedtfeld et al., 2016a). Furthermore, constant temperature (Notomi et al., 2000) and high amplicon yields (Mori et al., 2001), allows quantification of abundance with relatively simpler devices (e.g. turbidity meters, Illumigene, NucleSENSE easyQ) and is therefore well suited for use outside of laboratories with specialized infrastructures (Njiru, 2012).
For quantification, normalization of target markers to total bacterial DNA or total 16S rRNA gene is routinely implemented to calculate relative abundance and allow comparative evaluation among multiple environmental samples. For intI1 gene abundance, this is typically measured by qPCR for which universal bacterial primers have been in use for decades (Gaze et al., 2011). However, there is no universal bacterial 16S rRNA gene primer set currently available for LAMP. The lag in developing such universal primers may be due to constraints of the LAMP assay which requires primers from six to eight separate regions to be conserved for maximum coverage of 16S rRNA genes sequences (Notomi et al., 2000). Thus, a LAMP assay for intI1 gene abundance will also require a universal LAMP primer for bacterial 16S rRNA genes.
In this study, LAMP assays for the intI1 and universal 16S rRNA genes were designed as markers for quantifying ARG abundance. Following design of primers, sensitivity and specificity was tested with DNA from bacterial reference strains (mostly species type strains) and DNA extracted from river sediment and lake water samples. The relative abundance of the intI1 gene LAMP assay was also compared with qPCR intI1 gene measurements and total ARG relative abundance using Wafergen’s SmartChip qPCR array with 384 primer sets targeting ARGs (Wang et al., 2016). The array was used for comparison since both the Wafergen SmartChip and ARG primer sets have been validated and used in multiple studies (Muziasari et al., 2016; Wang et al., 2017; Xie et al., 2016; Zhu et al., 2017), along with the qPCR primers targeting the intI1 gene (Barraud et al., 2010; Gillings et al., 2015; Power et al., 2013; F. Wang et al., 2016). Assays were also evaluated by undergraduate student volunteers using the Gene-Z device (Stedtfeld et al., 2012) and self-dispensing microfluidic cards (Stedtfeld et al., 2015) in the classroom of a local community college. While demonstrated using the Gene-Z and a conventional cycler (under isothermal conditions), the intl1 gene LAMP assay could be used with other real-time isothermal devices to monitor environmental samples for anthropogenic pollution outside of a specialized laboratory.
Materials and Methods
LAMP primer design
LAMP primers (Table S1) were designed to target the intI1 gene and to universally target the 16S rRNA gene bacterial sequences available in the Ribosomal Database project RDP (Cole et al., 2014). For the intI1 gene, a total of 3,994 sequences were selected from the FunGene Pipeline Repository (Fish et al., 2013) using a size cutoff of 320 aa, HMM coverage cutoff of 80% and a minimum score of 500. A consensus sequence was generated from all intI1 gene alleles using Bioedit Sequence Alignment Editor (Ibis Biosciences, Carlsbad, CA). The consensus sequence was used for primer design using Primer Explorer V4 (https://primerexplorer.jp/e/). For the 16S rRNA gene, primer sequences were selected by manually analyzing conserved regions and following LAMP primer design strategies (https://primerexplorer.jp/e/v4_manual/pdf/PrimerExplorerV4_Manual_1.pdf). Theoretical specificity of primers was verified using Probe Match with the FunGene Pipeline Repository and RDP for the intI1 gene and 16S rRNA gene, respectively. Synthesized primers were obtained from Integrated DNA Technologies (IDT, Coralville, IA).
Bacterial strains and water samples
Bacterial strains used to validate assays were obtained from ATCC or DSMZ (Table S1). River sediment samples were collected during summer and early fall of 2016 from the Tittabawassee and Saginaw Rivers (TS), and Red Cedar Rivers (RC) in Michigan. Digital pictures were captured at each sampling site with iPhones, which were also used to gather GPS coordinates of locations (Fig S1). One water sample from the So-ok river and one water sample from the Daecheong lake, that had previously been collected from the Geum River system near Daejeon, Republic of Korea (K) were also used to test the intI1 gene LAMP assay. These samples were included in the analysis for comparison because they were located downstream of livestock farms and had been previously shown to have a higher load of ARGs. Four liters of river and lake water were filtered through Advantec® nitrocellulose membrane filters (muliple filters were required per sample); and DNA was extracted from 0.1g of wet-weight filters using MP bio soil DNA extraction Kit after grinding with liquid nitrogen. TS and RC river samples were collected by volunteer undergraduate students from a local community college. Sediment samples were collected from river banks, using 0 to 3 cm columns. Samples were placed into Ziploc bags, homogenized, stored on ice, and frozen within 8 hours. Genomic DNA was extracted from bacterial cultures and from 0.2 g wet weight sediment, using the Powersoil kit (MO BIO, Carsbad, CA, USA). The DNA quality and concentration from samples and bacterial strains were measured with a Qubit Fluorimeter (Life Technology, Eugene, OR, USA).
Validation of LAMP assays
DNA that was extracted from pure cultures and water samples were used to validate the LAMP assays. Amplification experiments were carried out under isothermal conditions in conventional vials in a real-time cycler (Eppendorf realplex2) or in the Gene-Z device (Stedtfeld et al., 2012) with disposable chips. LAMP reactions consisted of 1X isothermal amplification buffer II (New England Biolabs), 1.4 mM each dNTP (Invitrogen), 0.8 M Betaine solution (Sigma Aldrich), 6 mM MgSO4 (New England Biolabs), 4 U Bst Polymerase 3.0 (New England Biolabs), 200 μM SYTO82 Orange Fluorescent Nucleic Acid Stain (ThermoFisher Scientific), template solution that constitutes 10% of the reaction volume, and PCR grade water. LAMP reaction testing environmental samples was diluted to yield 5 ng of extracted DNA per LAMP reaction. All experiments were performed with an isothermal incubation at 65 °C for 60 min with plate reads at one minute intervals in the real-time cycler, and every 16 s in the Gene-Z device. LAMP in the real-time cycler and Gene-Z device had 10 μl and 25 μl reaction volumes, respectively. All experiments with bacteria cultures and environmental samples were done in triplicate and included a no template control and a positive control. Validation assays with bacterial strain and initial testing with environmental samples were carried out by trained and experienced technicians using a conventional thermocycler (under isothermal conditions).
Wafergen’s SmartChip
For 12 of the environmental samples, a Wafergen SmartChip real-time qPCR system (Fremont, CA, USA) was used to compare relative abundance of ARGs with the intI1 gene LAMP assay. Briefly, the array simultaneously tests 5,184 SYBR based (100 nl) qPCR reactions in parallel. ARG primers used on the SmartChip included: 35 primers targeting mobile genetic elements (MGEs, 4 different primers for the intI1 gene (Barraud et al., 2010; Gillings et al., 2015; Power et al., 2013; F. Wang et al., 2016), 2 primers targeting the universal bacteria 16S rRNA gene (Lane, 1991; Mayer-blackwell et al., 2014) for normalization, 4 primers specific to E. coli functional genes, multiple drug resistance genes (n = 60 primers), amphenicol resistance (n = 4 primers), beta-lactam resistance (n = 66 primers), non-classifiable resistance (n = 16 primers), macrolide-lincosamide-streptogramin B resistance (n = 53 primers), tetracycline resistance (n = 47 primers), aminoglycoside resistance (n=35 primers), vancomycin resistance g (n = 36 primers), and sulfonamide resistance (n = 9) as previously described (F. Wang et al., 2016; Wang et al., 2014). Sample and primer mixtures were distributed into the Wafergen SmartChip using a robotic Nanodispenser (Fremont, CA, USA). PCR cycling conditions and reaction constituents were performed as previously described (F. Wang et al., 2016). The concentration of template DNA from water samples on the Wafergen chip was 0.25 ng per 100 nl reaction well.
The sensitivity and specificity of the low volume qPCR and the primer design strategies has been described previously (Stedtfeld et al., 2008). Validation of ARG primer specificity has included testing dilutions of gDNA from type strains, resulting in 99.1% correct call rates (Zhu et al., 2013), and sequencing amplicons from 35 primer sets that commonly show positive amplification on the array (Johnson et al., 2016).
Testing intI1 gene LAMP assay with Gene-Z
Using the Gene-Z device, DNA extracted from eight of the river sediment samples collected in Michigan (four from the RC and four from the TS Rivers) were tested by volunteer first-year undergraduate students in the classroom of a local community college (Delta College). Students were given approximately three hours of instruction which included detailed demonstration of mechanics of the LAMP reaction, training to load sample into disposable microfluidic chips, and operation of the Gene-Z device. After training, undergraduate students mixed LAMP reaction constituents as described above, loaded chips, started the Gene-Z device, and observed real-time amplification profiles being plotted on the iPod.
Gene-Z chips were fabricated as previously described (Stedtfeld et al., 2016a) and loaded with primers by trained staff at MSU. Fabrication of Gene-Z chips included cutting channels and wells into 1.59 mm thick black acrylic sheets (24112-07, Inventables) with a CO2 laser, cleaning as previously described, and enclosing one side using clear optical film (MicroAmp, Applied Biosystems). Next, primers were dehydrated in the Gene-Z chip, enclosed with PCR tape, and stored at −20 °C until use. LAMP assays dehydrated on the Gene-Z chip included the intI1 gene primer, universal bacteria 16S rRNA gene primer, and a positive control assay targeting the luciferase gene (Hatt et al., 2013; Stedtfeld et al., 2016a). Chips were designed so that four samples could be loaded per chip.
Data Analysis
For data collected on the Wafergen, a threshold cycle of 29 was used as a cutoff to differentiate between true positive amplification and primer-dimers. Genes detected in only one of the three technical replicates in each sample were considered false positives and were not analyzed further. Primers that amplified with no template controls or had multiple melt peaks were excluded from analysis. Multiple melt peaks were excluded as they indicate amplicons of varying sizes were produced, and primers are not specific. Estimated quantities were calculated as the relative abundance to universal 16S rRNA gene. Gene copy numbers were estimated using the equation 10(29 – Ct)/(10/3), where Ct equals the threshold cycle as described previously (Looft et al., 2012). Considered to be common in tested samples, ARGs that amplified in 11 or more of the 12 samples tested on the Wafergen (vanC, merA, mpha, oprJ, mexF, blaFox genes) were excluded from analysis as previously described (F. Wang et al., 2016). The average relative abundance of four intI1 gene qPCR primers (Table S1) was used for correlation analysis.
Raw data obtained on the Gene-Z device was streamed via Bluetooth to a custom iPod Touch application. The application sorts, plots, and emails raw data. Data was processed further using excel as previously described to generate threshold time (Tt) akin to threshold cycle with qPCR (Stedtfeld et al., 2016a). Gene quantities from the intI1 gene and universal 16S rRNA gene LAMP assays were estimated based on standard curves and normalized to 16S rRNA gene copy number to generate relative abundance (Stalder et al., 2012). The following formula was used to calculate relative abundance with qPCR and LAMP assays: [(intI1 gene copies/16S rRNA gene copies)×2.5×100], where 2.5 represents the average copies of the 16S rRNA gene per bacterial cell. Correlation plots were made using Excel, the circos figure was made using circos online (Krzywinski et al., 2009), and the heat-map was generated using MEV (www.tm4.org/mev.html). The figure showing taxonomic distribution of bacterial targets of the intI1 gene LAMP assay was rendered using Cytoscape v. 3.3.0 (Institute for Systems Biology, Seattle, USA). Log2 transformed values of relative ARG abundances was used for Redundancy Analysis (RDA), which is a multivariate analysis tool for ecological studies (Oksanen et al. 2014).
Results
Assay design
Normalization between samples is crucial to the use of genetic biomarkers for environmental monitoring. For qPCR-based measurement of the intI1 gene, assays that are designed to be universal for bacteria have been used for normalization (Gaze et al., 2011). Often, these primers are designed to target conserved segments of the 16S rRNA gene. However, no such universal bacterial assays have been described for LAMP. Hence, development of universal primers for the 16S rRNA gene along with the intI1 gene was included as part of this study.
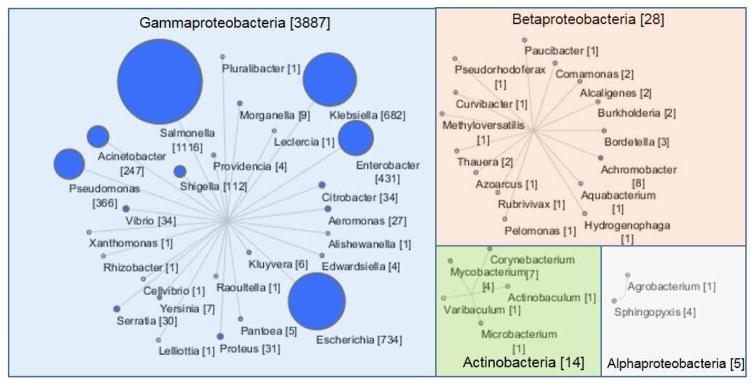
The intI1 gene is a 1,011 bp sequence with low allelic variability. Approximately 4,000 full length sequences, collected using thethe FunGene Pipeline Repository (Fig 1) were used to design the LAMP assay. The highly conserved nature of the intI1 gene permitted design of primers targeting over 99% of full length sequences selected from FunGene. As reviewed by Gillings and coauthors, a high level of conservation is thought to be a results of recent transfer of the intI1 gene among bacterial cells (Gillings et al., 2015). Also previously described, a higher level of sequence variability has been observed in intI1 alleles from environmental isolates. However, there are currently a smaller number of sequences from environmental isolates in public databases compared to clinical isolates.
Fig. 1.
Taxonomic distribution of full length intI1 gene sequences. Nodes indicate genera and transparent boxes encompassing nodes indicates class. Edge length has no meaning. Only Actinobacteria is outside of the Proteobacteria phylum. Target node size and text within parenthesis indicate number of target sequences within each group.
The selected universal LAMP 16S rRNA gene assay was designed between the V6 and V7 regions of the 16S rRNA gene (~base position 1050–1180) to target all available bacterial sequences in the RDP. Primers designed in other regions of high conservation (e.g. between V2 and V3 regions) were synthesized with degenerate bases (to find a stretch of multiple conserved segments within a 150–200 bp region), which slowed the time to positive amplification, or did not amplify, and were therefore not used further. The forward and back inner primers (FIP and BIP) are more critical for sensitivity and specificity of LAMP, and thus regions with the lowest level of allelic diversity were used to generate these primers. Primers were designed so that any potential mismatches with targets were not on the 3′ end of the B2 and F2 primers, and not on the 5′ end of the F1c and B1c primers, both of which encompass the FIP and BIP primer pair. Analyzed using the RDP Probe Match tool, the four sequences within the FIP and BIP target between 47 and 57% of bacterial sequences in the RDP, respectively (Table S1). Additional primers LF, LB, F3, and B3 were designed so that no potential mismatches were on the 3′ end. Some of the primers targeted a lower number of sequences (e.g. F3 only targets 571 sequences), however these primers serve to reduce reaction time and are therefore less critical for specificity.
Sensitivity and specificity
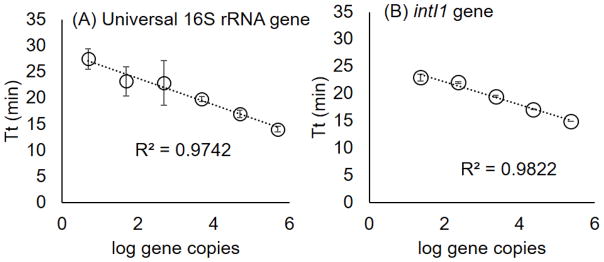
Validation included testing a dilution series of DNA extracted from targeted bacterial strains to determine sensitivity and quantitative capacity. All experiments with pure culture DNA were done in a conventional real-time thermal cycler using isothermal conditions. Using a dilution series of gDNA extracted from Acinetobacter baumanii ATCC BAA-1710, the intI1 assay amplified with 23 or more copies per reaction (Fig 2B). Lower dilutions tested did not amplify. A Pearson correlation of R2 = 0.98 was observed with the standard, based on threshold time (Tt), and all dilutions amplified within 25 minutes of starting the reaction. Specificity of intI1 gene LAMP assay was also tested with a strain that does not have the intI1 gene (Enterococcus faecalis ATCC 700802) as a no target control, for which amplification was not observed.
Fig. 2.
Standard curves of designed LAMP assays. (A) Universal bacteria with 16S rRNA gene tested with a dilution series of community DNA, and (B) intI1 gene tested with a dilution series of gDNA extracted from Acinetobacter baumanii (ATCC BAA-1710). Dots indicate average of three replicate reactions and error bars indicate standard error of mean.
A dilution series of community DNA was used to test sensitivity of the 16S rRNA gene primer. Amplification was observed with dilutions down to approximately five gene copies per reaction. The threshold time (Tt) for all dilutions occurred within 30 min and a Pearson correlation of R2 = 0.97 was observed (Fig 2A). While not extensive, specificity of the universal 16S rRNA gene primer was validated using 16 strains (mostly species type strains) from the phylum domains of Proteobacteria, Firmicutes, Thermodesulfobacteria, and Nitrospirae. These strains were selected to test amplification from bacteria from multiple taxonomic groups. Of the 16 targeted strains that were tested, 15 amplified with the universal bacteria 16S rRNA gene LAMP primer (Table S1).
Testing with environmental samples
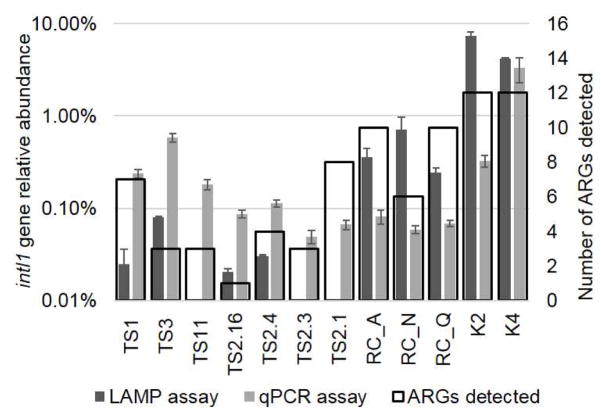
The LAMP assays were tested with community DNA extracted from environmental samples collected from three river systems (Fig 3). The intI1 gene LAMP assay relative abundance varied from 0.02 to 7.3% among the samples. The gene was not detected in three of the TS Rivers samples, which is in a more rural setting compared to the other two systems. In comparison, the average relative abundance measured using previously described intI1 gene qPCR primers varied from 0.02 to 9.7% within the measured samples.
Fig. 3.
The intI1 gene assays measured in 12 environmental samples. (A) Filled bars indicate average relative abundance measured using LAMP or qPCR assays, and error bars indicate standard error of mean. The secondary axis and open black bars indicate number of ARGs detected using the qPCR array. Sample abbreviations indicate samples from the Tittabawassee and Saginaw Rivers in Michigan (TS), the Red Cedar River in Michigan (RC), and water samples from the Geum River system in Republic of Korea (K).
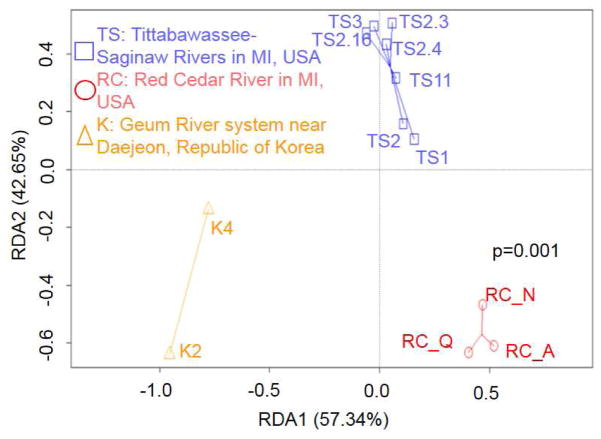
To compare the intI1 gene LAMP assay with ARGs, DNA from the 12 environmental samples were also analyzed using a previously described Wafergen SmartChip containing 384 primers (F. Wang et al., 2016). The number of detected genes correlated with the relative abundance of the intI1 gene measured using LAMP assays (R2 = 0.66). Based on relative abundance of detected ARGs, ordination revealed significant (P = 0.001) clusters among to the three river systems (Fig 4).
Fig. 4.
Ordination of ARGs with samples from the three rivers systems. Colors indicate samples from the Tittabawassee and Saginaw Rivers in Michigan (TS, blue), the Red Cedar River in Michigan (RC, red), and water samples from the Geum River system in Republic of Korea (K, orange).
The three samples that did not amplify with the intI1 gene LAMP assay included TS11, TS2.1, and TS2.3. One of the samples (TS11) is located in-between Midland and Saginaw, and the other two samples were within the same grouping near Saginaw (TS2.1, TS2.3). A majority of the samples collected from the TS Rivers had a lower level of intI1 gene compared to the RC and K samples. As such, the abundance of the intI1 gene in TS11, TS2.1, TS2.3 samples appears to fall below the detection limit of the LAMP assay. Within all TS samples, samples directly downstream of Midland (TS1, TS3) had a slightly higher level of ARGs.
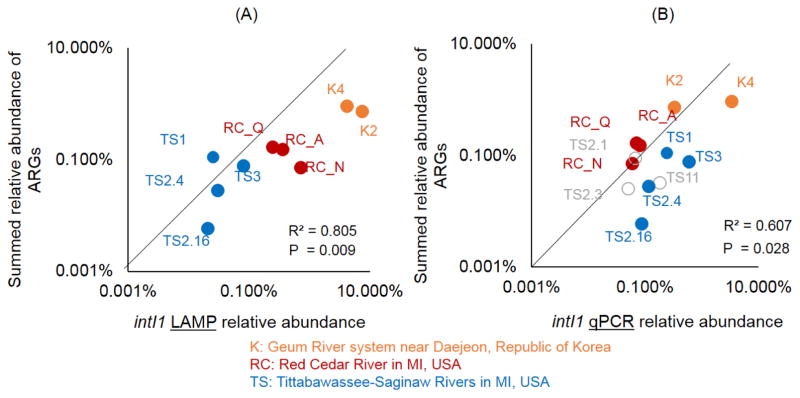
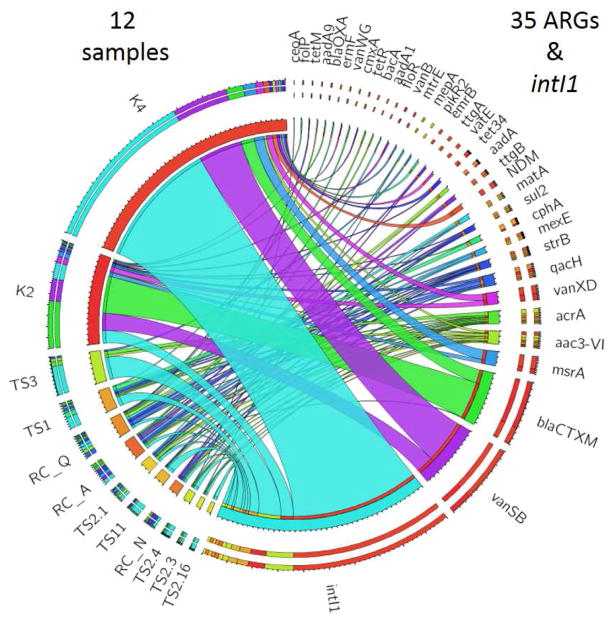
The intI1 gene LAMP assay had a significant Pearson correlation (R2 = 0.80) to the summed relative abundance of all other ARGs measured on the array (Fig 5A). The intI1 gene qPCR assay also had a significant Pearson correlation (R2 = 0.60) with the summed relative abundance of all other ARGs measured on the qPCR array (Fig 5B). With both qPCR and LAMP assays targeting the intI1 gene, relative abundance was highest in the samples collected from the Geum River system from the Republic of Korea (Fig 6). This was somewhat expected since these samples were collected downstream of livestock farms and are near a more populated city. The Geum River system samples also had the highest number of ARGs detected on the array (Fig 6).
Fig. 5.
Comparing intI1 gene LAMP and qPCR assays with total abundance of ARGs. (A) LAMP and (B) qPCR assay relative abundance versus total relative abundance of ARGs. The y-axis shows the sum relative abundance of 35 ARGs detected in one or more of 12 environmental samples tested on the ARG array. Sample abbreviations and colors indicate river sediment samples. The intI1 gene LAMP assay was not detected in three of the TS samples (marked in gray).
Fig. 6.
QPCR analysis of ARGs and intI1 gene in 12 environmental samples. Sample abbreviations indicate samples with DNA extracted from river sediment collected from Tittabawassee and Saginaw Rivers in Michigan (TS), the Red Cedar River in Michigan (RC), and water from the Geum River system in the Republic of Korea (K). Samples are listed on the left and detected ARGs are listed on the right of the circos. The size of the connecting lines between genes and samples indicate relative abundance.
Testing intI1 gene LAMP assay with Gene-Z
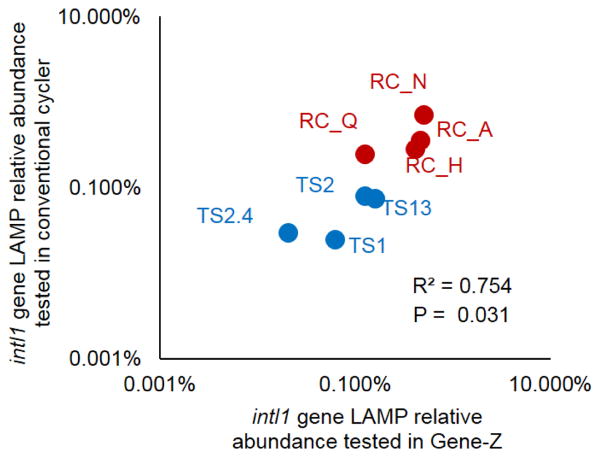
To demonstrate ruggedness and simplicity, the LAMP assays were tested by volunteer undergraduate students at a local community college using the Gene-Z device. Results obtained by volunteer undergraduate students correlated with results collected using the conventional thermocycler (under isothermal conditions) by trained personnel (Fig 7).
Fig. 7.
Results comparing intI1 gene measurement performed in central laboratory with a conventional cycler versus results obtained by volunteer students on Gene-Z device in the classroom of a local community college. Test were performed with DNA extracted from eight river sediment samples (four from RC and four from TS Rivers)
Discussion
Based on the assumption that population and proximity to agricultural facilities would influence levels of ARGs, environmental samples thought to have varying levels of intI1 gene abundance were collected from three different river systems. A lower abundance of ARGs and intI1 gene were observed in samples from the TS river system, which included samples collected downstream of Midland, MI population of 42k, in between Midland and Saginaw, and within Saginaw (Population 53k). RC samples, which had a moderate level of ARGs, are from a region with a higher population including downstream and within Meridian Township, Okemos, East Lansing, and Lansing area with a total estimated population of 263k. Samples collected from Korea, with the highest abundance of ARGs, were from a city with a population of 1.5M and samples were collected downstream of livestock facilities. The high abundance of beta-lactamase and vancomycin resistance genes observed in the Korean samples may be due to proximity to livestock facilities. Both the blaCTXM and vanSB genes were also observed in pig manure from two farms in China (Zhu et al., 2013). Overall, the level of ARGs detected in the samples used in this study are low compared to estuaries from more populated areas along the east coast of China, in which no less than 70 ARGs were detected per sample (Zhu et al., 2017).
Previous studies have also observed similar levels of intI1 gene in environmental samples, with relatively higher abundance encouraging selection as a potential biomarker (Gillings et al., 2015). For example, river and sediment samples varied in intI1 gene relative abundance from 0.005 to 0.49% (Koczura et al., 2016; Luo et al., 2010). The gene has been observed in up to 5% of cells in polluted soils, fresh waters, and biofilms (Gaze et al., 2005; Hardwick et al., 2008). Variations in intI1 abundance among various studies may be the result of assuming different number of 16S rRNA gene copies per genome (2.5 to 4 copies per genome), which in not discussed in some studies.
These results also agree with previous studies comparing the abundance of the intI1 gene with ARGs in environmental samples. For example, a study by Zhu and coauthors also recently observed a high correlation between the intI1 gene and overall ARG abundance, which was also tested using the ARG SmartChip array (Zhu et al., 2017). Another study quantified the intI1 gene abundance in different land use, with higher abundance observed in agricultural, industrial, and urban settings compared to national parks (Borruso et al., 2016). We previously observed a high correlation (R2 = 0.76) between total ARGs and intI1 gene measured using qPCR in water samples collected from 30 fresh surface water and influent lines from three waste water treatment plants (WWTPs) in Michigan (Stedtfeld et al., 2016b). Selective reduction of ARGs using anaerobic digestion also correlated with reduced counts of the intI1 gene (Burch et al., 2016). Determined via whole genome sequence analysis of 23,425 bacterial genomes (Hu et al., 2016), the sulfonamide resistance gene sul1, which is typically associated with intI1 (Luo et al., 2010), was observed with the greatest number of different ARGs types. As such, the high correlation between the intI1 gene LAMP assay and abundance of ARGs indicates its utility for monitoring ARGs in river samples.
Results from qPCR analyses in this study also suggest that the intI1 gene abundance was higher than other detected ARGs (Fig 6). This agrees with previous studies, suggesting that the abundance of this gene in environmental samples may be better suited to avoid detection limit constraints that may occur with other genetic biomarkers. Since the intI1 gene is typically only observed in Proteobacteria (Stokes and Gillings, 2011), which has a specific context of ARGs; other potential markers should be included (e.g., tetM for Firmicutes and tetQ for Bacteroidetes). However, all other ARGs detected on the array had lower abundance (e.g. tetM gene). While tests with additional well characterized samples will be necessary, these results support previously described use of the intI1 gene maker to obtain quick estimates of ARG abundance in environmental samples.
It should be noted that while the LAMP assays were validated to each-other, only a limited number of type strains were used to test specificity. Thus, universal coverage and specificity of the 16S rRNA gene LAMP assay against all bacteria has not been verified. The variable size of LAMP products and potential for amplicon contamination prevented verifying assay specificity via next generation sequencing. Nonetheless, observed correlation between the designed LAMP assays and the ARG qPCR array suggest utility for their designed purpose.
While the measurements in this study were done with DNA extracted from environmental samples, one key advantage of isothermal amplification is the potential for direct amplification with minimal DNA extraction and purification (Williams et al., 2017). Ultimately, genetic testing outside of a specialized laboratory should allow for sample-in-results-out with automation or minimal sample preparation even when quantitative abundance data is desired. LAMP and direct amplification have previously been demonstrated with many bacterial targets in clinical and environmental samples (Curtis et al., 2009; Francois et al., 2011; Kostic et al., 2015; Stedtfeld et al., 2015, 2014, 2016a). While river sediment itself cannot be dispensed into the microfluidic Gene-Z cards, an enumeration techniques (e.g. dislodging via surfactants) to collect bacteria from sediment samples (Epstein and Rossel, 1995) may be needed for accurate quantification with direct amplification.
For the Michigan samples, river sediment was selected as the matrix for testing the intI1 gene LAMP assay, as it is a potential hotspot for dissemination of ARGs and other pollutants, and has high correlation to the water column with respect to ARG concentration (Luo et al., 2010). Future studies are also planned with additional markers such as genes associated with biodegradation of contaminants (Chen et al., 2015), which are expected to persist in sediment samples. Future studies will also test the intI1 gene and universal 16S rRNA gene LAMP assays with minimal sample processing and explore if there are bacterial species containing intI1 gene that do not amplify.
Conclusion
Overall, results presented here demonstrate the utility of the intI1 gene and designed LAMP assay for estimating ARG abundance in environmental samples. Correlations between the results obtained using a conventional thermal-cycler in a molecular diagnostics laboratory and testing with the Gene-Z device by volunteer undergraduate students at a local community college, indicate that the designed isothermal assays are rugged and can potentially be used for routine surveillance of environmental samples outside of a specialized laboratory.
Supplementary Material
Fig S1. Map of samples collected in Michigan and Republic of Korea. Samples abbreviated with TS are from the Tittabawassee and Saginaw Rivers, and samples abbreviated RC are from the Red Cedar River. The Tittabawassee River turns into the Saginaw upstream from the town of Saginaw. River sediment samples TS1, TS3, TS11, TS13 are downstream of Midland, MI in a rural setting. Sample TS2.4 and TS2.16 are upstream from Saginaw, MI and TS2.1, 2.3 are within Saginaw, MI. Samples RC_A and RC_H are upstream of Lansing MI, and samples RC_N and RC_Q are in the city of Lansing, MI. Populations as of 2013 (US Census Bureau and UNdata) are listed for towns and cities near sampling sites.
Table S1. List of LAMP primers.
Highlights.
Isothermal amplification assay was designed for the class 1 integron (intI1) gene.
Novel assays were tested in 12 samples collected from three river systems.
Abundance of intI1 gene assay correlated with antibiotic resistance genes.
Robustness was verified by volunteer students at a local community college.
Acknowledgments
This work was supported by the National Institute of Environmental Health Sciences Superfund Basic Research Program (NIEHS SBRP P42ES04911) with contributions from Project 4, 5, Core B, and Research Translation Core.
Footnotes
Publisher's Disclaimer: This is a PDF file of an unedited manuscript that has been accepted for publication. As a service to our customers we are providing this early version of the manuscript. The manuscript will undergo copyediting, typesetting, and review of the resulting proof before it is published in its final citable form. Please note that during the production process errors may be discovered which could affect the content, and all legal disclaimers that apply to the journal pertain.
References
- Barraud O, Baclet M, Denis F, Ploy M. Quantitative multiplex real-time PCR for detecting class 1, 2 and 3 integrons. J Antimicrob Chemother. 2010;65:1642–5. doi: 10.1093/jac/dkq167. [DOI] [PubMed] [Google Scholar]
- Berendonk TU, Manaia CM, Merlin C, Fatta-Kassinos D, Cytryn E, Walsh F, Bürgmann H, Sørum H, Norström M, Pons MN, Kreuzinger N, Huovinen P, Stefani S, Schwartz T, Kisand V, Baquero F, Martinez JL. Tackling antibiotic resistance: the environmental framework. Nat Rev Microbiol. 2015;13:310–317. doi: 10.1038/nrmicro3439. [DOI] [PubMed] [Google Scholar]
- Borruso L, Harms K, Johnsen PJ, Nielsen KM, Brusetti L. Distribution of class 1 integrons in a highly impacted catchment. Sci Total Environ. 2016;566–567:1588–1594. doi: 10.1016/j.scitotenv.2016.06.054. [DOI] [PubMed] [Google Scholar]
- Burch TR, Sadowsky MJ, LaPara TM. Modeling the fate of antibiotic resistance genes and class 1 integrons during thermophilic anaerobic digestion of municipal wastewater solids. Appl Microbiol Biotechnol. 2016;100:1437–1444. doi: 10.1007/s00253-015-7043-x. [DOI] [PubMed] [Google Scholar]
- Chen HJ, Lai JY, Lee MS. Development of a loop-mediated isothermal amplification method for the rapid detection of the dioxin-degrading bacterium Ochrobactrum anthropi in soil. J Environ Manage. 2015;160:263–270. doi: 10.1016/j.jenvman.2015.06.027. [DOI] [PubMed] [Google Scholar]
- Cleary DW, Bishop AH, Zhang L, Topp E, Wellington EMH, Gaze WH. Long-term antibiotic exposure in soil is associated with changes in microbial community structure and prevalence of class 1 integrons. FEMS Microbiol Ecol. 2016;92:1–7. doi: 10.1093/femsec/fiw159. [DOI] [PubMed] [Google Scholar]
- Cole JR, Wang Q, Fish JA, Chai B, McGarrell DM, Sun Y, Brown CT, Porras-Alfaro A, Kuske CR, Tiedje JM. Ribosomal Database Project: Data and tools for high throughput rRNA analysis. Nucleic Acids Res. 2014;42:D633–D642. doi: 10.1093/nar/gkt1244. [DOI] [PMC free article] [PubMed] [Google Scholar]
- Colello R, Etcheverría AI, Di Conza JA, Gutkind GO, Padola NL. Antibiotic resistance and integrons in Shiga toxin-producing Escherichia coli (STEC) Brazilian J Microbiol. 2015;46:1–5. doi: 10.1590/S1517-838246120130698. [DOI] [PMC free article] [PubMed] [Google Scholar]
- Curtis KA, Rudolph DL, Owen SM. Sequence-specific detection method for reverse transcription, loop-mediated isothermal amplification of HIV-1. J Med Virol. 2009;81:966–972. doi: 10.1002/jmv. [DOI] [PubMed] [Google Scholar]
- Epstein SS, Rossel J. Enumeration of sandy sediment bacteria: search for optimal protocol. Mar Ecol Prog Ser. 1995;117:289–298. [Google Scholar]
- Fish JA, Chai B, Wang Q, Sun Y, Brown CT, Tiedje JM, Cole JR. FunGene: The functional gene pipeline and repository. Front Microbiol. 2013;4:1–14. doi: 10.3389/fmicb.2013.00291. [DOI] [PMC free article] [PubMed] [Google Scholar]
- Francois P, Tangomo M, Hibbs J, Bonetti EJ, Boehme CC, Notomi T, Perkins MD, Schrenzel J. Robustness of a loop-mediated isothermal amplification reaction for diagnostic applications. FEMS Immunol Med Microbiol. 2011;62:41–48. doi: 10.1111/j.1574-695X.2011.00785.x. [DOI] [PubMed] [Google Scholar]
- Gaze WH, Abdouslam N, Hawkey PM, Wellington EMH. Incidence of class 1 integrons in a quaternary ammonium compound-polluted environment. Antimicrob Agents Chemother. 2005;49:1802–1807. doi: 10.1128/AAC.49.5.1802. [DOI] [PMC free article] [PubMed] [Google Scholar]
- Gaze WH, Zhang L, Abdouslam NA, Hawkey PM, Calvo-Bado L, Royle J, Brown H, Davis S, Kay P, Boxall AB, Wellington EM. Impacts of anthropogenic activity on the ecology of class 1 integrons and integron-associated genes in the environment. ISME J. 2011;5:1253–1261. doi: 10.1038/ismej.2011.15. [DOI] [PMC free article] [PubMed] [Google Scholar]
- Gillings M, Gaze W, Pruden A, Smalla K, Tiedje J, Zhu YG. Using the class 1 integron-integrase gene as a proxy for anthropogenic pollution. ISME J. 2015;9:1269–1279. doi: 10.1038/ismej.2014.226. [DOI] [PMC free article] [PubMed] [Google Scholar]
- Hardwick SA, Stokes HW, Findlay S, Taylor M, Gillings MR. Quantification of class 1 integron abundance in natural environments using real-time quantitative PCR. FEMS Microbiol Lett. 2008;278:207–212. doi: 10.1111/j.1574-6968.2007.00992.x. [DOI] [PubMed] [Google Scholar]
- Hatt JK, Ritalahti KM, Ogles DM, Lebrón CA, Löffler FE. Design and application of an internal amplification control to improve Dehalococcoides mccartyi 16S rRNA gene enumeration by qPCR. Environ Sci Technol. 2013;47:11131–11138. doi: 10.1021/es4019817. [DOI] [PubMed] [Google Scholar]
- Hu Y, Yang X, Li J, Lv N, Liu F, Wu J, Lin IYC, Wu N, Weimer BC, Gao GF, Liu Y, Zhu B. The bacterial mobile resistome transfer network connecting the animal and human microbiomes. Appl Environ Microbiol. 2016;82:6672–6681. doi: 10.1128/AEM.01802-16. [DOI] [PMC free article] [PubMed] [Google Scholar]
- Johnson TA, Stedtfeld RD, Wang Q, Cole JR, Hashsham SA, Looft T, Zhu YG, Tiedje JM. Clusters of antibiotic resistance genes enriched together stay together in swine agriculture. MBio. 2016;7:2214–2215. doi: 10.1128/mBio.02214-15. [DOI] [PMC free article] [PubMed] [Google Scholar]
- Karkman A, Johnson TA, Lyra C, Stedtfeld RD, Tamminen M, Tiedje JM, Virta M. High-throughput quantification of antibiotic resistance genes from an urban wastewater treatment plant. FEMS Microbiol Ecol. 2016;92:1–7. doi: 10.1093/femsec/fiw014. [DOI] [PubMed] [Google Scholar]
- Koczura R, Mokracka J, Taraszewska A, Lopacinska N. Abundance of class 1 integron-integrase and Sulfonamide resistance genes in river water and sediment is affected by anthropogenic pressure and environmental factors. Microb Ecol. 2016;72:909–916. doi: 10.1007/s00248-016-0843-4. [DOI] [PMC free article] [PubMed] [Google Scholar]
- Koloren P, Sotiriadou I, Karanis P. Investigations and comparative detection of Cryptosporidium species by microscopy, nested PCR and LAMP in water supplies of Ordu, Middle Black Sea, Turkey. Ann Trop Med Parasitol. 2011;105:607–615. doi: 10.1179/2047773211Y.0000000011. [DOI] [PMC free article] [PubMed] [Google Scholar]
- Kostic T, Ellis M, Williams MR, Stedtfeld TM, Kaneene JB, Stedtfeld RD, Hashsham SA. Thirty-minute screening of antibiotic resistance genes in bacterial isolates with minimal sample preparation in static self-dispensing 64 and 384 assay cards. Appl Microbiol Biotechnol. 2015;99:7711–7722. doi: 10.1007/s00253-015-6774-z. [DOI] [PMC free article] [PubMed] [Google Scholar]
- Lane DJ. rRNA sequencing. J. Wiley; 1991. [Google Scholar]
- Li J, Zhou L, Zhang X, Xu C, Dong L, Yao M. Bioaerosol emissions and detection of airborne antibiotic resistance genes from a wastewater treatment plant. Atmos Environ. 2016;124:404–412. doi: 10.1016/j.atmosenv.2015.06.030. [DOI] [Google Scholar]
- Lluque A, Mosquito S, Gomes C, Riveros M, Durand D, Tilley DH, Bernal M, Prada A, Ochoa TJ, Ruiz J. Virulence factors and mechanisms of antimicrobial resistance in Shigella strains from periurban areas of Lima (Peru) Int J Med Microbiol. 2015;305:480–490. doi: 10.1016/j.ijmm.2015.04.005. [DOI] [PMC free article] [PubMed] [Google Scholar]
- Looft T, Johnson TA, Allen HK, Bayles DO, Alt DP, Stedtfeld RD, Sul WJ, Stedtfeld TM, Chai B, Cole JR. In-feed antibiotic effects on the swine intestinal microbiome. Proc Natl Acad Sci USA. 2012;109:1691–6. doi: 10.1073/pnas.1120238109. [DOI] [PMC free article] [PubMed] [Google Scholar]
- Luo Y, Mao D, Rysz M, Zhou Q, Zhang H, Xu L, Alvarez PJJ. Trends in antibiotic resistance genes occurrence in the Haihe River, China. Environ Sci Technol. 2010;44:7220–7225. doi: 10.1021/es100233w. [DOI] [PubMed] [Google Scholar]
- Ma L, Zhang XX, Zhao F, Wu B, Cheng S, Yang L. Sewage treatment plant serves as a hot-spot reservoir of integrons and gene cassettes. J Environ Biol. 2013;34:391–399. [PubMed] [Google Scholar]
- Mayer-blackwell K, Azizian MF, Machak C, Vitale E, Carpani G, De Ferra F, Semprini L, Spormann AM. Nanoliter qPCR platform for highly parallel, quantitative assessment of reductive dehalogenase genes and populations of dehalogenating microorganisms in complex environments. Env Sci Technol. 2014;48:9659–67. doi: 10.1021/es500918w. [DOI] [PubMed] [Google Scholar]
- Mori Y, Nagamine K, Tomita N, Notomi T. Detection of loop-mediated isothermal amplification reaction by turbidity derived from magnesium pyrophosphate formation. Biochem Biophys Res Commun. 2001;289:150–4. doi: 10.1006/bbrc.2001.5921. [DOI] [PubMed] [Google Scholar]
- Muziasari WI, Pärnänen K, Johnson TA, Lyra C, Karkman A, Stedtfeld RD, Tamminen M, Tiedje JM, Virta M. Aquaculture changes the profile of antibiotic resistance and mobile genetic element associated genes in Baltic Sea sediments. FEMS Microbiol Ecol. 2016;92:fiw052. doi: 10.1093/femsec/fiw052. [DOI] [PubMed] [Google Scholar]
- Njiru Z. Loop-mediated isothermal amplification technology:towards point of care diagnostics. PLoS Negl Trop Dis. 2012;6:e1572. doi: 10.1371/journal.pntd.0001572. [DOI] [PMC free article] [PubMed] [Google Scholar]
- Notomi T, Okayama H, Masubuchi H, Yonekawa T, Watanabe K, Amino N, Hase T. Loop-mediated isothermal amplification of DNA. Nucleic Acids Res. 2000;28:E63. doi: 10.1093/nar/28.12.e63. [DOI] [PMC free article] [PubMed] [Google Scholar]
- Oliveira-Pinto C, Costa PS, Reis MP, Chartone-Souza E, Nascimento AMA. Diversity of gene cassettes and the abundance of the class 1 integron-integrase gene in sediment polluted by metals. Extremophiles. 2016;20:283–289. doi: 10.1007/s00792-016-0820-3. [DOI] [PubMed] [Google Scholar]
- Paoletti MG. Using bioindicators based on biodiversity to assess landscape sustainability. Agric Ecosyst Environ. 1999;74:1–18. doi: 10.1016/S0167-8809(99)00027-4. [DOI] [Google Scholar]
- Phongpaichit S, Wuttananupan K, Samasanti W. Class 1 integrons and multidrug resistance among Escherichia coli isolates from human stools. Southeast Asian J Top Med Public Heal. 2008;39:279–287. [PubMed] [Google Scholar]
- Power ML, Emery S, Gillings MR. Into the Wild: Dissemination of antibiotic resistance determinants via a species recovery program. PLoS One. 2013;8:1–5. doi: 10.1371/journal.pone.0063017. [DOI] [PMC free article] [PubMed] [Google Scholar]
- Rockström J, Steffen W, Noone K, Persson A, Chapin FS, III, Lambin E, Lenton TM, Scheffer M, CF, Schellnhuber HJ, Nykvist B, de Wit CA, Hughes T, van der Leeuw S, Rodhe H, Sörlin S, Snyder PK, Constanza R, Svedin U, Falkenmark M, Karlberg L, Corell RW, Fabry VJ, Hansen J, Walker B, Liverman D, Richardson K, Crutzen P, JF Planetary boundaries: exploring the safe operating space for humanity. Ecol Soc. 2009;14:1–32. doi: 10.1038/461472a. [DOI] [PubMed] [Google Scholar]
- Spindler A, Otton LM, Fuentefria DB, Corção G. Beta-lactams resistance and presence of class 1 integron in Pseudomonas spp. isolated from untreated hospital effluents in Brazil. Antonie Van Leeuwenhoek. 2012;102:73–81. doi: 10.1007/s10482-012-9714-2. [DOI] [PubMed] [Google Scholar]
- Stalder T, Barraud O, Casellas M, Dagot C, Ploy M. Integron involvement in environmental spread of antibiotic resistance. Front Microbiol. 2012;3:119. doi: 10.3389/fmicb.2012.00119. [DOI] [PMC free article] [PubMed] [Google Scholar]
- Stedtfeld RD, Baushke SW, Tourlousse DM, Miller SM, Stedtfeld TM, Gulari E, Tiedje JM, Hashsham SA. Development and experimental validation of a predictive threshold cycle equation for quantification of virulence and marker genes by high-throughput nanoliter-volume PCR on the OpenArray platform. Appl Env Microbiol. 2008;74:3831–8. doi: 10.1128/AEM.02743-07. [DOI] [PMC free article] [PubMed] [Google Scholar]
- Stedtfeld RD, Liu YC, Stedtfeld TM, Kostic T, Kronlein MR, Srivannavit O, Khalife WT, Tiedje JM, Gulari E, Hughes M, Etchebarne B, Hashsham SA. Static self-directed sample dispensing into a series of reaction wells on a microfluidic card for parallel genetic detection of microbial pathogens. Biomed Microdevices. 2015;17:89. doi: 10.1007/s10544-015-9994-1. [DOI] [PMC free article] [PubMed] [Google Scholar]
- Stedtfeld RD, Stedtfeld TM, Kronlein M, Seyrig G, Steffan RJ, Cupples AM, Hashsham AM. DNA extraction-free quantification of Dehalococcoides spp. in groundwater using a hand-held device. Environ Sci Technol. 2014;48:13855–13863. doi: 10.1021/es503472h. [DOI] [PubMed] [Google Scholar]
- Stedtfeld RD, Stedtfeld TM, Samhan F, Kanitkar YH, Hatzinger PB, Cupples AM, Hashsham SA. Direct loop mediated isothermal amplification on filters for quantification of Dehalobacter in groundwater. J Microbiol Methods. 2016a;131:61–67. doi: 10.1016/j.mimet.2016.09.025. [DOI] [PMC free article] [PubMed] [Google Scholar]
- Stedtfeld RD, Tourlousse DM, Seyrig G, Stedtfeld TM, Kronlein M, Price S, Ahmad F, Gulari E, Tiedje JM, Hashsham SA. Gene-Z: a device for point of care genetic testing using a smartphone. Lab Chip. 2012;12:1454–62. doi: 10.1039/c2lc21226a. [DOI] [PubMed] [Google Scholar]
- Stedtfeld RD, Williams MR, Fakher U, Johnson TA, Stedtfeld TM, Wang F, Khalife WT, Hughes MH, Etchebarne BE, Tiedje JM, Hashsham SA. Antimicrobial resistance dashboard application for mapping environmental occurrence and resistant pathogens. FEMS Microbiol Ecol. 2016b;92:1–9. doi: 10.1093/femsec/fiw020. [DOI] [PMC free article] [PubMed] [Google Scholar]
- Stokes HW, Gillings MR. Gene flow, mobile genetic elements and the recruitment of antibiotic resistance genes into Gram-negative pathogens. FEMS Microbiol Rev. 2011;35:790–819. doi: 10.1111/j.1574-6976.2011.00273.x. [DOI] [PubMed] [Google Scholar]
- Sun M, Ye M, Schwab AP, Li X, Wan J, Wei Z, Wu J, Friman VP, Liu K, Tian D, Liu M, Li H, Hu F, Jiang X. Human migration activities drive the fluctuation of ARGs: Case study of landfills in Nanjing, eastern China. J Hazard Mater. 2016;315:93–101. doi: 10.1016/j.jhazmat.2016.04.077. [DOI] [PubMed] [Google Scholar]
- Wang F, Stedtfeld RD, Kim O, Chai B, Yang L, Stedtfeld TM, Hong G, Kim D, Lim HS, Hashsham SA, Tiedje JM, Sul WJ. Influence of soil characteristics and proximity to Antarctic research stations on abundance of antibiotic resistance genes in soils. Env Sci Technol. 2016 doi: 10.1021/acs.est.6b02863. Just Accepted. [DOI] [PubMed] [Google Scholar]
- Wang FH, Qiao M, Su JQ, Chen Z, Zhou X, Zhu YG. High throughput profiling of antibiotic resistance genes in urban park soils with reclaimed water irrigation. Env Sci Technol. 2014;48:9079–9085. doi: 10.1021/es502615e. [DOI] [PubMed] [Google Scholar]
- Wang H, Sangwan N, Li H, Su J, Oyang W, Zhang Z, Gilbert J, Zhu Y, Ping F, Zhang H. The antibiotic resistome of swine manure is significantly altered by association with the Musca domestica larvae gut microbiome. ISME J. 2017;11:100–11. doi: 10.1038/ismej.2016.103. [DOI] [PMC free article] [PubMed] [Google Scholar]
- Wang M, Sun J, Zhong W, Xiong W, Zeng Z, Sun Y. Presence and distribution of Macrolides-Lincosamide-Streptogramin resistance genes and potential indicator ARGs in the university ponds in Guangzhou, China. Environ Sci Pollut Res. 2016;23:22937–22946. doi: 10.1007/s11356-016-7521-4. [DOI] [PubMed] [Google Scholar]
- Williams MR, Stedtfeld RD, Waseem H, Stedtfeld T, Upham B, Khalife W, Etchebarne B, Hughes M, Tiedje JM, Hashsham SA. Implications of direct amplification for measuring antimicrobial resistance using point-of-care devices. Anal Methods. 2017 doi: 10.1039/C6AY03405E. Accepted. [DOI] [PMC free article] [PubMed] [Google Scholar]
- Xie WY, Yang XP, Li Q, Wu LH, Shen QR, Zhao FJ. Changes in antibiotic concentrations and antibiotic resistome during commercial composting of animal manures. Env Pollut. 2016;219:182–190. doi: 10.1016/j.envpol.2016.10.044. [DOI] [PubMed] [Google Scholar]
- Zhu YG, Johnson TA, Su JQ, Qiao M, Guo GX, Stedtfeld RD, Hashsham SA, Tiedje JM. Diverse and abundant antibiotic resistance genes in Chinese swine farms. Proc Natl Acad Sci USA. 2013;110:3435–3440. doi: 10.1073/pnas.1222743110. [DOI] [PMC free article] [PubMed] [Google Scholar]
- Zhu YG, Zhao Y, Li B, Huang CL, Zhang SY, Yu S, Chen YS, Zhang T, Gillings MR, Su JQ. Continental-scale pollution of estuaries with antibiotic resistance genes. Nat Microbiol. 2017;2:16270. doi: 10.1038/nmicrobiol.2016.270. [DOI] [PubMed] [Google Scholar]
Associated Data
This section collects any data citations, data availability statements, or supplementary materials included in this article.
Supplementary Materials
Fig S1. Map of samples collected in Michigan and Republic of Korea. Samples abbreviated with TS are from the Tittabawassee and Saginaw Rivers, and samples abbreviated RC are from the Red Cedar River. The Tittabawassee River turns into the Saginaw upstream from the town of Saginaw. River sediment samples TS1, TS3, TS11, TS13 are downstream of Midland, MI in a rural setting. Sample TS2.4 and TS2.16 are upstream from Saginaw, MI and TS2.1, 2.3 are within Saginaw, MI. Samples RC_A and RC_H are upstream of Lansing MI, and samples RC_N and RC_Q are in the city of Lansing, MI. Populations as of 2013 (US Census Bureau and UNdata) are listed for towns and cities near sampling sites.
Table S1. List of LAMP primers.


