Abstract
Hearing relies on a series of coupled electrical, acoustical, and mechanical interactions inside the cochlea that enable sound processing. The local structural and electrical properties of the organ of Corti (OoC) and basilar membrane give rise to the global, coupled behavior of the cochlea. However, it is difficult to determine the root causes of important behavior, such as the mediator of active processes, in the fully coupled in vivo setting. An alternative experimental approach is to use an excised segment of the cochlea under controlled electrical and mechanical conditions. Using the excised cochlear segment experiment conducted by Chan and Hudspeth [Nat. Neurosci. 8, 149–155 (2005); Biophys. J. 89, 4382–4395 (2005)] as the model problem, a quasilinear computational model for studying the active in vitro response of the OoC to acoustical stimulation was developed. The model of the electrical, mechanical, and acoustical conditions of the experimental configuration is able to replicate some of the experiment results, such as the shape of the frequency response of the sensory epithelium and the variation of the resonance frequency with the added fluid mass. As in the experiment, the model predicts a phase accumulation along the segment. However, it was found that the contribution of this phase accumulation to the dynamics is insignificant. Taking advantage of the relative simplicity of the fluid loading, the three-dimensional fluid dynamics was reduced into an added mass loading on the OoC thereby reducing the overall complexity of the model.
I. INTRODUCTION
In this paper, we present a mathematical model of an in vitro, excised cochlear turn mounted in the specialized two-chamber experimental configuration developed by Chan and Hudspeth1–3 (which we will refer to as the Chan-Hudspeth experiment). We identified the key mechanical, fluidic, and electrical elements and boundary conditions required to accurately represent the vibrational response of the cochlear structures to acoustic stimulation. The predictions of the quasilinear model are compared to the experimental results. We also present a consistent method to reduce the three-dimensional (3D) model to a lower-order model representation. These steps are an important prelude to a tractable, computationally efficient, fully nonlinear simulation of the experiment.
In vivo and in vitro experiments provide valuable data to expose and analyze the unique transduction occurring in the auditory periphery. Due to geometrical constraints of the coiled cochlea and technical measurement limitations, it is difficult to measure the vibration of most regions of the organ of Corti (OoC) in vivo using traditional methods based on laser velocimetry.4 New optical techniques, like optical coherence tomography, make it possible to access heretofore inaccessible locations in the living, intact cochlea (e.g., Refs. 5–7). However, there are limitations to these methods (including spatial resolution and the ability to artificially control the mechanical and ionic environment), restricting the reductionist information that can be obtained about cellular function. Until these limitations are resolved, in vitro preparations are still needed to address important questions of cochlear function. An in vitro preparation enables the study of discrete cochlear components. For instance, Beurg et al.8 performed intricate and carefully controlled in vitro direct mechanical stimulation of the hair bundle (HB) to determine its transduction properties; in this case, the tectorial membrane (TM) was stripped off of the preparation to gain access to the HB. As another example, Ghaffari et al.9 isolated the TM in order to study traveling wave propagation on it. Furthermore, the in vitro preparations enable us to obtain an integrated understanding of how the individual components such as the HB, TM, and basilar membrane (BM) interact under mechanical, acoustical, or electrical stimulations. Gummer et al.10 prepared freshly isolated sections of the cochlea and investigated the contribution of the TM and BM motions to the electromechanics of the OoC. Ulfendahl et al.11 developed an in vitro preparation of the guinea pig temporal bone to study the micromechanical behavior of the cochlea. This preparation, which is known as ITER, consists of the cochlea opened at the apex, allowing observation of cellular structures within the partition and measurements of cellular vibration. The hemicochlear preparation12–14 is another in vitro technique that allows access to various cochlear structures with minimal physical distortion. This technique bisects the cochlea such that the tonotopic features of apical, middle, and basal regions can be preserved and studied.
An active in vitro preparation of a small segment of the cochlea, with minimal physical disruption of the epithelium, is ideal to investigate the cochlear intrinsic dynamics. The in vitro preparations of the Chan and Hudspeth,1–3 as well as those of Nowotny and Gummer,15,16 are notable for isolating a segment of the cochlea with controlled mechanical, ionic, and electrical conditions in order to keep the OoC in as pristine a state as possible. Both groups demonstrate that the mechano-electric-transducer (MET) channels are kept at least partially operational and measure the OoC motions due to pressure and/or electrical stimulation. Both of these preparations hold the potential for uncovering important structure-function relationships of the auditory periphery, such as the cochlear amplification. However, neither of these experiments has been modeled. Furthermore, computational simulation of these experiments, such as those presented in this paper, would allow us to analyze the data and explore the influence of variations in mechanical and electrical conditions.
II. METHODS
A. Mathematical model
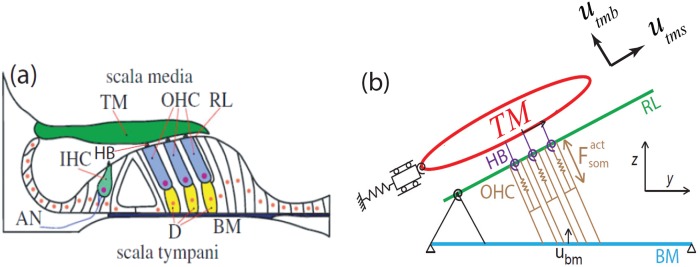
We use a 3D model of the cochlea based on Ramamoorthy et al.17 This model is physiologically based in that electrical and mechanical elements of the OoC are coupled explicitly through kinematic constraints and forces. Figure 1 depicts a schematic of the OoC and transverse section of the model. In this paper, the BM is modeled as a locally reacting structure and we set the parameters from available gerbil data. The fluid is assumed inviscid except in the subtectorial space, and viscosity is incorporated through damping of the OoC and the BM.
FIG. 1.
(Color online) (a) A schematic transverse section of the OoC. TM, tectorial membrane; OHC, outer hair cell; RL, reticular lamina; BM, basilar membrane; D, Deiters cell; AN, auditory nerve fibre; HB, hair bundle; IHC, inner hair cell (image from Ref. 18). (b) Micromechanical model for the OoC structures (x axis into the page).
A cable model is used to represent the macroscopic current flow in the fluid. The deflection of the HB of the outer hair cell (OHC) triggers the opening of the MET channels, resulting in current flow into the OHC. The current is a function of the HB deflection, which in turn stimulates OHC somatic motility, applying a mechanical force to the BM and reticular lamina (RL). The OHC is modeled using linearized piezoelectric relations, a model that provides forward and reverse transduction to convert mechanical into electrical energy and vice versa. In each cross-sectional circuit branch, there are three electrical potentials corresponding to scala tympani (), scala media (SM; ), and OHC (; note, there is no scala vestibuli in the Chan-Hudspeth preparation, hence, it is not modeled). Similarly, the displacements, , and represent the longitudinal variation of the BM, TM shear, and TM bending motion, respectively, as shown in Fig. 1(b). The structural degrees of freedom are coupled to both the fluid pressure and the electrical potentials.17 The OHC transduction channel is modeled as a linear function of the HB rotation with respect to RL (). For each row of HBs, the current due to fluctuating conductance (i.e., the MET channel sensitivity) flowing through the OHC is expressed as (more details of the equations and parameters of the model can be found in Refs. 17 and 19)
| (1) |
where is the resting value of the potential difference between the SM and intracellular OHC potential, Gmax is the maximum saturating conductance of the HB, and μ is the MET scale factor that controls activity level (as a means to simulate the nonlinear sensitivity of the channel); μ varies from 0 to 1 such that μ = 0 represents the low activity and μ = 1 denotes the full activity ( causes instability of the segment through a Hopf bifurcation21). The OHC somatic electromotility is introduced as the mediator of the electrical–structural interaction and the cochlear active processes. The HB motility, another hypothesized active mechanism, is not considered in this model. However, its inclusion is possible and, indeed, needed to analyze the full experiment. We do not do so here because we are focusing on accurate representation of the boundary conditions and simplification of the fluid dynamics. The electrical and structural domains in the model are coupled through a set of linearized piezoelectric relations of OHC (e.g., Ref. 22) that relate the compressional force on the OHC (Fohc) as
| (2) |
and current flowing through the basolateral wall (Iohc) as
| (3) |
These equations relate the OHC compression (, a linear function of ubm, utms, and utmb) and transmembrane voltage () to the OHC force and current. Here, Zm is the OHC basolateral impedance, is the piezoelectric electromechanical coupling coefficient, and Kohc represents the OHC stiffness.17 Both terms in Eq. (3) are frequency dependent and their amplitudes are comparable depending on the dominance of either the transmembrane potential or piezoelectric strain rate. The mathematical modeling gives rise to a set of coupled partial differential equations (PDEs), which are approximated using the finite element method (FEM).23 The coupled mechanical-fluidic-electrical equations can be represented in the matrix form as
| (4) |
In this equation, u is the nodal vector of the OoC structural displacements, ubm, utms, and utmb, for each cross section. Similarly, is the nodal vector of scalar voltages, and , for each cross section. Last, the vector p represents nodal fluid pressure in the upper and lower compartments. These vectors represent the finite element nodal interpolants of the cochlear structural-electrical-acoustical responses calculated by solving the linear matrix of Eq. (4). The sizes of these vectors depend on the resolution of our mesh (25 μm in the x direction and 50 μm in the z direction), as well as the number of y-direction modes used in each cross section. Structural, electrical, and fluid components are denoted by subscripts s, e, and f, respectively, while Q represents coupling between the domains, e.g., and arise from Eqs. (1)–(3) and model coupling between the structural and electrical components. As illustrated in Fig. 1, the acoustical stimulation is applied to the fluid nodes at the bottom of the lower compartment. On the right-hand side of Eq. (4), represents the pressure loading vector on these nodes. A list of important parameters used in this study is presented in Table I (see Ref. 24 for other parameters).
TABLE I.
Material properties for the gerbil cochlear model (x is in meters).
| Property | Description | Value |
|---|---|---|
| b | BM width | 80 μm base–180 μm apex |
| hbm | BM thickness | 7 μm base–1.7 μm apex |
| Kbm | BM stiffness per unit area | |
| Ktms | TM shear stiffness per unit length | |
| Ktmb | TM bending stiffness per unit length | |
| Krl | RL stiffness per unit length | |
| Kohc | OHC stiffness per unit length | |
| Kst | Stereocilia stiffness | |
| Mbm | BM mass per unit area | |
| Mtms | TM shear mass per unit length | |
| Mtmb | TM bending mass per unit length | |
| cbm | BM damping coefficient per unit length | |
| ctms | TM shear damping coefficient per unit length | |
| ctmb | TM bending damping coefficient per unit length | |
| Lhb | HB length | 1 μm base–6 μm apex |
| Gmax | Saturating HB conductance | |
| Electromechanical coupling coefficient | (base)– (apex) N/m/mV | |
| Resting potential difference between vsm and vohc | 150 (base)–131.5 (apex) mV |
B. Model geometry and boundary conditions
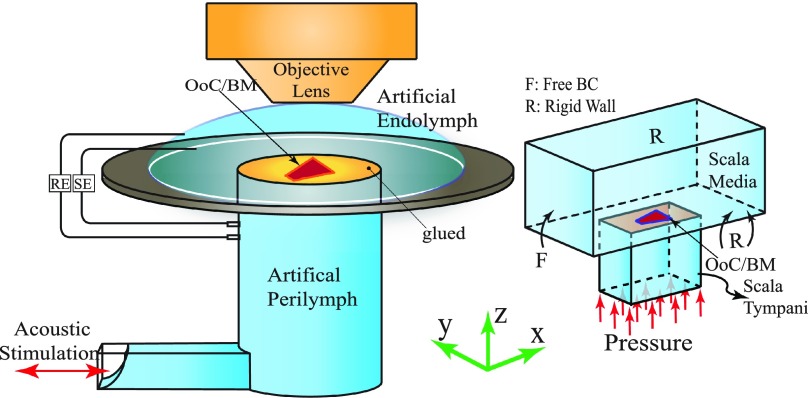
A schematic of the experimental configuration and the simulation model are illustrated in Fig. 2. In the experiment, a small segment of the Mongolian gerbil cochlea is excised [see Fig. 1(c) in Ref. 1] and mounted in a two compartment recording chamber. The bony portion of the excised segment was affixed atop a thick, 12.5 mm diameter coverslip. Roughly 700 μm of the turn was exposed to the fluid above and below the BM through a roughly 1.5 mm hole punched in the plastic to provide an opening to mount the cochlear segment. The lower compartment was comprised of two sections. The first was a horizontal channel 15 mm long, 1.3 mm × 0.8 mm in cross-section. This horizontal channel connected to the curved surface of cylindrical segment, 1.8 mm in diameter and 1 mm high. Artificial endolymph (AE) and perilymph surrounded the cochlear partition from the apical and basal surfaces, respectively [see Fig. 2(a)]. The upper and lower compartments were connected through an electrical circuit and a transepithelial potential was applied to preserve activity. Acoustical stimuli for a range of intensities and frequencies were applied through the lower compartment and movement of the OoC components [i.e., the BM, TM, and inner hair cell (IHC) HBs] were measured at various positions across their radial dimension. In this paper, we simulate the configuration used for the TM and HB movement measurements as the apical and basal aspects of the OoC are immersed in AE and artificial perilymph (AP), respectively, as usual. We do not compare our results to BM displacement of the experiments. In the experiment for the BM measurements,2 a flipped configuration from the orientation described above is used. The apical portion of the preparation is oriented downward toward the cylindrical hole and the basal portion upward in contact with the drop of fluid, a configuration requiring a different model.
FIG. 2.
(Color online) The experimental setup (Refs. 1–3) and simulation. (a) In vitro cochlear preparation (not to scale). The apical and basal aspects of the OoC were immersed in artificial endolymph (AE) and artificial perilymph (AP), respectively. Pairs of recording electrodes (RE) and stimulating electrodes (SE) measured microphonic potentials and provided transepithelial electrical stimuli. Acoustic stimuli from an earphone (red arrow) were delivered to the BM through the fluid filled lower compartment. (b) The computational simulation of the cochlear segment experiment. The segment was stimulated through the pressure boundary condition on the bottom side of the fluid (red arrows). Two chambers located on the top and bottom of the OoC, simulated ST and SM, respectively. Boundary conditions were set as rigid wall (R) or pressure free (F) on each face, according to the experimental configuration as discussed in the text (Sec. II B).
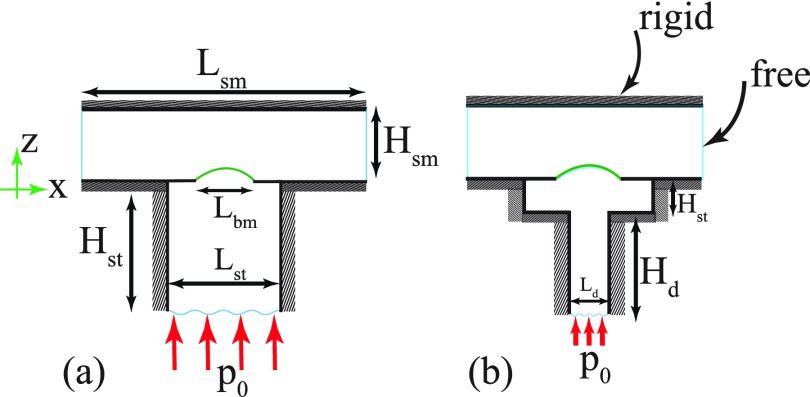
Figure 2(b) illustrates our main 3D mathematical model and corresponding boundary conditions. This model geometry is simplified and only the exposed section of the BM and OoC are modeled. The scala tympani and scala media in Fig. 2(b) are modeled as two chambers, maintaining the fluid volume inside the lower and upper experimental compartments, respectively. For the sake of modeling simplicity, in our main model we have combined the two lower compartments into a single chamber and did not include the right angle bend in the chamber system. However, in order to investigate the effect of the geometry simplification on our simulations, a second more complicated model with two sections in the lower compartment is used and fluid dynamics of the two configurations are compared in Sec. IV. The cochlear section was assumed to be glued and stationary except over a segment of the diameter hole drilled into the coverslip, as reported in Ref. 2. Boundary conditions corresponding to the single chamber and two chambers configurations are shown in Fig. 3, labeled as model A and model B, respectively.
FIG. 3.
(Color online) The longitudinal cross section of the FEM models for (a) simplified configuration (denoted as model A) and (b) two-chamber lower duct configuration (denoted as model B).
In Table II, the baseline model dimensions for models A and B are given. The length (L), width (W), and height (H) represent the x, y, and z dimensions, respectively [see Fig. 3(a), with the y direction into the page] and the subscripts refer to the two scalae. The SM occupies the region for while the ST occupies the region below the cochlear segment. The fluid pressure and velocity at z = 0 were coupled to our structural model of the OoC and BM over the flexible portion and rigid boundary conditions elsewhere on that plane. In the ST, the surfaces normal to the x and y directions are rigid, while a known external pressure was applied to the base. In the SM, the water-immersion objective lens, located on top of the upper compartment, constrains the SM fluid, hence, that entire surface () was modeled as a rigid wall boundary condition. The pressure release (free) condition on the endolymphatic droplet of the experimental configuration is represented by the free (pressure zero) boundary conditions on the x-normal faces in the SM.
TABLE II.
Geometrical dimensions of the models corresponding to the Chan-Hudspeth experiment are shown in Fig. 3. The models' dimensions are chosen such that the fluid volume inside the ST and media match, respectively, the reported volume of the fluid in the bottom compartment (2–15 μL) and droplet on top (600 μL). All dimensions in the table are in millimeters.
| Property | Description | Model A | Model B |
|---|---|---|---|
| Hsm | SM height | 2.5 | 2.5 |
| Wsm | SM width | 11 | 11 |
| Lsm | SM length | 2.5 | 2.5 |
| Lst | Scala tympani length | 1.8 | 1.5 |
| Wst | Scala tympani width | 1.4 | 1.5 |
| Hst | Scala tympani channel height | variable | 1.25 |
| Hd | Lower duct height | — | variable |
| Ld | Lower duct length | — | 0.7 |
| Wd | Lower duct width | — | 1.5 |
III. RESULTS
Unless otherwise noted, the segment length and pressure stimuli for the reported plots are, respectively, and dB relative to 20 μPa [i.e., sound pressure level (SPL)]. The excised segment was located in the lateral half of the middle turn of the cochlea corresponding to a region spanning 2.0–3.5 mm from the helicotrema, or roughly 8.5–10 mm from the base of the BM.40 The parameters in our model are set to account for a segment excised from the apical part of the cochlea; the properties at the segment center match those of an intact cochlea at a location x0 from the base, denoted in each figure of the results. As in the Chan-Hudspeth experiment, acoustic stimuli are applied to the base of the fluid in the ST.
A. Mechanical responses of the OoC to acoustic stimulation
In Fig. 4(a) the normalized IHC HB frequency response of the experiment measurements [Fig. 2(c) of Ref. 1] are compared to the predicted OHC HB motion (our model does not predict the IHC HB motion). Note that all frequency responses reported in the Chan-Hudspeth1–3 are for displacements of the IHC HBs. We observe that our model OHC HB response predicts the quality factor of the measured IHC HB motion very well; however, the maximum amplitude of the OHC HB deflection is predicted 26 times smaller than IHC HB (1.3 nm versus 36 nm). From the radial dependency of the reticula lamina motion reported in Fig. 2(b) of Ref. 2 and also the HB motion measurements of Ref. 25, the IHC HB motion is expected to be greater than the OHC HB motion. Furthermore, we note that the IHC HB displacement reported in this experiment [36 nm for 60 dB SPL at the 850 Hz characteristic frequency (CF)] is much greater than those reported in Ref. 25 (20 nm for 98 dB SPL at the 200 Hz CF), as well as the TM radial motion measured in Ref. 26 (0.17 nm for 60 dB SPL at the 650 Hz CF); this could be due to the difference in the boundary conditions of this configuration compared to the normal cochlea or the difference in the CF.
FIG. 4.
(Color online) Comparing experimental measurements to the simulation results (model B). (a) Experimental IHC HB frequency response reported in Fig. 2(c) of Ref. 1 and the simulated OHC-HB response at mm (both results normalized to their maximum values). (b) The TM vertical displacement at the resonance peak over a range of stimulus levels for active (with NMDG) and passive (transepithelial potential turned off) experiments [Fig. 5(d) of Ref. 1] together with the corresponding simulations. The passive case is simulated by setting the MET scale factor (μ) equal to zero while for the active simulations μ is decreased as the SPL increases in order to match the experimental nonlinear data; corresponding μ values are denoted next to the data of each simulation. The power-law slope of the TM response with NMDG diverged from linearity (dashed gray line) at low stimulus levels. For simulation of (b), the distance mm and amount of the fluid inside the lower chamber (m = 11 mg) is chosen to match the resonance frequency of the experiment (CF = 450 Hz) reported in Fig. 5(c) of Ref. 1.
A quantitative comparison between the experimental data and simulation results is presented in Fig. 4(b). In Fig. 4(b), the dependence on pressure of the predicted and measured [Fig. 5(d) of Ref. 1] transverse motion of the TM at the resonance frequency for passive (with the transepithelial potential turned off) and active preparations are compared. We chose a location where the resonance frequency of the model and the experiment match and then proceed to make a level comparison between the two. The asterisk and triangle markers represent the data for passive experiment and simulation, respectively. It is observed that our model is able to predict the TM passive displacements very well.
In addition to the passive configurations, we used our linearized active model to predict the measured nonlinear responses by altering the MET scale factor [see Eq. (1)] as SPL varies. Figure 4(b) compares the active experiment (square markers) and simulation (circle markers) results; the MET channel sensitivities that we used for the stimulations are denoted in the plot. We are able to match the trend (qualitatively and quantitatively) using a decreasing value of the MET scale factor, mimicking the saturating MET channels. All models used were globally stable. The TM nonlinear (active) data reported in the Chan-Hudspeth experiments are only for the preparations in which the K+ in the endolymph was replaced with N-methyl-D-glucamine (NMDG); hence, we have compared our active model results to those data. NMDG is a permeant cation that does not traverse the transduction channel thereby reducing the MET channel sensitivity.27 In order to simulate the effect of NMDG, we set the maximum of the MET channel conductance [embodied by the activity factor (μ)] to a value of 0.45 in Fig. 4(b), less than half of the highest stable value for normal endolymph.
Figure 4(b) reveals that the nonlinearity seen in the Chan and Hudspeth experiments can be reproduced using our cochlear model with OHC somatic electromotility as the sole mediator of the active process. A nonlinear model that includes the HB motility is forthcoming to further probe this interesting finding.
B. Adding fluid in the ST decreases the segment resonance frequency systematically
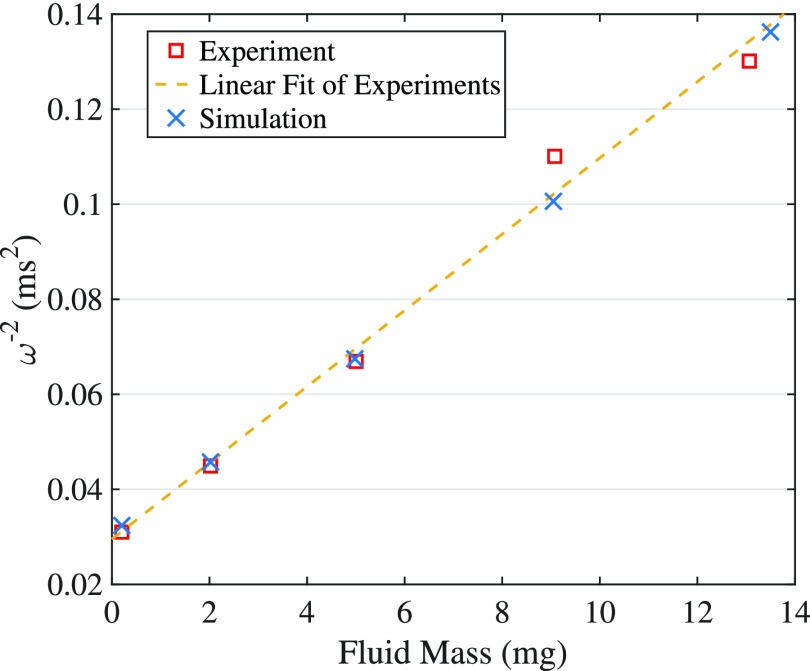
In the Chan-Hudspeth experiment,1 it is shown that increasing fluid mass inside the lower compartment gives rise to a linear increase of the inverse square of the system natural frequency. Figure 5 illustrates the experimental data [Fig. 2(e) of Ref. 1] together with our simulation results (model B). The initial fluid mass inside the ST compartment (m0) is not given in the experimental data; instead, a range of 2–5 mg is reported. In our simulation we use mg in order to match the first resonance frequency of the experiment. It is observed that our model predicts the linear variation of the inverse of the segment resonance frequency with the ST fluid mass precisely.
FIG. 5.
(Color online) The inverse square of the HB resonance frequency increases linearly with fluid mass inside the ST compartment. The ST fluid mass is added by increasing Hd [Fig. 3(b)] from its initial value (1.9 mm). There is an excellent agreement between the experimental data [Fig. 2(e) of Ref. 1] and our simulation (model B; x0 = 9.3 mm) predictions.
The variation of the BM resonance frequency with changing the lower and upper compartments' fluid heights of the simplified configuration (model A) are presented in Table III. It is observed that for fixed Hsm, increasing the fluid height in the lower channel reduces the resonance frequency monotonically. Moreover, the effect of increasing Hsm saturates at 200 μm for , after which added fluid has little effect. Both of these results match the findings of Chan and Hudspeth,1,2 indicating that the simple geometry of model A has captured the macroscopic fluid dynamical boundary conditions qualitatively.
TABLE III.
The effect of the height of the fluid chambers (Hst and Hsm) on the resonance frequency of the system while keeping the y-dimension (width) and x-dimension (length) of the chambers constant.
| ST fluid (Hsm = 250 μm) | SM fluid (Hst = 200 μm) | ||
|---|---|---|---|
| 100 | 1390 | 100 | 1245 |
| 200 | 1250 | 200 | 1250 |
| 300 | 1155 | 300 | 1250 |
| 500 | 1002 | 500 | 1250 |
| 700 | 900 | 700 | 1250 |
C. Phase accumulation occurs on small segments of the cochlea
Sound-evoked vibrations transmitted into the mammalian cochlea produce traveling waves along the BM, which results in a phase dependence of the spatial fields (e.g., the BM velocity). This phenomenon first was explored by Von Békésy28 and later by in vivo measurements (e.g., Refs. 4 and 29). The wavelength of the in vivo BM response near the location of the CF is seen to depend on the intensity level of the sound (an effect well-modeled by modifying the MET scale factor20). We investigate existence of a spatial phase dependence in our model and explore the conditions under which it may exist even with such a short cochlear segment.
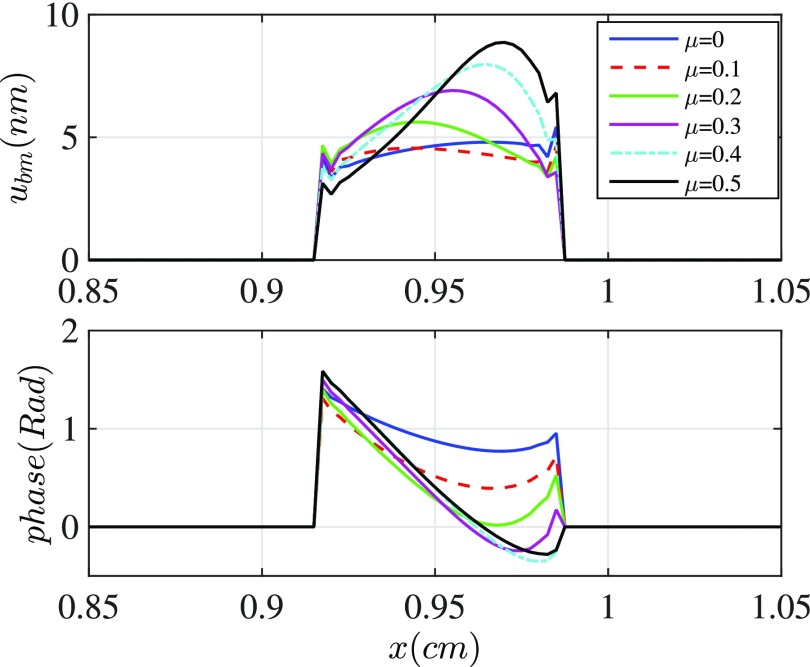
Figure 6 illustrates the predicted BM displacement and phase responses along the segment for different activity levels. The cochlear activity in this study is generated by somatic electromotility of the OHC and it is controlled by altering the MET scale factor (μ) which was varied from 0 (passive) to 1 (the stability boundary). It is observed that increasing activity correlates to a larger phase accumulation along the cochlea. These results are in accordance with the BM vibration measurements at multiple locations along the cochlea.4,29 The BM phase lags increasingly with distance from the basal end (except at a small segment near the apical end, which we attribute to the reflection at the boundary). Even for the passive case (μ = 0) a small phase lag is predicted arising from the variation of the structural properties (such as stiffness) along the segment. Hudspeth and Chan3 reported a phase accumulation of about 0.94 rad over the 700 μm exposed length of the BM. This phase lag matches our simulation results with , as indicated in Fig. 6. Also, we note that a phase accumulation of 0.94 rad over a 700 μm segment corresponds to a wavelength of nearly 4.6 mm, much longer than any measured values in a living cochlea.29 Because of the apparent reflection of the apical portion of the preparation, a combination of traveling wave and standing wave is likely present.
FIG. 6.
(Color online) The BM displacement under acoustical stimulation at the CF of the segment (frequency = 0.9 kHz) for different MET channel sensitivities [varied by μ coefficient defined in Eq. (1); μ = 0 represents the passive preparation and μ = 1 is stability boundary]. The amount of phase accumulation increases with increasing MET scale factor.
IV. DISCUSSION
A. The near field acoustic mass is significant but can be represented by a simple geometry
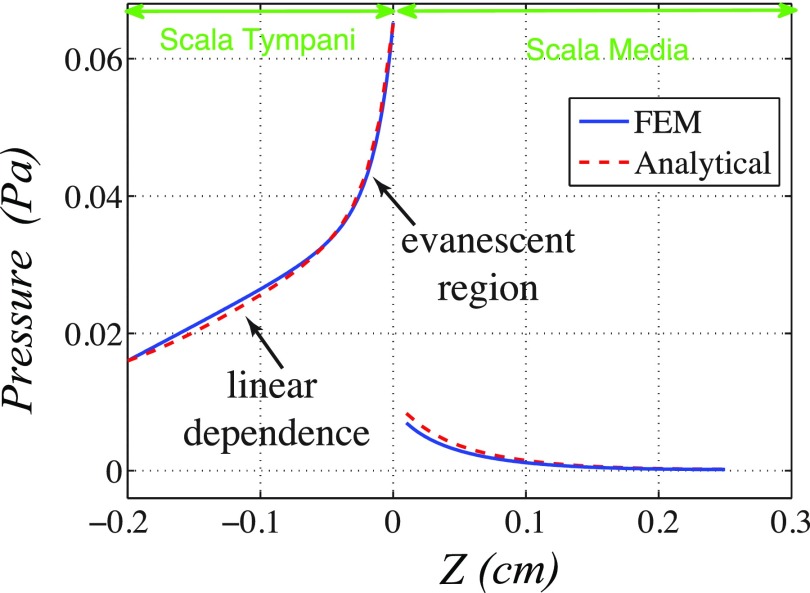
As discussed in the Sec. II B, the geometry of the lower compartment of the experimental configuration is simplified in model A. In order to investigate the effect of the geometrical simplification on our simulations, the fluid pressure prediction arising from the two configurations (models A and B, introduced in Fig. 3) are compared in Fig. 7. As shown, the acoustical pressure is applied from the bottom lower channel (representing the ST) and boundary conditions are discussed in Fig. 3. The geometrical dimensions are set such that the amount of fluid in both configurations is the same. For both of the configurations the following conditions are seen: uniform cross sectional pressure far from the cochlear segment, a prominent near field pressure effect close to the BM, and the SM pressure is low compared to that found in the ST. The pressure amplitude near the BM on the ST side is found to be larger for model B than model A. The fluid pressure can be decomposed into two components: the near field and far field contributions.31 The near field component arises from the evanescent pressure field (as can be seen by the hot spot in the pressure field near the BM in Fig. 7). The far field component is due to the pressure that is uniform across the cross section of the chamber (see Fig. 7) and has a nearly linear dependency on z. Both of these effects can be seen in the height dependence of the pressure field (shown in Fig. 7 and in Appendix B, Fig. 14).
FIG. 7.
(Color online) Fluid pressure profile for (a) model A and (b) model B in response to a 60 dB SPL acoustical excitation at a frequency equal to the CF of the segment (x0 = 9.3 mm) applied at the lower boundary. The units are in Pascal and the fluid mass inside the ST compartment is 5 mg.
The fluid pressure loads the BM and OoC, acting as an added mass. The macroscopic fluid boundary conditions influence the added mass and, consequently, the resonance frequency of the cochlear segment. In order to explore this effect further, we compute the added mass from our FEM formulation as
| (5) |
where ρ denotes the fluid density and the displacement vector () is the normalized solution of the BM response for a given frequency. The dynamical stiffness matrix of the fluid is while and correspond to fluid-structure coupling at the BM [see Eq. (4)]. The superscripts “T” and “−1” denote transpose and inverse of the corresponding matrix, respectively. The distributed fluid loading added mass is pre- and post-multiplied by the displacement vector in order to lump the added mass by integrating out its spatial dependency. This fluid condensation is used in structural acoustic analysis.30 The results are shown in Fig. 8 (green curves). Note, if instead of using the computed finite element displacement, we use an approximate basis function (either assumed mode or calculated mode) the degrees of freedom in the model can be reduced, speeding the computations.
FIG. 8.
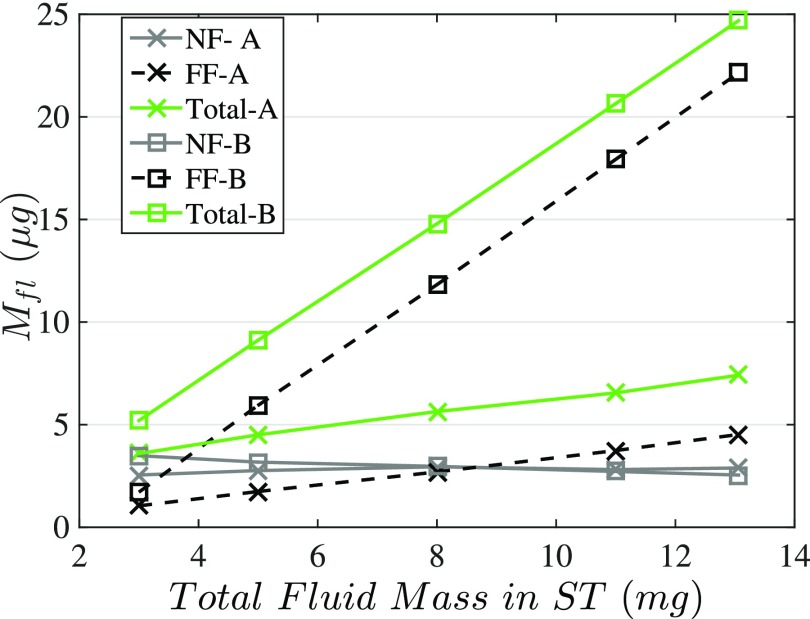
(Color online) The fluid loading added masses (Mfl) to the BM and corresponding near/far field components for the model A and B configurations, illustrated in Fig. 3. The total added masses (green curves) and the far field (FF) components are calculated, respectively, from the FEM formulation [Eq. (5)] and the control volume analysis (Appendix A). The near field (NF) components then are estimated by subtracting the far field component from the total added mass.
In Fig. 8 the near field and far field added mass components for the models A and B are presented. The near field added mass is estimated by subtracting the one-dimensional (1D) added mass [Mff in Eqs. (B10) and (B13)] from the total added mass computed from the FEM [Eq. (5)]. It is shown that the far field added mass is significantly different for the two configurations; however, the near field components associated with the evanescent field are almost overlapping. Moreover, it is observed that the far field components for both configurations increase as the ST fluid mass increases (by increasing the lower channels heights) while the near field added masses are nearly constant for ST fluid masses above 5 mg; this is predicted from our closed form expression of the added mass [Eq. (B10)] where the hyperbolic tangent function and exponential terms which comprise the near field mass asymptote to a constant with increasing channel height. This shows that for the geometry of the Chan-Hudspeth experiment the near field mass loading is controlled by the interaction at the BM-fluid surface and not affected by the sudden change in cross-sectional area in model B. If Hst was less than , where the evanescent pressure is dominant (see Fig. 14), a more complicated geometric model would be needed to represent the interaction.
The far field component can be well described using the simple 1D control volume analysis (as described in Appendix A). The assumption of the control volume analysis that the pressure is only a function of height (z) is largely true except in the near field of the BM where evanescent pressure fields are important (we will see this has a dramatic effect on our estimation of the fluid loading added mass). Because the pressure in the SM is much smaller than that in the ST (∼1/10 in amplitude; see Fig. 7), giving rise to a much smaller fluid loading mass in the SM side comparing to that of the ST (∼1/100). Hence, we neglect the SM fluid mass in our simple control volume model. Under these assumptions, using a model that only includes the 1D fluid loading, the resonance frequency of the segment is approximated as (see Appendix A)
| (6) |
where is the volumetric or acoustical stiffness (see Ref. 33) and is the volume displacement, which is constant along the height (H), under the assumption of incompressibility. Equation (6) predicts that the far field volumetric added mass () is simply proportional to the ratio of the height to the cross-section area of the duct. Furthermore Eq. (6) shows that the resonance frequency decreases with increasing fluid column height (as in the experiment and predicted by 3D fluid dynamical simulations; see Fig. 5). Somewhat counterintuitively, Eq. (6) predicts that the resonance frequency increases with increasing channel width, and we validated this prediction using 3D simulations (not shown). Hence, even in this approximate formula the resonance frequency does not equal the square root of the quotient of the stiffness of the partition and the total fluid mass. Note that Eq. (6) is different from the equations given in Refs. 1 and 2. Moreover, this 1D control volume analysis does not account for the near field fluid mass. In Appendix B, Eq. (B12), we present a correction term to include the effect of the near field pressure into a simple control volume analysis.
Assuming a half sinusoidal wave dependence in both the x and y directions for the BM displacements, a 3D structural-acoustic analysis of model A is developed and a closed form formulation for the fluid loading added mass is calculated (see Appendix B for the full derivations). This closed from representation explicitly demonstrates the near field and far field contributions to the added mass in Eq. (B10). Hence, if one wishes to approximate the added mass without resorting to the finite element (FE) calculations, the expressions in Appendix B can be used to provide a reasonable approximation for the 1D and near field added masses.
B. Estimation of the cochlear partition effective stiffness from the OoC frequency response
Analyzing the frequency response of the cochlear segment under acoustical stimulation while varying the fluid loading provides us with a means to estimate stiffness of the partition. Stiffness is not a material property, but rather depends on the boundary conditions, geometry, and forcing of the electro-elastic-acoustic system. In this section, we show how to use the experimental results to estimate the overall partition volumetric stiffness.
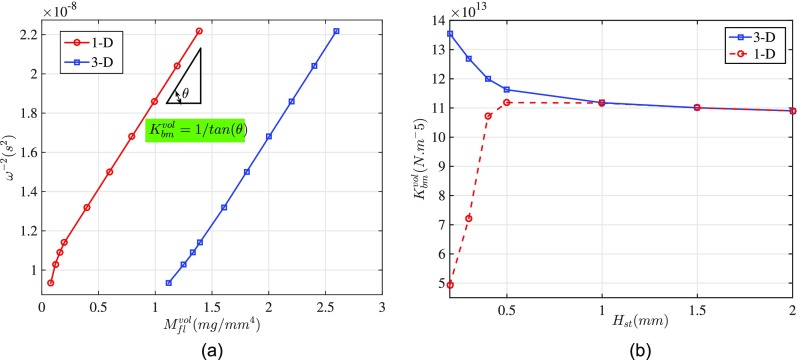
In order to estimate the volumetric (acoustic) stiffness of the cochlear partition, we need not compute the exact added mass for the experimental configuration. We need only have an estimate of the change in the acoustical mass. Although the 1D model incorrectly computes the added mass, neglecting the near field effect, our analytic expression for the variation of the volumetric added mass () of the 3D model asymptotes to the 1D model, (Fig. 9). That is because the near field component of the added mass is nearly constant for ST fluid masses larger than 5 mg (see Fig. 8). Hence, the slope of the versus the 1D fluid mass (linearly dependent on the fluid height in the 0.8 × 1.3 mm chamber in the experiment) yields the inverse of the volumetric stiffness. It is important to estimate the resonance frequency as the peak of the frequency response of the velocity rather than displacement to avoid the confounding effect of the changing damping ratio with mass loading (even if the damping itself remains constant).
FIG. 9.
(Color online) Estimation of the cochlear partition volumetric stiffness from the velocity frequency response. (a) Square inverse of the BM resonance (characteristic) frequency (from FEM simulation, model A) versus volumetric added mass, calculated from 1D control volume analysis [Eq. (6)] and 3D analytical model [Eq. (B11)]. (b) Volumetric stiffness calculated from inverse of slopes of curves in (a), assuming a simple harmonic characteristic for the cochlear segment. The OoC volumetric stiffness approximated from the two models are the same () and match the exact volumetric stiffness of the segment, calculated by the FEM model () for uniform pressure on the BM and low frequency stimulation.
To test this method, we used the results predicted by our 3D FEM simulation (model A) as experimental data and compared our estimation of the volumetric stiffness to the known value of our model. Figure 9(a) illustrates how the square inverse of the frequency corresponding to the peak of BM velocity-frequency response (obtained from FEM simulation) depends on the fluid volumetric mass, calculated from 1D and 3D analytical models. The slope of the curves in Fig. 9 represents the inverse of the BM volumetric stiffness, as illustrated in Fig. 9(b). In this plot the OoC volumetric stiffnesses estimated using the two models (1D and 3D) are shown to converge to a value which we have verified to be the same as the true value of the volumetric stiffness calculated by the FEM model (). Hence, the 1D approximation [Eq. (6)] can be used to estimate the stiffness.
We applied the simplified method (requiring only the comparison of the change of the resonance as a function of the added mass as in Fig. 9) to compute the volumetric stiffness of the experimental data from the Chan-Hudspeth experiment1 Fig. 2(e) and found it to be . The effective volumetric stiffness is a direct prediction of the method. To compare to the more commonly measured point stiffness we must use a model. If we approximate the BM deflection using a strongly orthotropic plate model [Eq. (B9)] with simply supported boundary conditions, the relationship between volumetric and point stiffnesses can be obtained as in Refs. 34 and 35. Using the relation presented in Eq. (A5b) of Ref. 34 with probe diameter , we obtain a point stiffness of 0.06 N/m for the center of the experimental cochlear segment. We note that the measured point stiffness depends on the radial location and load;34–37 hence, the point stiffness values reported by different investigators do vary. For instance, the experimental data by Ref. 36 estimates a point stiffness of kmeasure = 0.08 N/m at the similar location. Hence, our estimate for the stiffness from the Chan-Hudspeth experiment is consistent with experimental data.
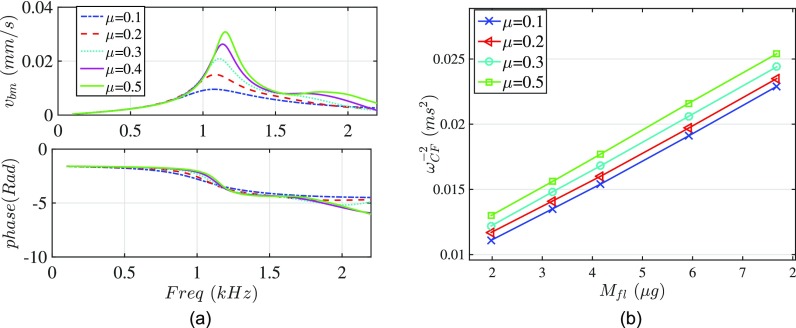
The effect of the cochlear activity on the partition stiffness is investigated by applying the proposed method to the numerical experiment data. Figure 10(a) demonstrates the frequency responses of the velocity for various MET channel sensitivities computed using the 3D FEM code. The variation of the inverse square of the CFs as a function of the estimated added mass [from Eq. (B10)] are illustrated in Fig. 10(b) for each activity level. Using the slopes in Fig. 10(b) we find the lumped stiffness of the partition to be 0.225, 0.230, 0.232, 0.234 N/m for μ equal 0.1, 0.2, 0.3 and 0.5, respectively. Therefore, this technique predicts a stiffness that is relatively insensitive to activity. This result is consistent with the experimental data by Olson and Mountain,34 where they did not detect changes in situ between pre-mortem stiffness and stiffness measured within 1 h post-mortem.
FIG. 10.
(Color online) (a) Velocity frequency response for different MET scale factor (μ). Higher MET channel sensitivity gives rise to sharper response with larger CF. (b) Inverse of the characteristic frequency with respect to the added mass for different activity levels. The added mass is calculated from the analytical model [Eq. (B10)].
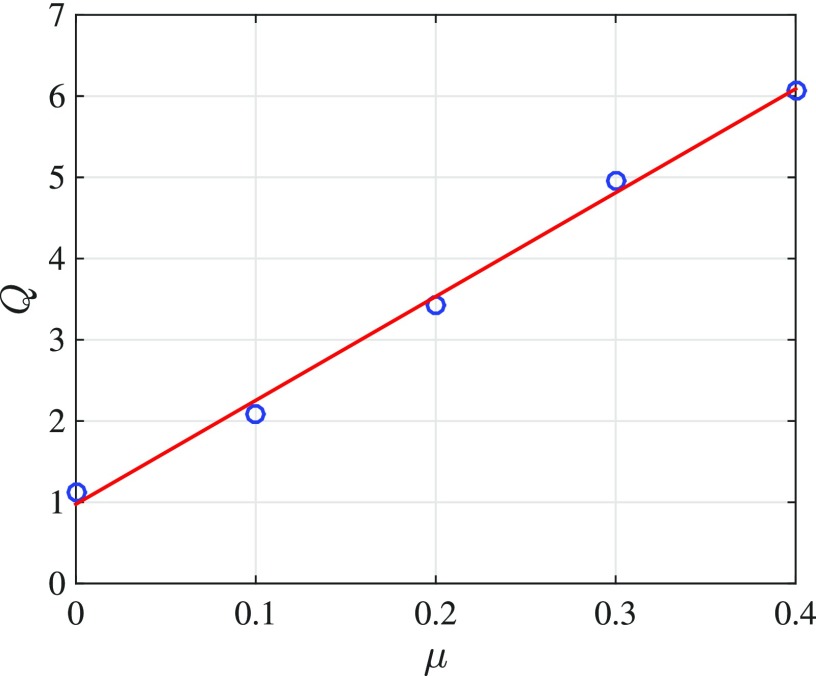
The quality factor did turn out to accurately predict the activity level. In our 3D mathematical model, energy loss is implemented as fluidic damping in the OoC. The quality factor (Q) of the frequency response of a single degree of freedom oscillator is related to the effective damping ratio as38
| (7) |
and this can be computed directly from Fig. 10(a). Variation of the quality factor with respect to the MET scale factor (μ, representing the activity level of the segment) is depicted in Fig. 11. The value of Q at μ = 0 (passive) corresponds purely to the structural/fluid damping, while larger activity levels involve both damping and active process effects. We see a nearly linear relation between the Q of the system and the activity level. This means for our model that the activity level of the cochlear segment can be estimated via a direct measurement. The linear behavior is probably due to minimal effect of the traveling wave on the OoC dynamics in this small segment preparation. The activity level of the in vitro experimental setup can be altered by varying the artificial endocochlear potential between SM and ST. Manipulations of the ionic content of the SM could also be used to affect the active processes and their effect measured by monitoring the Q of the system.
FIG. 11.
(Color online) The variation of the quality factor with respect to the MET scale factor μ. Increasing activity level gives rise to higher quality factors (sharper responses) in a linear fashion.
V. CONCLUSION
The main purpose of the present paper was to simulate the experimental conditions of an active cochlear segment preparation and make recommendations on how to use this model to analyze the Chan-Hudspeth experiments. In this study, we have presented a physiologically motivated mechanical-electrical-fluidic model for predicting the response of the cochlear segment to acoustical stimulus. The dependency of the fluid loading added mass components (near field and far field) on the experiment geometry was calculated and utilized together with the resonance frequency of the segment to approximate the partition effective/volumetric stiffness. The accuracy of this simple technique was demonstrated by estimating the partition stiffness of our model as a virtual experiment and then used the same calculation on experimental data. We show that even for very small segments of the cochlea (700 μm) traveling waves may exist in an active preparation; however, the phase accumulation amounted to only 15% of a wavelength, which allows us to treat the preparation as a simple harmonic oscillator. The quality factor of the segment frequency response is found to be the most reliable metric of cochlear activity while changes in the phase accumulation were found to be a less reliable measure of the activity. Our results show that OHC somatic motility is able to replicate the nonlinear input-output relationships seen in the experimental data. Future work includes implementing an active HB model and a fully nonlinear simulation in order to explore contribution of each active process in the cochlear mechanics.
ACKNOWLEDGMENTS
This work was supported by National of Institutes of Health (NIH) Grant Nos. DC-004084 and T32DC-00011.
APPENDIX A: CONTROL VOLUME ANALYSIS
A control volume analysis32 is utilized to estimate the resonance frequency of the simplified 1D model of the Chan-Hudspeth experiment, demonstrated in Fig. 12. In the analysis, we consider the fluid incompressible, inviscid with only height dependence. The conservation of the momentum for the selected control volume results in
| (A1) |
where the Sst and Sd are, respectively, the area of the fluid chamber just below the BM and the area of the lower duct where the acoustical pressure P0 is applied. A separate control volume for the chamber below BM gives rise to
| (A2) |
The incompressibility of the fluid implies conservation of the volumetric displacement (velocity)
| (A3) |
Moreover, the fluid pressure below the BM (Pbm) can be expressed as multiplication of the cochlear partition volumetric stiffness and the BM volumetric displacements
| (A4) |
Plugging Eqs. (A3) and (A4) into Eqs. (A1) and (A2), the resonance frequency of this configuration, labeled as model B in the text, is derived as
| (A5) |
In the simplified configuration (model A) we use the case where and Hd = 0
| (A6) |
However, as discussed in the text (Sec. IV A), this simple model neglects the near field mass. Hence, the more accurate approximation formula is given by Eq. (B12).
FIG. 12.
(Color online) The 1D control volume model of the experiment; the lower (narrow) part represents the long horizontal channel in Fig. 2. Pressures for three cross sections are labeled in the figure.
APPENDIX B: ANALYTICAL APPROXIMATION OF THE FLUID PRESSURE AND ADDED MASS
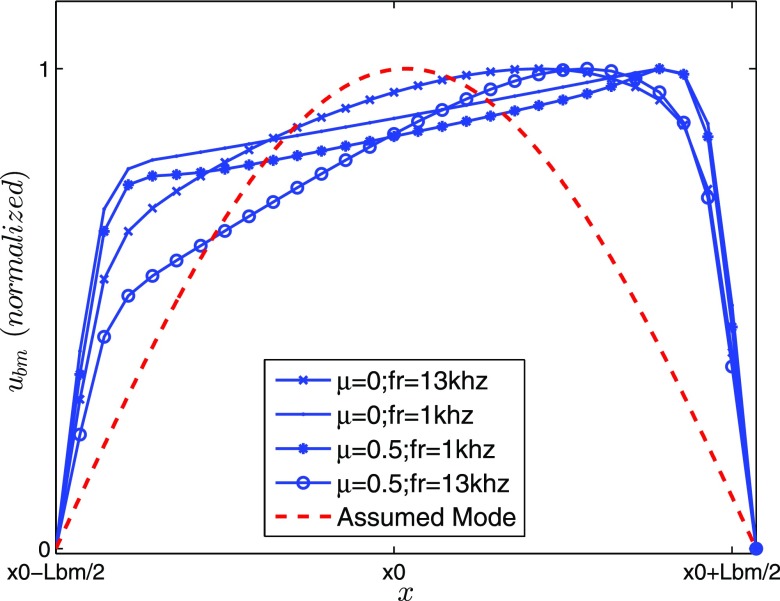
The cochlear partition is stimulated by pressure difference across the OoC. An analytical formulation of the fluid dynamics interacting with the OoC mechanics provides us with a robust explanation of the results obtained from the computational model. By utilizing a Fourier series along the x and y directions, we approximate the pressure distribution in the fluid. This approach along with the WKB method has been developed by Steele and Taber39 to calculate the cochlear response in a 3D model. They employed the WKB method to compute the BM wavelength, which is varying spatially along the cochlea. However, compactness of the segment in our simulation allows us to approximate the wavelength as by assuming a half sine wave shape for the BM displacement. The spatial dependence of the assumed BM displacement is compared to displacement of the FEM simulation results for two different frequencies and activity levels in Fig. 13. Considering this simplification for the exposed short segment, the pressure distribution inside the ST of the simplified configuration [model A pictured in Fig. 3(a)] is given by
| (B1) |
Moreover, the boundary condition at corresponds to the acoustical pressure stimuli, p0, in the bottom, while a linearized Euler relation satisfies the BM-fluid interaction at z = 0
| (B2) |
As depicted in Fig. 2(c), geometrical dimensions corresponding to the ST and SM are illustrated by “st” and “sm” superscripts, respectively. Moreover, ρ and Ubm denote fluid density and BM maximum displacement , respectively. A time dependence of is assumed, where ω is the angular frequency. Considering the rigid wall pressure boundary conditions in x and y directions (see Fig. 2) and hinged edges for the BM, the representing functions in Eq. (B1) have the following forms:
| (B3) |
The functions and represent the pressure components corresponding to modes j and k, respectively. Taking advantage of orthogonality of the modes, we can integrate out the longitudinal and lateral modes by multiplying both sides of the BC by and and integrating over and , respectively
| (B4) |
where
| (B5) |
Note that and are defined in the domain of and , respectively, and are zero everywhere else. Considering the Laplace equation for the inviscid and inviscous fluid on the ST, we have
| (B6) |
Next, we substitute pressure expansion from Eq. (B1) into Eq. (B6),
| (B7) |
where, . This second-order differential equation together with corresponding boundary condition [Eq. (B4)] has an exponential solution for all j's and k's except when in which, then, the solution is a linear polynomial
| (B8) |
where and . Finally, we plug Eq. (B8) into Eq. (B1) and obtain pressure distribution inside the ST. A similar process is performed for the SM compartment to calculate Psm. Appropriately with the given circumstance, we need to redefine , thus, indicating that the pressure boundary condition for the SM compartment is different than the ST (see Fig. 2). Finally, the pressure difference on the BM appears in the right-hand side of the BM equation of motion (plate model)
| (B9) |
where Cbm is the BM viscous damping per unit area and Mbm is the mass of the BM per unit area. Dxx, Dyy, Dxy, and Ds are the orthotropic plate bending stiffnesses of the BM mode. Locally reacting model of the BM corresponds to . In Fig. 14, pressure distribution along the z axis [Eq. (B1)] of the analytical computation are compared to the FEM results. An excellent agreement between the two approaches validates the assumed structural model consideration in the analytical calculation.
FIG. 13.
(Color online) The BM displacement along the segment is approximated with a sinusoid function, . The BM displacement peaks for the numerical responses are shifted toward the apex due to the BM stiffness spatial variation.
FIG. 14.
(Color online) The 3D analytical model [Eq. (B1)] reproduces the pressure dependency predicted by the FEM analysis. In the analytical calculation, the BM displacement is assumed the same as the FEM simulation.
From Eq. (B8) we note that there exists a dynamical added mass due to the fluid loading on the BM. Hence, the effective BM mass is , in which and
| (B10) |
This formula involves the near field (Mnf, summation terms) and far field (Mff, last term) contributions on the fluid loading added mass calculation. The number of modes necessary for convergence is determined by the summation limits (except which is separated out in the last term). We found that using as few as ten modes for each x and y component was enough for convergence in our simulations. One can compute the acoustical/volumetric added mass by dividing Eq. (B10) by the BM mode shapes
| (B11) |
In Eq. (A5) the resonance frequency of the model B is estimated using the control volume analysis. However, the evanescent added mass is neglected in this analysis. Here, we can correct it by considering the near field added mass (Mnf),
| (B12) |
Here, is the far field volumetric added mass that can be lumped by multiplying to the BM mode shapes
| (B13) |
References
- 1. Chan D. K. and Hudspeth A. J., “ Ca2+ current driven nonlinear amplification by the mammalian cochlea in vitro,” Nat. Neurosci. 8, 149–155 (2005). 10.1038/nn1385 [DOI] [PMC free article] [PubMed] [Google Scholar]
- 2. Chan D. K. and Hudspeth A. J., “ Mechanical responses of the organ of corti to acoustic and electrical stimulation in vitro,” Biophys. J. 89, 4382–4395 (2005). 10.1529/biophysj.105.070474 [DOI] [PMC free article] [PubMed] [Google Scholar]
- 3. Hudspeth A. J. and Chan D. K., “ An experimental preparation of the mammalian cochlea that displays compressive nonlinearity in vitro,” in Auditory Mechanisms: Processes and Models, edited by Nuttall A. L., Ren T., Gillespie P., Grosh K., and de Boer E. ( World Scientific, Singapore, 2006), pp. 127–137. [Google Scholar]
- 4. Robles L. and Ruggero M. A., “ Mechanics of the mammalian cochlea,” Physiol. Rev. 81(3), 1305–1352 (2001). [DOI] [PMC free article] [PubMed] [Google Scholar]
- 5. Lee H. Y., Raphael P. D., Park J., Ellerbee A. K., Applegate B. E., and Oghalai J. S., “ Noninvasive in vivo imaging reveals differences between tectorial membrane and basilar membrane traveling waves in the mouse cochlea,” Proc. Natl. Acad. Sci. U.S.A. 112, 3128–3133 (2015). 10.1073/pnas.1500038112 [DOI] [PMC free article] [PubMed] [Google Scholar]
- 6. Ramamoorthy S., Zha D., Chen F., Jacques S. L., Wang R., Choudhury N., Nuttall A. L., and Fridberger A., “ Filtering of acoustic signals within the hearing organ,” J. Neurosci. 34, 9051–9058 (2014). 10.1523/JNEUROSCI.0722-14.2014 [DOI] [PMC free article] [PubMed] [Google Scholar]
- 7. Ren T., He W., and Kemp D., “ Reticular lamina and basilar membrane vibrations in living mouse cochleae,” Proc. Natl. Acad. Sci. U.S.A. 113(35), 9910–9915 (2016). 10.1073/pnas.1607428113 [DOI] [PMC free article] [PubMed] [Google Scholar]
- 8. Beurg M., Evans M. G., Hackney C. M., and Fettiplace R., “ A large-conductance calcium-selective mechanotransducer channel in mammalian cochlear hair cells,” J. Neurosci. 26, 10992–11000 (2006). 10.1523/JNEUROSCI.2188-06.2006 [DOI] [PMC free article] [PubMed] [Google Scholar]
- 9. Ghaffari R., Aranyosi A. J., and Freeman D. M., “ Longitudinally propagating traveling waves of the mammalian tectorial membrane,” Proc. Natl. Acad. Sci. U.S.A. 104, 16510–16515 (2007). 10.1073/pnas.0703665104 [DOI] [PMC free article] [PubMed] [Google Scholar]
- 10. Gummer A. W., Hemmert W., and Zenner H. P., “ Resonant tectorial membrane motion in the inner ear: Its crucial role in frequency tuning,” Proc. Natl. Acad. Sci. U.S.A. 93, 8727–8732 (1996). 10.1073/pnas.93.16.8727 [DOI] [PMC free article] [PubMed] [Google Scholar]
- 11. Ulfendahl M., Flock A., and Khanna S. M., “ A temporal bone preparation for the study of cochlear micromechanics at the cellular-level,” Hear. Res. 40, 55–64 (1989). 10.1016/0378-5955(89)90099-3 [DOI] [PubMed] [Google Scholar]
- 12. Teudt I. U. and Richter C. P., “ The hemicochlea preparation of the guinea pig and other mammalian cochleae,” J. Neurosci. Methods 162, 187–197 (2007). 10.1016/j.jneumeth.2007.01.012 [DOI] [PubMed] [Google Scholar]
- 13. Hu X. T., Evans B. N., and Dallos P., “ Direct visualization of organ of Corti kinematics in a hemicochlea,” J. Neurophysiol. 82(5), 2798–2807 (1999). [DOI] [PubMed] [Google Scholar]
- 14. He D. Z. Z., Jia S. P., and Dallos P., “ Mechanoelectrical transduction of adult outer hair cells studied in a gerbil hemicochlea,” Nature 429, 766–770 (2004). 10.1038/nature02591 [DOI] [PubMed] [Google Scholar]
- 15. Nowotny M. and Gummer A. W., “ Nanomechanics of the subtectorial space caused by electromechanics of cochlear outer hair cells,” Proc. Natl. Acad. Sci. U.S.A. 103, 2120–2125 (2006). 10.1073/pnas.0511125103 [DOI] [PMC free article] [PubMed] [Google Scholar]
- 16. Nowotny M. and Gummer A. W., “ Vibration responses of the organ of Corti and the tectorial membrane to electrical stimulation,” J. Acoust. Soc. Am. 130, 3852–3872 (2011). 10.1121/1.3651822 [DOI] [PubMed] [Google Scholar]
- 17. Ramamoorthy S., Grosh K., and Nawar T. G., “ A mechano-electro-acoustical model for the cochlea: Response to acoustic stimuli,” J. Acoust. Soc. Am. 121, 2758–2773 (2007). 10.1121/1.2713725 [DOI] [PubMed] [Google Scholar]
- 18. Szalai R., Champneys A., Homer M., Maoileidigh D. O., Kennedy H., and Cooper N., “ Comparison of nonlinear mammalian cochlear-partition models,” J. Acoust. Soc. Am. 133, 323–336 (2013). 10.1121/1.4768868 [DOI] [PubMed] [Google Scholar]
- 19. Meaud J. and Grosh K., “ Coupling active hair bundle mechanics, fast adaptation, and somatic motility in a cochlear model,” Biophys. J. 100, 2576–2585 (2011). 10.1016/j.bpj.2011.04.049 [DOI] [PMC free article] [PubMed] [Google Scholar]
- 20. Meaud J. and Grosh K., “ The effect of tectorial membrane and basilar membrane longitudinal coupling in cochlear mechanics,” J. Acoust. Soc. Am. 127, 1411–1421 (2010). 10.1121/1.3290995 [DOI] [PMC free article] [PubMed] [Google Scholar]
- 21. Nankali A. and Grosh K., “ On the stability and compressive nonlinearity of a physiologically based model of the cochlea,” AIP Conf. Proc. 1703, 070016 (2015). 10.1063/1.4939390 [DOI] [Google Scholar]
- 22. Deo N. and Grosh K., “ Simplified nonlinear outer hair cell models,” J. Acoust. Soc. Am. 117, 2141–2146 (2005). 10.1121/1.1871753 [DOI] [PubMed] [Google Scholar]
- 23. Hughes T. J. R., The Finite Element Method: Linear Static and Dynamic Finite Element Analysis ( Dover, New York, 2000). [Google Scholar]
- 24. Ren T., He W., Li Y., Grosh K., and Fridberger A., “ Light-induced vibration in the hearing organ,” Sci. Rep. 4(5941), 1–8 (2014). [DOI] [PMC free article] [PubMed] [Google Scholar]
- 25. Fridberger A., Tomo I., Ulfendahl M., and de Monvel J. B., “ Imaging hair cell transduction at the speed of sound: Dynamic behavior of mammalian stereocilia,” Proc. Natl. Acad. Sci. U.S.A. 103, 1918–1923 (2006). 10.1073/pnas.0507231103 [DOI] [PMC free article] [PubMed] [Google Scholar]
- 26. Hemmert W., Zenner H. P., and Gummer A. W., “ Three-dimensional motion of the organ of Corti,” Biophys. J. 78, 2285–2297 (2000). 10.1016/S0006-3495(00)76775-0 [DOI] [PMC free article] [PubMed] [Google Scholar]
- 27. Lumpkin E. A., Marquis R. E., and Hudspeth A., “ The selectivity of the hair cells mechanoelectrical-transduction channel promotes Ca2+ flux at low Ca2+ concentrations,” Proc. Natl. Acad. Sci. U.S.A. 94, 10997–11002 (1997). 10.1073/pnas.94.20.10997 [DOI] [PMC free article] [PubMed] [Google Scholar]
- 28. Von Békésy G., Experiments in Hearing ( McGraw-Hill, New York, 1960). [Google Scholar]
- 29. Ren T. Y., “ Longitudinal pattern of basilar membrane vibration in the sensitive cochlea,” Proc. Natl. Acad. Sci. U.S.A. 99, 17101–17106 (2002). 10.1073/pnas.262663699 [DOI] [PMC free article] [PubMed] [Google Scholar]
- 30. Morand H. J. P. and Ohayon R., Fluid-Structure Interaction: Applied Numerical Methods ( Wiley, New York, 1995). [Google Scholar]
- 31. Ni G. and Elliott S. J., “ Comparing methods of modeling near field fluid coupling in the cochlea,” J. Acoust. Soc. Am. 137, 1309–1317 (2015). 10.1121/1.4908242 [DOI] [PubMed] [Google Scholar]
- 32. White F. M., Fluid Mechanics ( McGrawHill, Boston, 2003). [Google Scholar]
- 33. Kinsler L. E., Frey A. R., Coppens A. B., and Sanders J. V., Fundamentals of Acoustics ( Wiley-VCH, Weinheim, Germany, 1999). [Google Scholar]
- 34. Olson E. S. and Mountain D. C., “ In vivo measurement of basilar-membrane stiffness,” J. Acoust. Soc. Am. 89, 1262–1275 (1991). 10.1121/1.400535 [DOI] [PubMed] [Google Scholar]
- 35. Gummer A. W., Johnstone B. M., and Armstrong N. J., “ Direct measurement of basilar membrane stiffness in the guinea pig,” J. Acoust. Soc. Am. 70, 1298–1309 (1981). 10.1121/1.387144 [DOI] [Google Scholar]
- 36. Emadi G., Richter C. P., and Dallos P., “ Stiffness of the gerbil basilar membrane: Radial and longitudinal variations,” J. Neurophysiol. 91, 474–488 (2004). 10.1152/jn.00446.2003 [DOI] [PubMed] [Google Scholar]
- 37. Naidu R. C. and Mountain D. C., “ Basilar membrane tension calculations for the gerbil cochlea,” J. Acoust. Soc. Am. 121, 994–1002 (2007). 10.1121/1.2404916 [DOI] [PubMed] [Google Scholar]
- 38. Inman D. J., Engineering Vibration ( Prentice Hall, Englewood Cliffs, NJ, 2007). [Google Scholar]
- 39. Steele C. R. and Taber L. A., “ Comparison of WKB calculations and experimental results for three-dimensional cochlear models,” J. Acoust. Soc. Am. 65, 1007–1018 (1979). 10.1121/1.382570 [DOI] [PubMed] [Google Scholar]
- 40. Hudspeth A. J. (personal communication, 2013).


