Abstract
Background and Objectives
Image-based treatment planning can be used to compute the delivered light dose during interstitial photodynamic therapy (I-PDT) of locally advanced head and neck squamous cell carcinoma (LA-HNSCC). The objectives of this work were to evaluate the use of surface fiducial markers and flexible adhesive grids in guiding interstitial placement of laser fibers, and to quantify the impact of discrepancies in fiber location on the expected light dose volume histograms (DVHs).
Methods
Seven gel-based phantoms were made to mimic geometries of LA-HNSCC. Clinical flexible grids and fiducial markers were used to guide the insertion of optically transparent catheters, which are used to place cylindrical diffuser fibers within the phantoms. A computed tomography (CT) was used to image the markers and phantoms before and after catheter insertion and to determine the difference between the planned and actual location of the catheters. A finite element method was utilized to compute the light DVHs. Statistical analysis was employed to evaluate the accuracy of fiber placement and to investigate the correlation between the location of the fibers and the calculated DVHs.
Results
There was a statistically significant difference (p = 0.018) between all 7 phantoms in terms of the mean displacement. There was also statistically significant correlation between DVHs and depth of insertion (p=0.0027), but not with the lateral displacement (p = 0.3043). The maximum difference between actual and planned DVH was related to the number of fibers (p = 0.0025) and the treatment time.
Conclusions
Surface markers and a flexible grid can be used to assist in the administration of a prescribed DVH within 15% of the target dose provided that the treatment fibers are placed within 1.3 cm of the planned depth of insertion in anatomies mimicking LA-HNSCC. The results suggest that the number of cylindrical diffuser fibers and treatment time can impact the delivered DVHs.
Introduction
Currently, there is no universally effective treatment for patients with locally advanced and recurrent head and neck squamous cell carcinoma (LA-HNSCC)1,2. In most cases, these tumors failed to respond to standard therapies (surgery, radiation, or chemotherapy). Interstitial photodynamic therapy (I-PDT) is a promising palliative, non-overlapping treatment option for these patients3-6. I-PDT involves the systemic administration of a light sensitive drug (photosensitizer, PS) followed by PS activation by a therapeutic light dose. The light absorption by the PS drives the production of highly reactive oxygen species and radicals that can lead to cell death 7-9. In I-PDT, light is delivered through laser fibers with cylindrical light diffusers (cylindrical diffuser fibers) placed in optically transparent catheters that are percutaneously inserted into the target tumor 9,10. We have recently demonstrated that our image-based finite element method (FEM) can be used to simulate light propagation from cylindrical diffuser fibers inserted into optically transparent catheters11. However, imaged-based treatment planning methods assume precise placement of the catheters 12-14. There is an inherent challenge in guiding catheter insertion according to the treatment plan without intraoperative imaging, because in some cases subcutaneous tumors may not be visible or palpable. The tumor may also be deformed or shifted.
While diagnostic imaging approaches, including computed tomography (CT) or magnetic resonance imaging (MRI), are typically used for the I-PDT pretreatment planning, intraoperative ultrasound can be used for guiding the manual insertion of catheters during I-PDT 12,15. The inherent difference between these imaging modalities and the manual insertion of catheters could lead to discrepancies in the catheters' locations compared to the treatment plan. The catheters' positions may also differ from the plan due to the variation in patient position between the imaging suite and the operating room and the need to change fiber location for the patient's safety (i.e. to avoid critical structures such as large blood vessels). Fiber placements that vary from the treatment plan could impact the light dose administered to the target tumor which in turn could affect the response to I-PDT12-14. Discrepancies in fiber location can also limit the ability to monitor I-PDT treatment, as real time light dosimetry measurements rely on knowing the actual fiber location. Image guided intraoperative CT or MRI systems can be used to monitor and register a catheter's location during I-PDT 4,16. However, these intraoperative systems are typically expensive and are either not available in most hospitals or are limited to few specific rooms within medical facilities. Intraoperative ultrasound can also be used to guide catheter insertions, but rely on identifying reference points in the patient for accurate placement.
Here, we present a new method for guiding the insertion of catheters. This method utilizes clinically available and affordable flexible adhesive grids and CT compatible surface fiducial markers as references for catheter insertion. The accuracy of this method was tested by placing fibers in gel-based phantoms that mimicked the anatomical features of LA-HNSCC. CT imaging was used to test the accuracy of this new method. Our FEM image based treatment planning was utilized to compute light dose volume histograms (DVHs) for the planned and actual location of the cylindrical diffuser fibers.
Material and Methods
Gel Phantoms
Seven phantoms were fabricated to mimic the geometry of LA-HNSCC. In all phantoms, synthetic 10% ballistic gel (Clear Ballistics, Fort Smith, AR) was used to represent the soft tissue surrounding the tumor. The gel has mechanical properties similar to soft tissue (hardness of Shore OO 21.4). In five phantoms (phantom number 1 through 5), clear silicone (GE, Huntersville, North Carolina) and Red RTV silicone (Permatex, Hartford, Connecticut) were utilized to represent the tumor and carotid artery, while Teflon was utilized to fabricate bone-like geometries. The ballistic gel, silicone, and Teflon for these phantoms were set in half a sphere mold.
Two of the seven ballistic gel phantoms (phantom 6 and phantom 7) were fabricated to represent the complex anatomy and shape of a patient with LA-HNSCC. Phantom 6 was produced using the same materials described above (ballistic gel to represent soft tissue, silicone to represent the tumor and carotid artery, and Teflon to represent bone). For this phantom, the ballistic gel, silicone, and Teflon were set using a mold of a human head. In phantom 7, the geometries representing the tumor and other anatomical structures such as the carotid artery and jawbone were constructed from CT scans of a patient with LA-HNSCC who was treated with I-PDT at Roswell Park Cancer Institute (RPCI). The treating physician (HA) marked the boundaries of the tumor and margins and any adjacent critical structures. An image visualization and analysis software package (Simpleware, Exeter, UK) was used to segment the CT scans into geometries representing the tumor, carotid artery, bone, and surrounding tissue. The segmented scans were reconstructed to generate three-dimensional (3-D) models that were converted to computer-aided design (CAD) files for 3-D printing. A rubber-like, translucent material, TangoPlus™, was used for the 3-D printing of the tumor, carotid artery, and cartilage geometries. A rigid opaque photopolymer material, VeroWhite™, was used for the 3-D printing of all bone geometries, which included the skull, jaw, and hyoid bones. The 3-D printed components were set in the ballistic gel using the mold of a human head. Colored dye (Clear Ballistics, Fort Smith, AR) was added to four of the seven phantoms (phantoms 4 - 7) in order to obscure the tumor-like geometries as well as the other anatomical representations. The optical properties of these phantoms did not match the optical properties of tissue. We previously verified the use of our FEM in modeling light propagation in phantoms with optical properties similar to that of human tissue 11,17,18. A summary of the 7 phantoms used in this study is provided in Table 1.
Table 1.
The characteristic of the phantoms utilized in this study.
| Phantom | Shape | Components | Materials for Components | Optically Transparent | Volume of Tumor Shape (cm3) |
|---|---|---|---|---|---|
| 1 | Basic | Tumor | Silicone | Yes | 12.5 |
|
| |||||
| Bone | Teflon | ||||
|
| |||||
| Soft Tissue | Ballistic Gel | ||||
|
| |||||
| 2 | Basic | Tumor, Carotid Artery | Silicone | Yes | 12.5 |
|
| |||||
| Bone | Teflon | ||||
|
| |||||
| Soft Tissue | Ballistic Gel | ||||
|
| |||||
| 3 | Basic | Tumor, Carotid Artery | Silicone | Yes | 21.7 |
|
| |||||
| Bone | Teflon | ||||
|
| |||||
| Soft Tissue | Ballistic Gel | ||||
|
| |||||
| 4 | Basic | Tumor, Carotid Artery | Silicone | No | 39.1 |
|
| |||||
| Bone | Teflon | ||||
|
| |||||
| Soft Tissue | Ballistic Gel | ||||
|
| |||||
| 5 | Basic | Tumor, Carotid Artery | Silicone | No | 32.8 |
|
| |||||
| Bone | Teflon | ||||
|
| |||||
| Soft Tissue | Ballistic | ||||
|
| |||||
| 6 | Complex | Tumor, Carotid Artery | Silicone | No | 59.7 |
|
| |||||
| Bone | Teflon | ||||
|
| |||||
| Soft Tissue | Ballistic Gel | ||||
|
| |||||
| 7 | Complex | Tumor, Carotid Artery, and Cartilage | Tango Plus | No | 26.5 |
|
| |||||
| Skull, Jaw Bone, and Hyoid Bone | VeroWhite | ||||
|
| |||||
| Soft Tissue | Ballistic Gel | ||||
Note: Basic shape refers to the half-a-sphere shape and complex refers to the head and neck mold. For all of the phantoms, ballistic gel was used to represent soft tissue. Also, for phantom 7, the tumor, carotid artery, cartilage, jaw bone, and hyoid bone were all 3-D printed.
Imaging and Treatment Planning
A flexible transparent grid with adhesive capabilities (Opsite Flexigrid, Smith&Nephew, Fort Worth, Texas) was affixed to the surface of each phantom. Each square of the flexible grid is 5 × 5 mm. Three to five 3.0 mm CT compatible surface markers (IZI Medical Products, Owings Mills, Maryland) were placed at the edges or corners of the grid. A CT system (Toshiba, Infinix Biplane Angio Unit, Tustin, CA) was used to image the phantoms with markers and grid. The CT scan resolution was 0.37 mm in both the x- and y- directions and 0.32 mm in the z-direction. The image visualization and analysis software package (Simpleware, Exeter, UK) was utilized to reconstruct 3-D computer models of the phantoms. Each computer model was then imported into Comsol 4.4 (Comsol Inc., Burlington, MA) to develop a treatment plan for I-PDT using our previously developed FEM mathematical model 11. The basic equations and assumptions made in the FEM are described in the mathematical modeling section below. The treatment plan included a map that presents the points and depth of insertion for each cylindrical diffuser fiber, the light dose distribution, and the DVHs for each corresponding phantom.
Catheter and Fiber Placement
The map generated from the treatment planning was used to guide the catheter and fiber placement. The plan assumes that the light is delivered through a 1 mm diameter cylindrical light fiber with a 1 to 5 cm diffuser end that is placed within a closed-end catheter (herein referred as catheter) with an outside diameter of 2 mm and an inner diameter of 1.45 mm (Flexi Needle 14G, Best Medical International Inc., Springfield, VA). The flexible grid and the surface fiducial markers were utilized to find the point of insertion according to the treatment-planning map. The catheters were typically inserted perpendicular to a stationary object, which in this study was a bench top. Therefore, the catheters were inserted as planned, parallel to each other unless otherwise noted (two of the catheters inserted into phantom 7 were angled 30° in reference to the bench top). The planned depth of insertion for each catheter accounted for the curvature of the phantom. Each insertion point was assigned a number that corresponded to a catheter and a cylindrical diffuser fiber with specific diffuser length. The catheters consist of a metal core and optically transparent sheath with a sharp closed end. A scale (with 5 mm ticks) is printed on the sheath and can be utilized to measure the depth of insertion (or z position). In our study, the catheters' planned depth of insertion with 1 mm resolution was accomplished by using an ink marker on the surface of the catheter. The location of the marker was measured with a digital caliper. During the catheter insertion, the sharp plastic sheath with the metal core was pushed against the phantom surface until the ink mark (for depth) was at the surface of the phantom. After insertion, the metal core is removed and a cylindrical light diffuser can be inserted into the optically transparent plastic sheath of the catheter. In this technique, multiple close end catheters are inserted prior to treatment and a few (e.g. 2-4) cylindrical diffusers can be moved from one close end catheter to the other.
The actual location (x, y, z) of the catheters was determined by taking a CT scan of the catheters' plastic sheath in the phantoms and reconstructing these scans as described above. Utilizing the surface markers imaged before and after insertion of the catheters, we aligned the 3-D computer model (showing planned location) with 3-D reconstructed CT images of the actual location of the catheters within the phantoms. The differences between the planned and actual location of each catheter and corresponding cylindrical fiber was calculated by fitting a straight line through the center of each catheter and measuring the average differences in x, y and z to compute the overall displacement in 3-D, as described in equation 4 in the statistical analysis section of this paper.
The light propagation and DVHs were calculated for all phantom models, assuming there are cylindrical light fibers in the planned and actual location, as described in the following section.
Mathematical Model
The mathematical modeling was conducted assuming a therapeutic light of 630nm wavelength is delivered through 1 mm diameter cylindrical light fibers with 1 to 5 cm diffuser end (e.g. RD-ML, Medlight S.A., Ecublens, Switzerland) that are inserted within catheters as described above and in our previous papers 11,19. A detailed description of the mathematical model and basic assumptions are given in Shafirstein et al. and Oakley et al. 11,18. Briefly, in this model, the 3-D time-dependent diffusion equation, derived from the equation for radiative transfer, is given by:
| Eq. 1 |
Where:
| Eq. 2 |
Φ (x, y, z, t) is the photon flux (Pn/m2/s), where Pn is the number of photons, an is the optical diffusion coefficient (m2/s) of tissue n, μa,n and μs,n are the linear absorption and scattering coefficients (1/m) of tissue n, g is the optical anisotropy factor, and cn is the speed of light in tissue n. Light delivered from the cylindrical diffuser fiber is represented by a flux of diffused photons emitted from the inside surface of the catheter and is given by:
| Eq. 3 |
Plaser is the laser irradiance or fluence rate (W/m2), c0 is the speed of light in a vacuum, 3 × 10⁸ m/s, and hp is Planck's constant (6.6260957 × 10⁻³⁴ J·s). v1 is the laser light frequency (1/s) defined as c0 divided by λ (the wavelength of the laser light).
The light propagation throughout each phantom was computed by solving Eq. 1 with the appropriate initial and boundary conditions. The laser settings and optical properties that were employed in the FEM in this study are given in Table 2.
Table 2. Laser and Optical Parameters.
| Laser Parameters | |
|---|---|
| Input Power per Fiber: | 400 mW/cm |
| Treatment Time: | 50:50:6000 sec |
|
| |
| Optical Parameters | |
|
| |
| Free-space Wavelength: | 630 nm |
| Absorption Coefficient: | 20 [1/m] |
| Scattering Coefficient: | 2777 [1/m] |
| Reduced Scattering Coefficient: | 500 [1/m] |
| Tissue Optical Anisotropy Factor, g: | 0.82 |
| Tissue Refractive Index: | 1.37 |
| Optical Diffusion Coefficient: | 1.4×10⁵ m2/s |
In the treatment plan, the number and location of multiple cylindrical diffusers is based on the size of the tumor and expected margins that the surgeon determined for maximum safety and potential efficacy. The spacing between adjacent cylindrical diffusers is between 10 and 15 mm, which are typical for I-PDT with clinically approved PSs 3,20. In Comsol, given the location and number of fibers, we compute the length of the diffuser in each cylindrical fiber and the light dose that is needed to be delivered from each fiber so that a total planned DVH is administered to the tumor and margins (target volume). In this study, the DVHs were for the percent of the target volume that receives greater than 100 J/cm2, which was chosen from clinical experience at RPCI for I-PDT with the FDA approved PS (Photofrin™, Pinnacle Biologics, Chicago, IL) activated with a 630-nm light.
The absolute difference between the planned and actual DVH was defined as: DVHa - DVHp. The DVHa was the DVH computed for the model with the actual location of the cylindrical diffusers whereas the DVHp was the DVH computed for the planned location.
Statistical Analysis
The displacement (differences between planned and actual location) in 3-D space was computed as follows:
| Eq. 4 |
The triples (x, y, z) correspond to the catheters' actual position while the triples (x′,y′,z′) correspond to the planned catheter locations. The results were summarized in terms of means, standard deviations, and the 95% confidence interval for the mean. A general linear model was used to examine mean differences between the catheters' physical location and the treatment plan in terms of the distance values in 3-D space. In addition, the concordance correlation coefficient (CCC) was calculated along with its 95% confidence interval across all phantoms 21. The CCC was used to measure the agreement between the actual and planned locations in the x, y, and z directions, where the values of CCC are within the range of -1 to 1 with a value 1 denoting a perfect agreement and 0 denoting lack of agreement.
Statistical analysis was also applied to determine the relationship between discrepancies in catheter/fiber position and the resulting DVHs. The absolute difference between the actual and planned catheter locations across 120 distinct repeated measures from the DVHs was modeled using a random effects mixed model with a random effect for phantom and fixed effects for the tumor volume, surface area, number of fibers, total laser power, average fluence rate (mW/cm2), average dose (J/cm2), and the average differences in fiber placement in the x-, y-, and z- direction from the original plan. All tests were two-sided and tested at level alpha=0.05 and carried forth using SAS version 9.4 (SAS Institute, Cary, NC).
Results
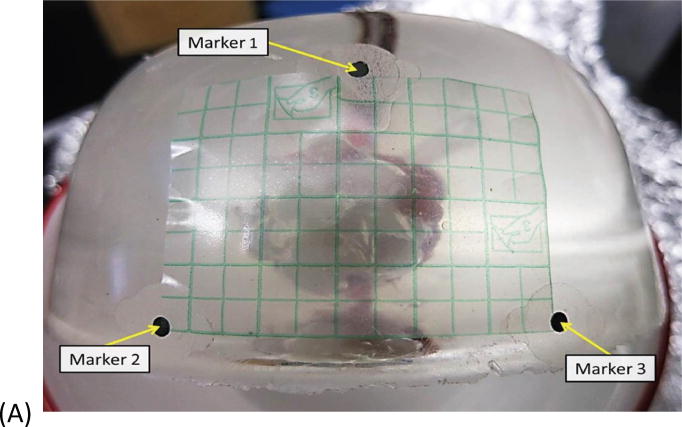
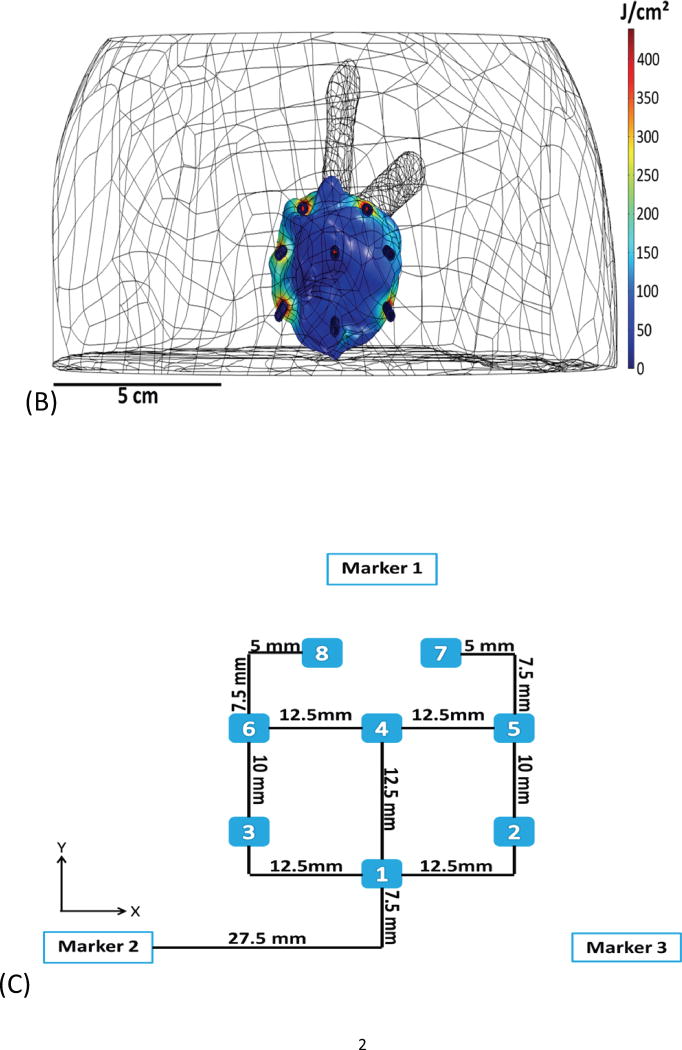
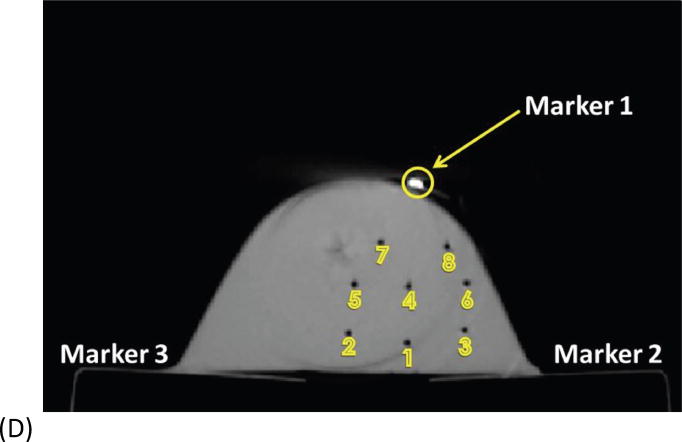
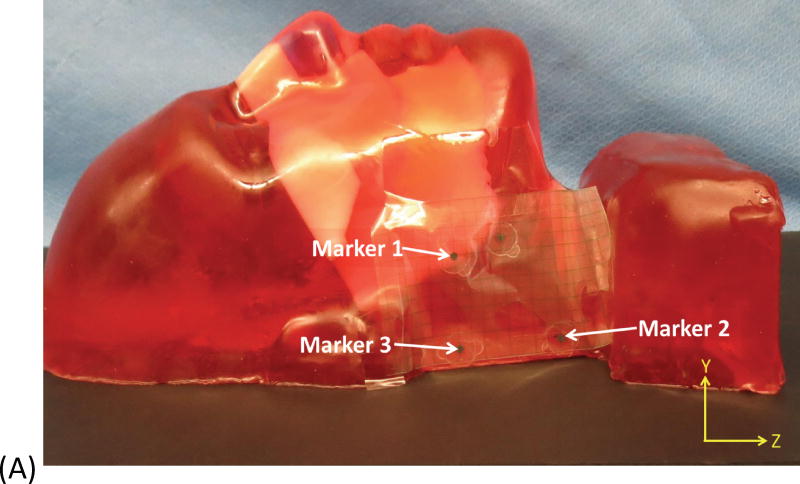
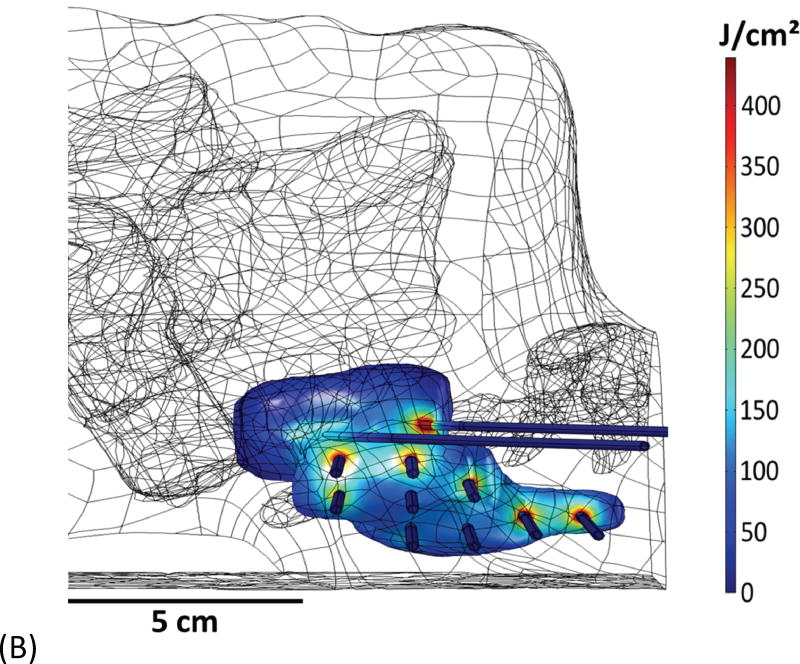
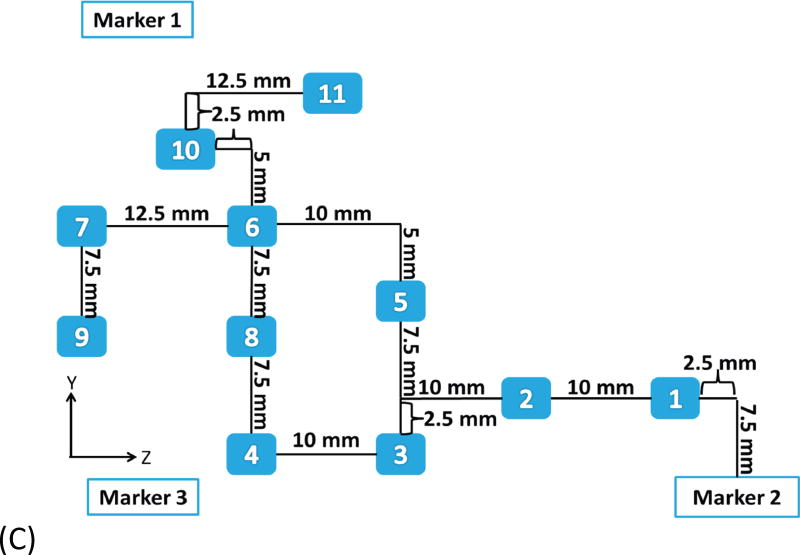
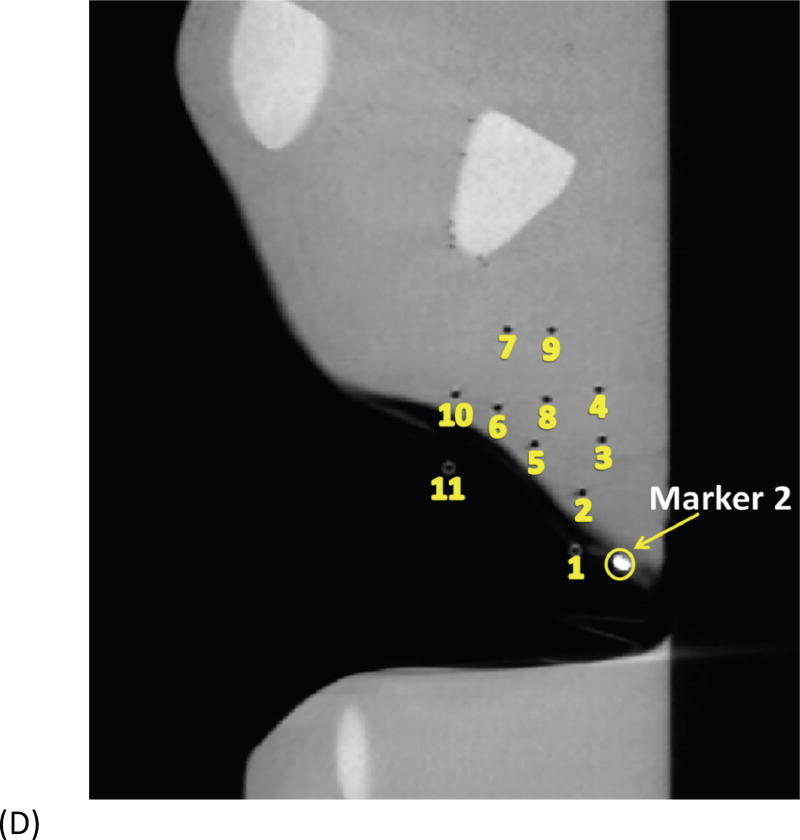
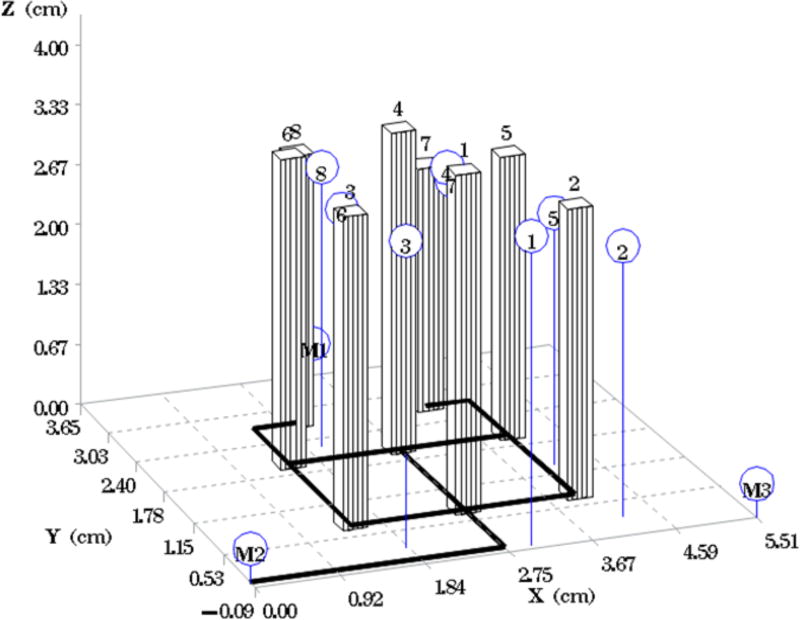
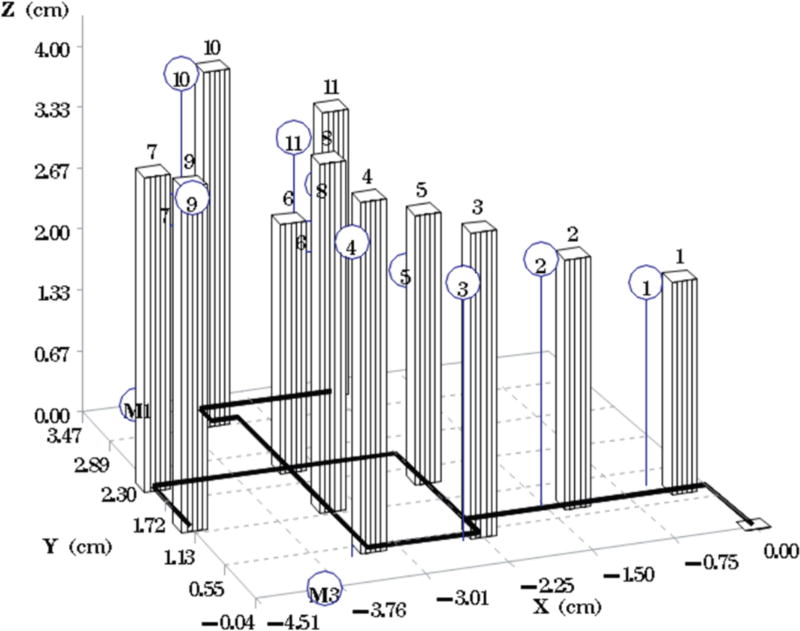
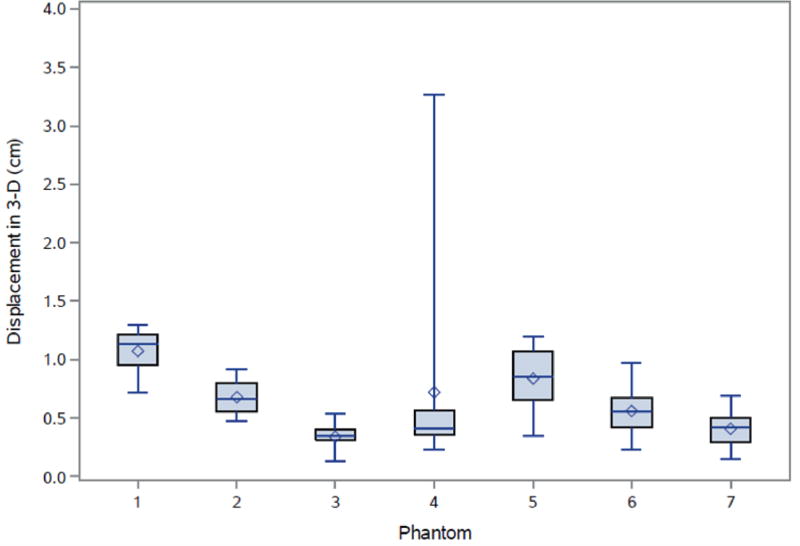
Fig. 1A depicts one of the first five phantoms (phantom 2). Fig. 2A depicts the head and neck phantom (phantom 7), which incorporated the 3-D printed components. Figs. 1B and 2B show the planned light dose (J/cm2) distribution throughout the target volume (i.e. the 3-D representations of a head and neck tumor) that would result if the cylindrical diffusers were placed according to treatment plans (Figs. 1C and 2C). The CT scans taken post-catheter insertion for phantom 2 and phantom 7 are shown in Figs. 1D and 2D. Both the catheters and CT markers are visible in the CT scans and can be differentiated from the surrounding volume. Therefore, one can track the location of the catheters and CT markers throughout each slice of the CT scan. Figs. 3 and 4 depict the difference between the planned and actual catheter locations for phantoms 2 and 7, respectively. Fig. 5 is a box and whisker plot for the displacement computed from Eq. 4 for all seven phantoms. Table 3 provides a summary of the mean 3-D displacement along with the standard deviations and corresponding 95% confidence intervals for the mean of all the fibers in each phantom. There was a statistically significant difference (p = 0.018) between all 7 phantoms in terms of the mean displacement in 3-D. The results from the concordance correlation analysis are given in Table 4. There was a relatively good agreement (with CCC near 1) for 6 out of the 7 phantoms when comparing the planned catheter location to the actual catheter location.
Fig. 1.
Example of basic geometry phantom. (A) The figure depicts the geometry for phantom 2. (B) The figure depicts the intended light dose (J/cm2) for phantom 2 and for a treatment time of 500 seconds. (C) The figure depicts the treatment plan for phantom 2. Note that the origin of the treatment plan starts at Marker 2. (D) The figure depicts the CT scan taken of phantom 2 post catheter insertion.
Fig. 2.
Example of head and neck phantom. (A) The figure depicts the geometry for phantom 7. (B) The figure depicts the intended light dose (J/cm2) for phantom 7 and for a treatment time of 500 seconds. (C) The figure depicts the treatment plan for phantom 7. For this phantom, catheters # 10 and #11 were angled 30° towards marker 1 and the head of the phantom. Note that the origin of the treatment plan starts at Marker 2. (D) The figure depicts the CT scan taken of phantom 7 post catheter insertion.
Fig. 3.
Comparison of the intended versus the actual location of catheters for phantom 2. The bars represent the planned catheter locations with the schematic underneath. The circles (blue) represent the actual placement of the catheters.
Fig. 4.
Comparison of the intended versus the actual location of catheters for phantom 7. The bars represent the planned catheter locations with the schematic underneath. The circles (blue) represent the actual placement of the catheters.
Fig. 5.
Box and whisker plot representing the displacement (cm) in 3D as computed from Eq. 4 for each phantom. The diamonds are the mean displacements (cm) in 3D.
Table 3. Displacement in 3-D.
| Phantom | Number of Fibers | Mean (cm) | Standard Deviation | 95% Confidence Interval (Lower, Upper) |
|---|---|---|---|---|
| 1 | 6 | 1.07 | 0.21 | (0.85, 1.29) |
| 2 | 8 | 0.68 | 0.15 | (0.55, 0.81) |
| 3 | 9 | 0.34 | 0.12 | (0.24, 0.43) |
| 4 | 12 | 0.72 | 0.85 | (0.18, 1.26) |
| 5 | 8 | 0.84 | 0.29 | (0.59, 1.08) |
| 6 | 12 | 0.56 | 0.21 | (0.43, 0.69) |
| 7 | 11 | 0.41 | 0.15 | (0.31, 0.51) |
Table 4. Concordance Correlation Coefficient.
| Phantom | X - coordinate | Y- coordinate | Z - coordinate |
|---|---|---|---|
| 1 | 0.57 | 0.75 | 0.90 |
| 2 | 0.98 | 0.80 | 0.65 |
| 3 | 0.99 | 0.99 | 0.98 |
| 4 | 0.96 | 0.99 | 0.25* |
| 5 | 0.79 | 0.96 | 0.94 |
| 6 | 0.92 | 0.98 | 0.99 |
| 7 | 0.98 | 0.99 | 0.81 |
| Mean | 0.88 | 0.92 | 0.79 |
| 95% Confidence Interval (Lower, Upper) | (0.81, 0.99) | (0.87, 0.99) | (0.60, 0.98) |
Note: The X- and Y- coordinates represent the horizontal and vertical displacement while the Z- coordinate is the depth of displacement of catheter insertion.
This result is not typical. Error in the depth of fiber insertion occurred for 1 out of the 12 catheters placed in this phantom.
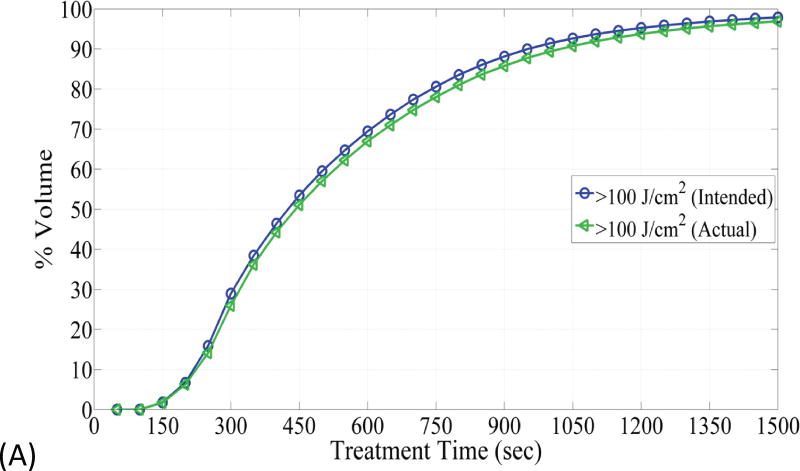
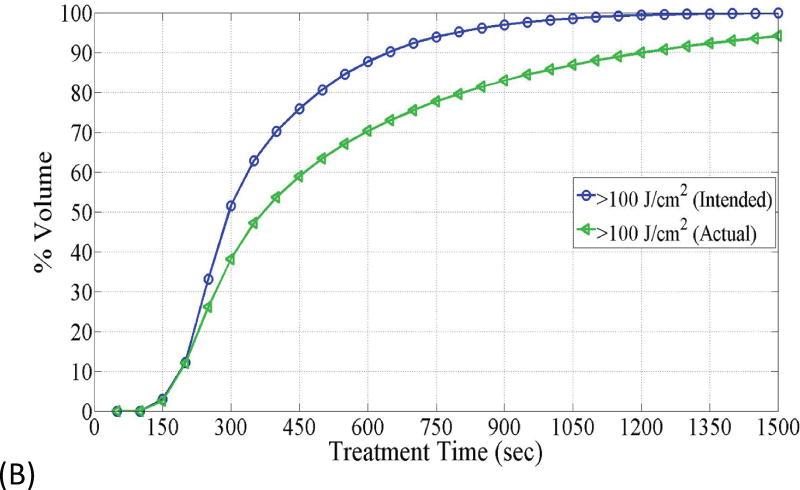
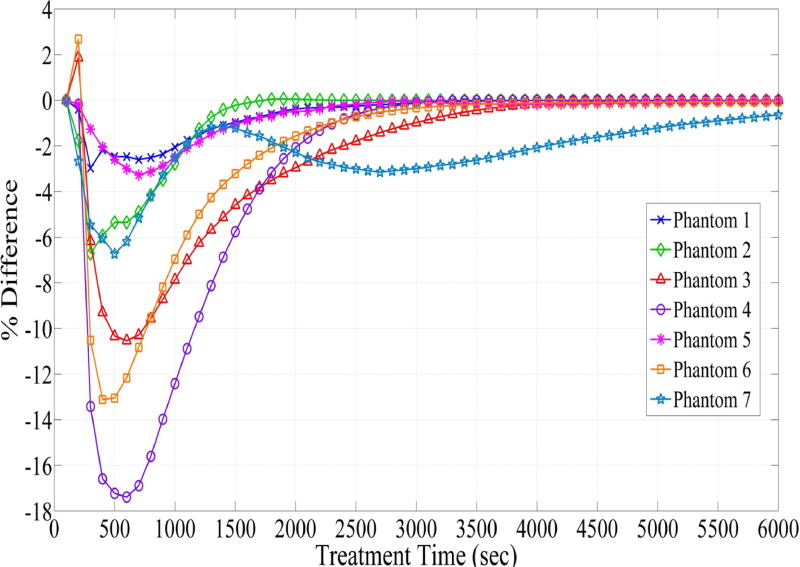
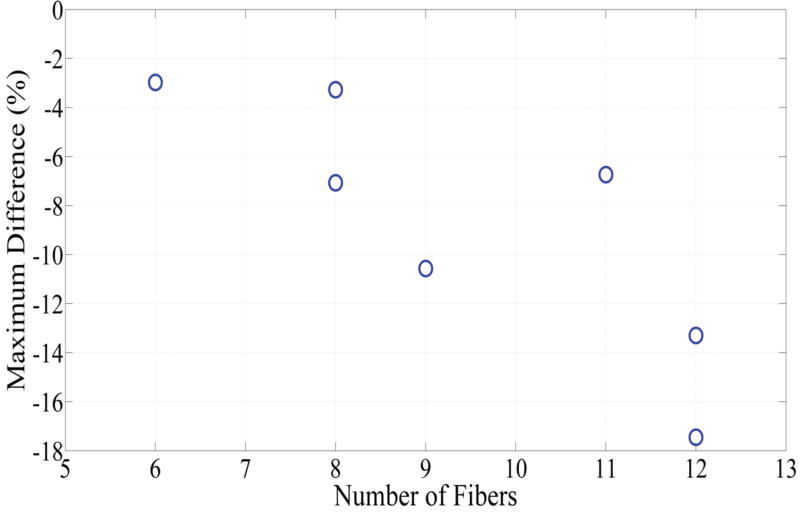
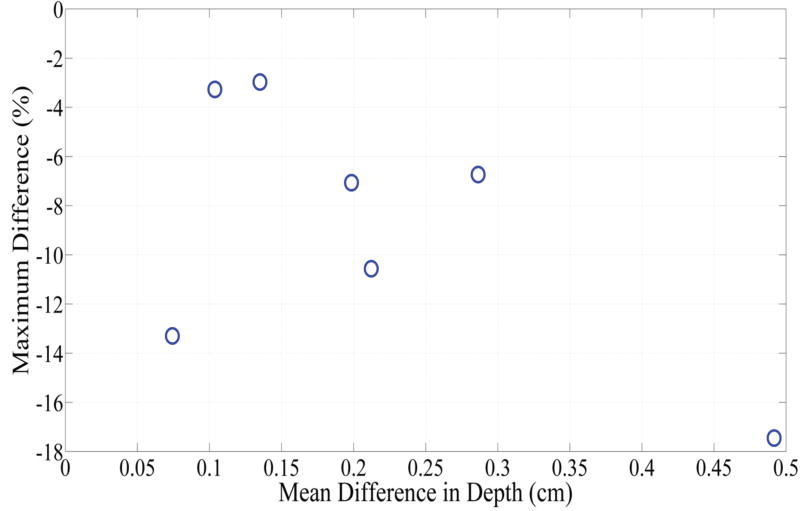
Fig. 6 depicts DVHs as function of treatment time in phantom 1 and phantom 4, which represent the smallest and largest difference between the planned and actual DVHs. The absolute percent difference of DVHs for all seven phantoms is shown in Fig. 7. It can be observed that there exists a specific maximum percent difference for each phantom. The magnitude of the maximum difference was significantly related to the number of fibers (p = 0.0025) and the difference between the planned and actual depth of catheter insertion (p = 0.0027), as shown in Figs 8 and 9, respectively. As the number of fibers and the difference in the depth increased, the maximum difference also increased. However, there was no significant relationship between the mean fiber displacement and the maximum percent difference in DVHs (p = 0.3043).
Fig. 6.
(A) The figure depicts dose volume histogram (DVH) for phantom 1. The DVH represents the phantom with the best correlation to the planned light dose. (B) DVH, for phantom 4, that represents the phantom with the worst correlation to the planned light dose.
Fig. 7.
Difference between the dose volume histogram (DVH) computed from the planned catheter locations and the DVH computed from the actual catheter locations for all 7 phantoms. The figure displays the difference between the percent of the target volume that was planned to receive the prescribed light dose and the percent of the target volume that would actually receive the prescribed light dose. This difference was a function of the treatment time.
Fig. 8.
Comparison between the number of catheters inserted into each phantom and the maximum difference between the intended percent of the target volume and the actual percent of the target volume that would receive > 100 J/cm2.
Fig. 9.
Comparison between the difference between the actual and intended depth of catheter insertion and the maximum difference between the intended percent of the target volume and the actual percent of the target volume that would receive > 100 J/cm2.
Discussion
In a recent study we demonstrated the application of our FEM approach to model light propagation in geometries representing LA-HNSCC. The FEM conducted with COMSOL uses pretreatment CT scans to compute the light dose and DVHs delivered to the clinical target volume when the number and location of the cylindrical fibers (with 1 to 5 cm diffuser length) are known. Any discrepancies in cylindrical diffusers' locations within the clinical target volume can impact the delivered DVH, which could also affect the response to the I-PDT treatment. The presumed locations of the cylindrical diffusers are determined by the locations of the catheters in which these fibers would be inserted. These catheters can be imaged with CT, intraoperatively. In clinical settings, intraoperative CT technology is often not available and is associated with ionizing radiation. However, accurate placement of cylindrical fibers is required. Several groups have adopted the use of a brachytherapy template to guide fiber insertion during I-PDT of prostate cancer 22. The brachytherapy template can constrain the orientation of a catheter such that the catheters can be guided to the target tumor, at fixed parallel distances 23. However, the typical curved and complex anatomy of LA-HNSCC limits the use of these templates to place the catheters during I-PDT.
In this study we present a method using fiducial markers and flexible grid to guide fiber placement for I-PDT, and evaluated the relationship of fibers' location with computed DVHs. CT imaging was utilized as a gold standard imaging modality to determine the actual location of the fibers.
The statistical analysis using the mixed model revealed that there was no significant correlation (p = 0.3043) between the maximum percent difference in DVH and the mean fiber displacements. There was also no evidence suggesting a relationship between the maximum percent difference of DVH and the size of the tumor. Instead, the maximum difference was a function of the number of catheters (p = 0.0025) inserted into the target volume and the difference in the depth of catheter insertion (p = 0.0027). As the number of catheters and the difference between the planned and actual depth increased, the magnitude of the peak difference also increased. These results suggest that as the number of fibers increases, the DVH is more susceptible to errors in fiber placement. Fewer fibers may increase safety as the chance for damaging sensitive structures is reduced. Fewer fibers may also minimize the risk of displacing tumor cells and reduce the risk of significant inflammation associated with I-PDT. However, we do not advocate using fewer cylindrical diffuser fibers during I-PDT. The absolute difference between the actual and planned DVHs is also a function of treatment time (Figs. 6 and 7). It can be assumed that by prolonging the treatment time we can compensate for errors in fiber locations. This is possible because the light dose is basically the number of photons absorbed in the target volume per unit time. Longer treatment time will enable delivery of sufficient photons to the target volume. This is not a practical solution since our computation model estimates that up to 6000 seconds (almost 2 hours) may be required to assure that the planned DVH was delivered using the approved fluence rate (400 mW/cm) per fiber. Increasing the light fluence rate above 400 mW/cm could reduce treatment time, but will induce thermal effects and decrease treatment efficiency due to excessive oxygen consumption24. Inserting more fibers will allow delivering the prescribed light dose to the tumor and margins at a shorter time. Therefore, we advocate either using the minimum number of diffuser fibers required to assure complete irradiation of tumor and margins in a reasonable treatment time, or the maximum number that can be safely inserted into the target volume.
The absolute difference between the planned and actual DVHs may also depend on the optical properties, tumor displacement, and tumor deformation. The optical properties of a tumor vary significantly form one region to another within a tumor and vary among different tumors. These changes are primarily due to variation in blood content and microvascularity that is very difficult to image and account for. To date, it is practically impossible to obtain a map of optical properties that can be incorporated in the simulation of light propagation in tumors. Numerous studies assumed average values of optical properties in computer simulations. In this study, we assumed optical properties of connective tissue. We conducted simulations for higher effective attenuation coefficients (data not shown). The time for a target dose will increase with higher effective attenuation. Therefore, the difference in DVHs (from errors in fibers location) must be calculated for specific optical properties. In another study, we evaluated the impact of tumor deformation on the DVHs 25. Since LAHNC are not likely to deform or shift significantly, we ran simulations to assess the impact of 10% deformation on the DVHs and found that this level of deformation will have minor effects (0.5-3%) on the actual DVH.
Our statistical analysis suggests that there was significant correlation between DVHs and depth of insertion (p=0.0027), but not with the lateral displacement (p = 0.3043). The depth of insertion was defined by caliper measurements while the fiducial markers and grid were used to set the horizontal and vertical placement of catheters. These results suggest that the error associated with the use of the fiducial markers and grid had a minor effect on the resulting light dose. Therefore, one should take extra care in measuring the depth of insertion.
The results from Table 4 demonstrate a strong correlation (CCC close to +1) between the planned and actual catheter locations for all but one phantom. In phantom 4, there was a lack of agreement between the planned and actual depth of one of the catheters (CCC = 0.25). For each of the phantoms except for phantom 4, the displacement in 3-D was within 1.3 cm of the planned location. For phantom 4, one of the catheters was placed +3.3 cm from the planned location while the other 11 catheters (of phantom 4) were placed within 1.3 cm of the planned location. We speculate that the lack of correlation and error in catheter placement for phantom 4 occurred as a result of the inability to efficiently track one catheter out of a total of 12 catheters throughout the entire CT scans. Additionally, this error could be due to inaccurate measurement of the depth of insertion or error in the manual insertion of that particular catheter. Since this error occurred in only one catheter, out of the 66 catheters used in this study, we state that this error is not typical to the method described in this paper.
This approach can be translated into the clinic since the markers and the grid are readily available and approved for use in a clinical setting. We anticipate that the CT markers will be placed on patients prior to their diagnostic CT scan, which can be used for treatment planning. The grid (sterile) can be placed on the skin in a precise location relative to the markers in order to guide the insertion of the catheters and treatment fibers during I-PDT.
We keep in mind that the response to PDT is also related to local PS concentration, tumor oxygenation, blood flow and immune response 26. We focused on the impact of light dose since the treating physician can readily control light dose by adjusting the laser power output, delivering the therapeutic light for longer time, or placing more fibers in the target volume. We will be testing this new image guided method in animal models.
Conclusion
Surface markers and a flexible adhesive grid can be used to guide the placement of catheters into phantoms representing LA-HNSCC. The prescribed DVH is expected to be within 15% of the target provided that the treatment fibers are placed within 1.3 cm of the planned depth of insertion. The number of cylindrical diffusers and treatment time can impact the delivered DVHs.
Acknowledgments
We would like to express our gratitude to Dr. Ciprian Ionita from the University at Buffalo for assisting us in the acquisition of the CT scans for all of the phantoms. We would also like to acknowledge a group of undergraduate students from the University at Buffalo, Alicia Knauf, Andrea Ciolko, Michelle Karker, and John Armstrong, who helped with the fabrication of few of the phantoms used for this study. These students received a grant from the Center for Undergraduate Research and Creative Activities at the University at Buffalo.
E. Oakley received a travel award from the American Society for Laser Medicine and Surgery (ASLMS) to attend and present the concept of the work disclosed in this paper at the 36th Annual Conference of the ASLMS, Boston, MA, March 30 – April 3, 2016. We thank the anonymous reviewers for their constructive criticism.
This work was supported in part by National Cancer Institute of the National Institutes of Health under Award Number R01 CA193610 to G. Shafirstein, by P01CA55791 to S Gollnick, and by Roswell Park Cancer Institute Support Grant P30 CA16056. The content is solely the responsibility of the authors and does not necessarily represent the official views of the National Institutes of Health, Roswell Park Cancer Institute or Johns Hopkins University.
References
- 1.Mendenhall WM, Mendenhall CM, Malyapa RS, Palta JR, Mendenhall NP. Re-irradiation of head and neck carcinoma. Am J Clin Oncol. 2008;31(4):393–398. doi: 10.1097/COC.0b013e3181637398. [DOI] [PubMed] [Google Scholar]
- 2.Zafereo ME, Hanasono MM, Rosenthal DI, et al. The role of salvage surgery in patients with recurrent squamous cell carcinoma of the oropharynx. Cancer. 2009;115(24):5723–5733. doi: 10.1002/cncr.24595. [DOI] [PubMed] [Google Scholar]
- 3.Lou PJ, Jager HR, Jones L, Theodossy T, Bown SG, Hopper C. Interstitial photodynamic therapy as salvage treatment for recurrent head and neck cancer. Br J Cancer. 2004;91(3):441–446. doi: 10.1038/sj.bjc.6601993. [DOI] [PMC free article] [PubMed] [Google Scholar]
- 4.Jager HR, Taylor MN, Theodossy T, Hopper C. MR imaging-guided interstitial photodynamic laser therapy for advanced head and neck tumors. AJNR Am J Neuroradiol. 2005;26(5):1193–1200. [PMC free article] [PubMed] [Google Scholar]
- 5.Jerjes W, Upile T, Hamdoon Z, et al. Photodynamic therapy: The minimally invasive surgical intervention for advanced and/or recurrent tongue base carcinoma. Lasers Surg Med. 2011;43(4):283–292. doi: 10.1002/lsm.21048. [DOI] [PubMed] [Google Scholar]
- 6.Jerjes W, Upile T, Alexander Mosse C, et al. Prospective evaluation of 110 patients following ultrasound-guided photodynamic therapy for deep seated pathologies. Photodiagnosis Photodyn Ther. 2011;8(4):297–306. doi: 10.1016/j.pdpdt.2011.08.002. [DOI] [PubMed] [Google Scholar]
- 7.Henderson BW, Dougherty TJ. How does photodynamic therapy work? Photochem Photobiol. 1992;55(1):145–157. doi: 10.1111/j.1751-1097.1992.tb04222.x. [DOI] [PubMed] [Google Scholar]
- 8.Dougherty TJ, Gomer CJ, Henderson BW, et al. Photodynamic therapy. J Natl Cancer Inst. 1998;90(12):889–905. doi: 10.1093/jnci/90.12.889. [DOI] [PMC free article] [PubMed] [Google Scholar]
- 9.Wilson BC, Patterson MS. The physics, biophysics and technology of photodynamic therapy. Phys Med Biol. 2008;53(9):R61–R109. doi: 10.1088/0031-9155/53/9/R01. [DOI] [PubMed] [Google Scholar]
- 10.Tang S, Chen J, Samant P, Stratton K, Xiang L. Transurethral Photoacoustic Endoscopy for Prostate Cancer: A Simulation Study. IEEE Trans Med Imaging. 2016;35(7):1780–1787. doi: 10.1109/TMI.2016.2528123. [DOI] [PubMed] [Google Scholar]
- 11.Oakley E, Wrazen B, Bellnier DA, Syed Y, Arshad H, Shafirstein G. A new finite element approach for near real-time simulation of light propagation in locally advanced head and neck tumors. Lasers Surg Med. 2015;47(1):60–67. doi: 10.1002/lsm.22313. [DOI] [PMC free article] [PubMed] [Google Scholar]
- 12.Davidson SR, Weersink RA, Haider MA, et al. Treatment planning and dose analysis for interstitial photodynamic therapy of prostate cancer. Phys Med Biol. 2009;54(8):2293–2313. doi: 10.1088/0031-9155/54/8/003. [DOI] [PubMed] [Google Scholar]
- 13.Johansson A, Axelsson J, Andersson-Engels S, Swartling J. Realtime light dosimetry software tools for interstitial photodynamic therapy of the human prostate. Med Phys. 2007;34(11):4309–4321. doi: 10.1118/1.2790585. [DOI] [PubMed] [Google Scholar]
- 14.Altschuler MD, Zhu TC, Li J, Hahn SM. Optimized interstitial PDT prostate treatment planning with the Cimmino feasibility algorithm. Med Phys. 2005;32(12):3524–3536. doi: 10.1118/1.2107047. [DOI] [PMC free article] [PubMed] [Google Scholar]
- 15.Jerjes W, Upile T, Vincent A, et al. Management of deep-seated malformations with photodynamic therapy: a new guiding imaging modality. Lasers Med Sci. 2009;24(5):769–775. doi: 10.1007/s10103-008-0638-z. [DOI] [PubMed] [Google Scholar]
- 16.Robinson DJ, Karakullukcu BM, Kruijt B, et al. Optical Spectroscopy to Guide Photodynamic Therapy of Head and Neck Tumors. IEEE Journal of Selected Topics in Quantum Electronics. 2010;16(4):854–862. [Google Scholar]
- 17.Babilas P, Shafirstein G, Baumler W, et al. Selective photothermolysis of blood vessels following flashlamp-pumped pulsed dye laser irradiation: in vivo results and mathematical modelling are in agreement. J Invest Dermatol. 2005;125(2):343–352. doi: 10.1111/j.0022-202X.2005.23773.x. [DOI] [PubMed] [Google Scholar]
- 18.Shafirstein G, Baumler W, Lapidoth M, Ferguson S, North PE, Waner M. A new mathematical approach to the diffusion approximation theory for selective photothermolysis modeling and its implication in laser treatment of port-wine stains. Lasers Surg Med. 2004;34(4):335–347. doi: 10.1002/lsm.20028. [DOI] [PubMed] [Google Scholar]
- 19.Mimikos C, Shafirstein G, Arshad H. Current state and future of photodynamic therapy for the treatment of head and neck squamous cell carcinoma. World Journal of Otorhinolaryngology-Head and Neck Surgery. 2016;2(2):126–129. doi: 10.1016/j.wjorl.2016.05.011. [DOI] [PMC free article] [PubMed] [Google Scholar]
- 20.Jerjes W, Upile T, Akram S, Hopper C. The surgical palliation of advanced head and neck cancer using photodynamic therapy. Clin Oncol (R Coll Radiol) 2010;22(9):785–791. doi: 10.1016/j.clon.2010.07.001. [DOI] [PubMed] [Google Scholar]
- 21.Lin LI. A concordance correlation coefficient to evaluate reproducibility. Biometrics. 1989;45(1):255–268. [PubMed] [Google Scholar]
- 22.Li J, Altschuler MD, Hahn SM, Zhu TC. Optimization of light source parameters in the photodynamic therapy of heterogeneous prostate. Phys Med Biol. 2008;53(15):4107–4121. doi: 10.1088/0031-9155/53/15/007. [DOI] [PMC free article] [PubMed] [Google Scholar]
- 23.McGill CS, Schwartz JA, Moore JZ, McLaughlin PW, Shih AJ. Precision grid and hand motion for accurate needle insertion in brachytherapy. Med Phys. 2011;38(8):4749–4759. doi: 10.1118/1.3611040. [DOI] [PubMed] [Google Scholar]
- 24.Henderson BW, Busch TM, Snyder JW. Fluence rate as a modulator of PDT mechanisms. Lasers Surg Med. 2006;38(5):489–493. doi: 10.1002/lsm.20327. [DOI] [PubMed] [Google Scholar]
- 25.Han Y, Oakley E, Shafirstein G, Rabin Y, Kara LB. Paper presented at: 14th International Symposium on Computer Methods in Biomechanics and Biomedical Engineering, CMBBE. Tel Aviv, Israel: 2016. Reconstruction of a deformed tumor for treatment planning of interstitial photodynamic therapy: A computational feasibility study. [Google Scholar]
- 26.Agostinis P, Berg K, Cengel KA, et al. Photodynamic therapy of cancer: an update. CA Cancer J Clin. 2011;61(4):250–281. doi: 10.3322/caac.20114. [DOI] [PMC free article] [PubMed] [Google Scholar]


