Abstract
Importance
Improvements in skin appearance resulting from treatment with fractionated picosecond‐lasers have been noted, but optimizing the treatment efficacy depends on a thorough understanding of the specific skin response. The development of non‐invasive laser imaging techniques in conjunction with laser therapy can potentially provide feedback for guidance and optimizing clinical outcome.
Objective
The purpose of this study was to demonstrate the capability of multiphoton microscopy (MPM), a high‐resolution, label‐free imaging technique, to characterize in vivo the skin response to a fractionated non‐ablative picosecond‐laser treatment.
Design, Setting, and Participants
Two areas on the arm of a volunteer were treated with a fractionated picosecond laser at the Dermatology Clinic, UC Irvine. The skin response to treatment was imaged in vivo with a clinical MPM‐based tomograph at 3 hours and 24 hours after treatment and seven additional time points over a 4‐week period.
Main Outcomes and Measures
MPM revealed micro‐injuries present in the epidermis. Pigmented cells were particularly damaged in the process, suggesting that melanin is likely the main absorber for laser induced optical breakdown.
Results
Damaged individual cells were distinguished as early as 3 hours post pico‐laser treatment with the 532 nm wavelength, and 24 hours post‐treatment with both 532 and 1064 nm wavelengths. At later time points, clusters of cellular necrotic debris were imaged across the treated epidermis. After 24 hours of treatment, inflammatory cells were imaged in the proximity of epidermal micro‐injuries. The epidermal injuries were exfoliated over a 4‐week period.
Conclusions and Relevance
This observational and descriptive pilot study demonstrates that in vivo MPM imaging can be used non‐invasively to provide label‐free contrast for describing changes in human skin following a fractionated non‐ablative laser treatment. The results presented in this study represent the groundwork for future longitudinal investigations on an expanded number of subjects to understand the response to treatment in different skin types with different laser parameters, critical factors in optimizing treatment outcome. Lasers Surg. Med. 49:555–562, 2017. © 2017 The Authors. Lasers in Surgery and Medicine Published by Wiley Periodicals, Inc.
Keywords: laser induced optical breakdown, in vivo imaging, noninvasive multiphoton microscopy
INTRODUCTION
There is an increasing interest in, and demand for, effective skin rejuvenation. Treatment with the fractionated non‐ablative picosecond‐lasers has become particularly attractive due to reduced discomfort and limited downtime following the procedure. Fractionated laser treatment is achieved either with two‐dimensional scanning of the focused laser beam, a diffractive microlens array or holographic diffractive beam‐splitter technologies. These optical elements generally fractionate the laser beam into multiple beamlets distributed in a pattern of high‐intensity micro‐regions surrounded by low intensity background, as determined by the optical element pitch. The high‐intensity micro‐regions are thought to promote micro‐injuries within the skin, which may trigger formation of new dermal collagen during the repair process. The outcome of the treatment is closely related to the laser wavelength, pulse duration, and the type of fractionated optic used with the laser. Picosecond laser pulses have been shown to provide sufficient peak power for generating laser induced optical breakdown (LIOB) either in the epidermis 1 or the dermis 2. LIOB is a laser‐matter interaction mechanism that has been described to involve limited residual thermal damage around the micro‐damage areas. This process results in cavitation bubbles in the skin, which have been suggested to expand, disrupt tissue and generate shock waves to further disrupt tissue, and generate repair 3.
Previous studies described the appearance and location in skin of areas of micro‐damage induced by fractionated lasers through the LIOB mechanism. Habbema et al. used a prototype device (Nd:YAG laser, 1064 nm, sub‐nanosecond pulses, 0.15 mJ) to induce micro‐injuries (vacuoles) in the dermis through the LIOB mechanism. The authors described the formation of vacuoles at different locations and time points following treatment and suggested this technique for skin rejuvenation 3. In a recent study, E.A. Tanghetti reported on the occurrence of areas of micro‐damage induced in the epidermis with a fractional 755 nm picosecond laser 1.
The standard method for monitoring the skin response to fractional laser treatments is primarily based on biopsy 1, 2. Advances in optical imaging techniques based on laser scanning microscopy provide a convenient, rapid, and pain‐free method for investigating skin response to treatment. In the aforementioned study by E.A. Tanghetti, the author used routine histology with H&E staining to describe the LIOB microscopic appearances. He also used reflectance confocal microscopy for in vivo imaging of the overall appearance of the laser induced epidermal damages, prior to biopsy. This demonstrated multiple small vacuoles in the grid pattern of the fractional optic 1. A thorough understanding of the skin response to fractionated laser treatment requires the assessment of both overall appearance and location of skin damage, as well as cellular morphologic changes induced by treatment. In this study, we use multiphoton microscopy (MPM) to visualize the changes in cellular structure following skin treatment with a picosecond fractionated laser. MPM is unique among other laser scanning microscopy techniques in that it provides label‐free, sub‐micron resolution images of living tissues in their native environment with contrast from multiple modalities, including second harmonic generation (SHG), and two‐photon excited fluorescence (TPEF), that closely resembles the excised histological sections. The purpose of this pilot study was twofold: (1) to demonstrate the capability of MPM to image in vivo the human skin response to a fractionated non‐ablative laser treatment; and (2) to describe the changes in human skin following this treatment, which involved picosecond pulses, at 532 and 1064 nm, delivered by a fractionated laser, PicoWay Resolve from Candela, recently cleared by FDA for benign dermal and epidermal lesions and tattoos.
MATERIALS AND METHODS
Fractionated Picosecond Treatment Laser (PicoWay)
The treatment was based on a fractionated non‐ablative picosecond Nd:YAG laser (PicoWay Resolve, Candela). This is a dual wavelength laser system delivering 1064 nm, 450 ps pulses with maximum microbeam energy per pulse of 3 mJ and 532 nm, 375 ps pulses with 1.5 mJ maximum microbeam energy per pulse. The PicoWay delivers an array of 100 microbeams per 6 mm × 6 mm area using a holographic diffractive beam‐splitter technology. In this pilot study, we employed the PicoWay laser to treat each of two areas of a volunteer forearm with the different wavelengths provided by the laser, 532 and 1064 nm. We used the maximum energy/pulse available for each wavelength and a single pass treatment.
Multiphoton Microscopy (MPM)‐Based Clinical Tomograph (MPTflex)
MPM is an imaging technique based on laser‐scanning microscopy. In MPM imaging of skin tissue, the contrast mechanisms are based on second harmonic generation (SHG) from collagen fibers and two‐photon excited fluorescence (TPEF) from reduced nicotinamide adenine dinucleotide (NADH), flavin adenine dinucleotide (FAD), keratin, melanin, and elastin fibers. Importantly, these contrast mechanisms rely on the intrinsic optical properties of endogenous tissue biomolecules without using specific fluorescent labels. The nonlinear light‐matter interaction through the aforementioned mechanisms allows MPM to provide 3D sub‐micron resolution images of tissue.
In this study, we used an MPM‐based clinical tomograph (MPTflex, JenLab GmbH, Jena, Germany) for in vivo imaging of the treated skin area. As previously described in other studies where this system has been used 4, 5, this tomograph consists of a compact, turn‐key femtosecond laser (MaiTai Ti:Sappire oscillator, sub–100 fs, 80 MHz, tunable 690–1020 nm; Spectra Physics, Mountain View, CA), an articulated arm with near‐infrared optics, and beam scanning module. The system has two photomultiplier tube (PMT) detectors employed for parallel acquisition of TPEF and SHG signals. A customized metallic ring taped on the subject's skin attaches magnetically to the objective holder in the articulated arm, minimizing motion artifacts. The excitation wavelength used for this study was 790 nm. The TPEF signal was detected over the spectral range of 410–650 nm while the SHG signal was detected over a narrow spectral bandwidth 385–405 nm through emission filters placed in the TPEF and SHG detection channels, respectively. We used a Zeiss objective (40X, 1.3NA, oil immersion) for focusing into the tissue.
Study Design
This observational and descriptive pilot study included one volunteer (skin type II). Two areas on the subject forearm, approximately 1 cm apart from each other, were treated with the PicoWay fractionated laser, each area corresponding to different wavelengths of the treatment laser: 532 and 1064 nm. The skin response to treatment was imaged in vivo at nine time points post‐treatment for a period of 4 weeks: 3 hours, 24 hours, 48 hours, 72 hours, 7 day, 9 day, 11 day, 21 day, and 28 day. All in vivo measurements were conducted according to an approved institutional review board protocol (HS#2008–6307) with written informed consent obtained from the subject.
We used the MPTflex tomograph for in vivo imaging of the treated skin area. For a better understanding and visualization of the changes in human skin following treatment, we acquired the MPM images of the treated areas using two scanning modalities:
(1) xy scanning, which provides images of horizontal optical sections. We obtained z‐stacks of images at different depths by moving the objective in the z direction, thus scanning from the stratum corneum to the superficial dermis. The field of view for each optical section was about 200 × 200 µm2 and the step between optical sections, 5 µm. As the optical section is limited to a small scan field, the overall investigation required the acquisition of several stacks of images at different locations across the treatment area. We acquired about three image stacks for each lesion.
(2) xz scanning, which provides cross‐sectional, “vertical histology‐like” images from the stratum corneum to superficial dermis.
The xy sections were 512 × 512 pixels images acquired at ∼6 seconds/frame. The xz sections were 1024 × 1024 pixels images acquired at ∼30 seconds/frame.
RESULTS
Typical MPM images of normal human skin are shown in Figure 1. The MPM images acquired at different depths (Fig. 1a–d) show normal morphology and distribution of keratinocytes. The pigmented keratinocytes in the basal layer surrounding the dermal papilla (Fig. 1c and d) appear as bright fluorescent cells along the dermal‐epidermal junction due to their melanin content 6. These features can be noted in both en‐face images (Fig. 1a–d) and the corresponding cross‐sectional image (Fig. 1e). In this observational and descriptive pilot study, we imaged in vivo the human skin response to a PicoWay laser treatment at nine time points over a period of 4 weeks from treatment. Two areas on the arm of a volunteer (skin type II) were treated with the PicoWay laser (1064 nm, 3 mJ; 532 nm, 1.5 mJ; 1pass). MPM revealed micro‐injuries present in epidermis. Damaged individual cells were visualized as early as 3 hours post‐treatment with the 532 nm wavelength, and at 24 hours post‐treatment with both, 532 and 1064 nm wavelengths. Pigmented cells were particularly damaged in the process, suggesting that melanin is likely the main absorber and the primary target for LIOB. At later time points, clusters of cellular necrotic debris were imaged across the treated epidermis. The micro‐injuries of the epidermis ranged in size between 90 and 130 µm (mean = 115.8 µm, S.D. = 17.3 µm) for 532 nm and between 45 and 60 µm (mean = 49 µm, S.D. = 10.5 µm) for the 1064 nm treatment.
Figure 1.
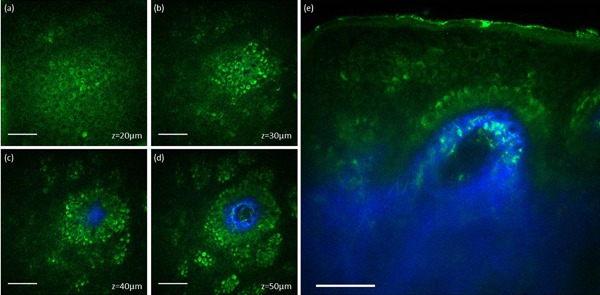
In vivo MPM images of normal human skin. (a–d) En‐face MPM images (XY scans) showing keratinocytes (green fluorescence) and normal pigmented cells (bright green fluorescence) in the epidermis at z = 20 µm (a), z = 30 µm (b), z = 40 µm (c), and z = 50 µm (d). (e) Cross‐sectional view (XZ scan) representing a vertical plane through the same interrogating volume corresponding to the en‐face images on the left. The image shows normal pigmented cells and collagen (blue). Scale bar is 40 µm in all MPM images.
Figure 2 shows representative MPM images acquired from the skin area treated with the 532 nm wavelength at 3 hours post‐treatment. Clusters of damaged and normal individual cells are outlined with white and red contour lines, respectively. Individual damaged cells are also indicated by white arrows (Fig. 2a and c). The damaged cells are distinguished morphologically through their enlarged and irregularly shaped nuclei when compared to the normal cells. The images acquired en‐face (XY scan) at different depths (Fig. 2a–d) and as vertical cross‐section (XZ scan, Fig. 2e) show the targeted cells were pigmented cells located predominantly in the basal and spinosum layers of epidermis. In the MPM images, pigmented keratinocytes are distinguished through the brighter fluorescence signal compared to fluorescence from NADH/FAD and keratin. The epidermal micro‐damages were not discernable in the clinical image of the treated area acquired with a dermatoscope (Fig. 2e).
Figure 2.
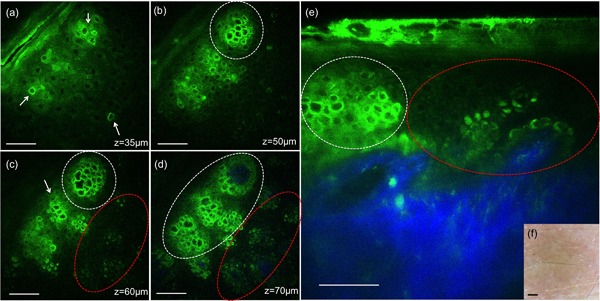
In vivo MPM images of human skin 3 hours post‐treatment, 532 nm. (a–d) En‐face MPM images (XY scans) showing keratinocytes in the epidermis and individual damaged cells (white arrows) at z = 35 µm (a), clusters of individual damaged cells (white contours) at z = 50 µm (b), 60 µm (c), and 70 µm (d). Normal pigmented cells are outlined by red contours (c and d). (e) Cross‐sectional view (XZ scan) representing a vertical plane through the same interrogating volume corresponding to the en‐face images on the left. The image shows damaged individual cells (white contour) and normal pigmented cells (red contour). The inset shows a close‐up of damaged cells (bright green) adjacent to normal cells (dark green). Scale bar is 40 µm in all MPM images. (f) Clinical image (DermLite FOTO, DermLite Inc.). Scale bar is 1 mm.
Figures 3 and 4 show representative MPM images corresponding to 24 hours post‐treatment with 532 and 1064 nm, respectively. Damaged individual cells and clusters of damaged cells are indicated by white arrows in Figures 3 and 4. At this time point, clusters of small cells, probably inflammatory cells (small lymphocytes) could be occasionally distinguished in the proximity of areas including damaged cells. Inflammatory cells are identified morphologically through their size (6–8 µm), location, and scattered arrangement. They are delineated by red contours in Figure 3d and e. The epidermal micro‐damages were clearly discernable as brown spots in the clinical images of the treated areas (Figs. 3 and 4f).
Figure 3.

In vivo MPM images of human skin 24 hours post‐treatment, 532 nm. (a–d) En‐face MPM images (XY scans) showing keratinocytes in the epidermis, clusters of individual damaged cells (white arrows) at z = 25 µm (a), 35 µm (b), 50 µm (c), and likely inflammatory cells (red contour) at z = 105 µm (d). (e) Cross‐sectional view (XZ scan) representing a vertical plane through the same interrogating volume corresponding to the en‐face images on the left. The image shows a cluster of damaged individual cells (white arrows) and likely inflammatory cells in their proximity (red contour). Scale bar is 40 µm in all MPM images. (f) Clinical image (DermLite FOTO, Dermlite Inc.). Scale bar is 1 mm.
Figure 4.
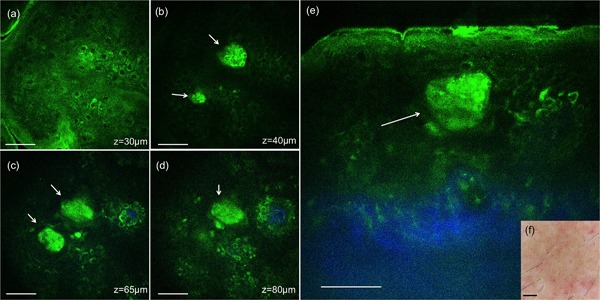
In vivo MPM images of human skin 24 hours post‐treatment, 1064 nm. (a–d) En‐face MPM images (XY scans) showing keratinocytes in the epidermis and clusters of individual damaged cells (white arrows) at z = 30 µm (a), 40 µm (b), 65 µm (c), and z = 80 µm (d). (e) Cross‐sectional view (XZ scan) representing a vertical plane through the same interrogating volume corresponding to the en‐face images on the left. The image shows a cluster of damaged cells (white arrow) in the epidermis. Scale bar is 40 µm in all MPM images. (f) Clinical image (DermLite FOTO, Dermlite Inc.). Scale bar is 1 mm.
At 1 week and later time points, clusters of microscopic epidermal necrotic debris (MEND) as described in previous studies 1, 7, were imaged across the treated epidermis, located mainly in the more superficial regions, beneath the stratum corneum. Representative images acquired at 1 week post‐treatment with 532 and 1064 nm are shown in Figures 5 and 6, respectively. Commonly, the MEND areas appeared as doughnut‐shaped when optically sectioned by MPM (Figs. 5c and d, 6b and c), most likely due to light scattering through the outer layers of these structures. At this time point, inflammation in the proximity of damaged area was still present. It is outlined by red contours in Figure 5d and e. The evolving areas of MEND were prominently distinguished as brown spots in the clinical images of the treated areas (Figs. 5 and 6f).
Figure 5.
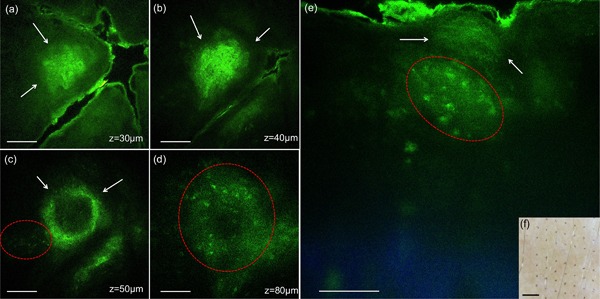
In vivo MPM images of human skin 7 days post‐treatment, 532 nm. (a–d) En‐face MPM images (XY scans) showing clusters of cellular necrotic debris in the epidermis (white arrows) at z = 30 µm (a), 40 µm (b) and 65 µm (c), and inflammatory cells at z = 80 µm (d). (e) Cross‐sectional view (XZ scan) representing a vertical plane through the same interrogating volume corresponding to the en‐face images on the left. The image shows a cluster of cellular necrotic debris (white arrows) in the epidermis and likely inflammatory cells (red contour). Scale bar is 40 µm in all MPM images. (f) Clinical image (DermLite FOTO, Dermlite Inc.). Scale bar is 1 mm.
Figure 6.
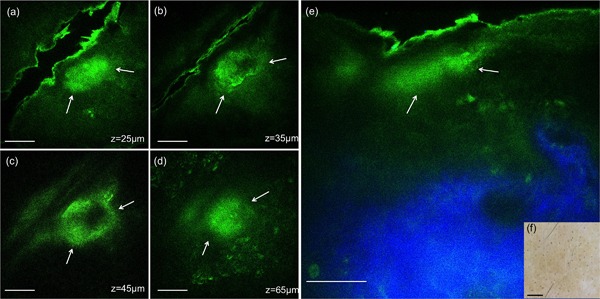
In vivo MPM images of human skin 7 days post‐treatment, 1064 nm. (a–d) En‐face MPM images (XY scans) showing clusters of cellular necrotic debris in the epidermis (white arrows) at z = 25 µm (a), 35 µm (b), 45 µm (c), 65 µm (d). (e) Cross‐sectional view (XZ scan) representing a vertical plane through the same interrogating volume corresponding to the en‐face images on the left. The image shows a cluster of cellular necrotic debris (white arrows) in the epidermis beneath the stratum corneum and normal collagen distribution (blue). Scale bar is 40 µm in all MPM images. (f) Clinical image (DermLite FOTO, Dermlite Inc.). Scale bar is 1 mm.
At later time points, the areas of micro‐injury were reduced in size and density and were completely exfoliated at the end of week 4.
DISCUSSION AND CONCLUSION
In this pilot study, we evaluated the ability of MPM to image in vivo the skin response to a fractionated non‐ablative picosecond laser treatment at 532 and 1064 nm. This was an observational and descriptive study where treatment was performed on the forearm of a volunteer and MPM images of the treated areas were acquired at nine time points post‐treatment for a 4 week period. The MPM was able to identify LIOB micro‐injuries located in the epidermis as soon as 3 hours post‐treatment for 532 nm and 24 hours post‐treatment for 1064 nm. The location of the LIOB micro‐injuries in the epidermis and the melanin being the main target for LIOB are consistent with the findings of E. Tanghetti's study where a 755 nm picosecond laser was used for treatment 1. However, in a previous study using 1064 nm sub‐nanosecond pulses, the micro‐injuries generated by treatment were found to be located in the dermis 2. These differences might be explained by the engineering characteristics of the optical element used to generate the laser micro‐injury pattern. While the fractionated pattern of the treatment laser was achieved through 2‐D scanning of the focused laser beam in the study by Habbema et al. 2, a diffractive microlens array and a holographic beam‐splitter were used for the lasers in the study by Tanghetti 1, and in this work, respectively. Yet, it is noteworthy that both 532 and 1064 nm PicoWay wavelengths generated micro‐injuries in the epidermis only, with the LIOB mechanism being triggered by the laser light absorption of melanin. The damage of individual pigmented cells was clearly visualized by MPM, 3 hours post‐treatment for 532 nm and 24 hours post‐treatment for both 532 and 1064 nm wavelengths. They had the appearance of ruptured cells presenting with enlarged and irregularly shaped nuclei when compared to normal cells in their vicinity. The MPM images acquired at these early time points post‐treatment are exceptional in that they allow a close‐up view of the individual cellular response to fractional laser treatment, a response that was monitored consecutively for a total of 4 weeks.
At 1 week and later time points, microscopic epidermal necrotic debris, MEND, areas, consistent with previous histologic observation 1, 7, were imaged across the treated epidermis, located mainly in the top layers, beneath the stratum corneum. The term MEND was initially used to describe damage associated with non‐ablative fractional resurfacing lasers but it can be applied as well to the damage observed with the fractioned picosecond devices 8. The MEND areas corresponding to 1064 nm were smaller and more regular in shape than the ones generated by the 532 nm treatment. This observation is consistent with the appearance of the brown spots visualized in the clinical images of the two treated sites. The larger size micro‐injuries by 532 nm compared to the 1064 nm laser treatment are most likely related to the higher melanin absorption at 532 nm comparing to 1064 nm 9, 10. After 24 hours and at later time points, inflammatory cells were imaged in the proximity of damaged cells and MEND areas. In Tanghetti's recent study, histological findings indicated mild to moderate lymphocytic perivascular inflammation in the papillary dermis, but not in the epidermis 1.
In this study, we demonstrate the ability of MPM to image in vivo, label‐free and non‐invasively, the skin response to a fractional laser treatment, specifically a fractional laser delivering picosecond pulses of 532 and 1064 nm (PicoWay, Candela, Wayland MA) This imaging modality was able to visualize changes in individual cells and in the overall morphology of the skin as a response to treatment. Although histological data were not available in this work as no biopsy was performed, the results are consistent with prior histologic findings, the standard approach currently used for gaining insights into skin response to fractional laser treatments. These results are valuable for future longitudinal in vivo MPM studies on expanded number of subjects to understand the response to treatment in different skin types at different laser parameters, critical factors in optimizing treatment outcomes. A technical challenge of employing the current MPM‐based clinical device in these types of studies is related to limited field of view and penetration depth. Increasing the scanning area, while maintaining the sub‐micron resolution, would allow imaging individual damaged cells as well as the overall micro‐injury generated‐pattern. Visualization of deeper dermis requires enhanced penetration depth. These technical limitations can be addressed and implemented in future designs 11, 12.
ACKNOWLEDGMENTS
This study was supported in part by the following grants: National Institutes of Health (NIH) NIBIB Laser Microbeam and Medical Program (LAMMP, P41‐EB015890) and by the Beckman Laser Institute programmatic support from the Arnold and Mabel Beckman Foundation. The sponsors had no role in the design and conduct of the study; in the collection, analysis, and interpretation of data; or in the preparation, review, or approval of the manuscript. The device used in this study was provided by Candela at not cost to the institution.
Conflict of Interest Disclosures: All authors have completed and submitted the ICMJE Form for Disclosure of Potential Conflicts of Interest and have disclosed the following: Karsten König is cofounder of JenLab GmbH (Jena, Germany).
[This article was modified on 14 August 2017 after initial online publication in order to update the copyright line.]
REFERENCES
- 1. Tanghetti EA. The histology of skin treated with a picosecond alexandrite laser and a fractional lens array. Lasers Surg Med 2016; 48(7):646–652. [DOI] [PubMed] [Google Scholar]
- 2. Habbema L, Verhagen R, Van Hal R, Liu Y, Varghese B. Minimally invasive non‐thermal laser technology using laser‐induced optical breakdown for skin rejuvenation. J Biophotonics 2012; 5(2):194–199. [DOI] [PMC free article] [PubMed] [Google Scholar]
- 3. Habbema L, Verhagen R, Van Hal R, Liu Y, Varghese B. Efficacy of minimally invasive nonthermal laser‐induced optical breakdown technology for skin rejuvenation. Lasers Med Sci 2013; 28(3):935–940. [DOI] [PMC free article] [PubMed] [Google Scholar]
- 4. Balu M, Kelly KM, Zachary CB, et al. Distinguishing between benign and malignant melanocytic nevi by in vivo multiphoton microscopy. Cancer Res 2014; 74(10):2688–2697. [DOI] [PMC free article] [PubMed] [Google Scholar]
- 5. Balu M, Zachary CB, Harris RM, et al. In vivo multiphoton microscopy of basal cell carcinoma. JAMA dermatology 2015; 151(10):1068–1074. [DOI] [PMC free article] [PubMed] [Google Scholar]
- 6. Breunig HG, Studier H, Konig K. Multiphoton excitation characteristics of cellular fluorophores of human skin in vivo. Opt Express 2010; 18(8):7857–7871. [DOI] [PubMed] [Google Scholar]
- 7. Manstein D, Herron GS, Sink RK, Tanner H, Anderson RR. Fractional photothermolysis: A new concept for cutaneous remodeling using microscopic patterns of thermal injury. Lasers Surg Med 2004; 34(5):426–438. [DOI] [PubMed] [Google Scholar]
- 8. Laubach HJ, Tannous Z, Anderson RR, Manstein D. Skin responses to fractional photothermolysis. Laser Surg Med 2006; 38(2):142–149. [DOI] [PubMed] [Google Scholar]
- 9. Zonios G, Bykowski J, Kollias N. Skin melanin, hemoglobin, and light scattering properties can be quantitatively assessed in vivo using diffuse reflectance spectroscopy. J Invest Dermatol 2001; 117(6):1452–1457. [DOI] [PubMed] [Google Scholar]
- 10. Zonios G, Dimou A, Bassukas I, Galaris D, Tsolakidis A, Kaxiras E. Melanin absorption spectroscopy: New method for noninvasive skin investigation and melanoma detection. J Biomed Opt 2008; 13(1). [DOI] [PubMed] [Google Scholar]
- 11. Balu M, Saytashev I, Hou J, Dantus M, Tromberg BJ. Sub‐40fs, 1060‐nm Yb‐fiber laser enhances penetration depth in nonlinear optical microscopy of human skin. J Biomed Opt 2015; 20(12):120501. [DOI] [PMC free article] [PubMed] [Google Scholar]
- 12. Balu M, Mikami H, Hou J, Potma EO, Tromberg BJ. Rapid mesoscale multiphoton microscopy of human skin. Biomed Opt Express 2016; 7:4375–4387. [DOI] [PMC free article] [PubMed] [Google Scholar]


