

Abstract
Mouth rinsing (MR) with carbohydrate during exercise has been shown to act as an ergogenic aid.
Purpose
To investigate if nutritive or nonnutritive sweetened MR affect exercise performance, and to assess the influence of sweetness intensity on endurance performance during a time-trial (TT).
Methods
This randomized, single blinded study had 4 treatment conditions. 16 subjects (9 men, 7 women) completed a 12.8km TT four different times. During each TT, subjects MR and expectorated a different solution at time 0 and every 12.5% of the TT. The 4 MR solutions were: sucrose (S) (sweet taste and provides energy of 4 kcals/g), a lower intensity sucralose (S1:1) (artificial sweetener that provides no energy but tastes sweet), a higher intensity sucralose (S100:1), and water as control (C). Completion times for each TT, heart rate (HR) and ratings of perceived exertion (RPE) were also recorded.
Results
Completion time for S was faster than C (1:03:47±00:02:17 vs. 1:06:56±00:02:18; p<0.001, respectively), and showed a trend to be faster vs. S100:1 (1:03:47±00:02:17 vs. 1:05:38±00:02:12; p=0.07, respectively). No other TT differences were found. Average HR showed a trend to be higher for S vs. C (p=0.08). There only differences in average or max RPE was for higher max RPE in C vs. S1:1 (p=0.02).
Conclusion
A sweet tasting MR did improve endurance performance compared to water in a significant manner (avg. 4.5% improvement; 3+ min.); however, the presence of energy in the sweet MR appeared necessary since the artificial sweeteners did not improve performance more than water alone.
Introduction
Discovering ways to delay fatigue during exercise has long been a strategy for endurance athletes to enhance performance. Most of the focus remains on peripheral fatigue development in muscle fibers due to limits in oxygen transport or metabolic capacity within the muscle. However, fatigue specifically related to motor unit activity, which is controlled by the central nervous system, is gaining recognition. A more recently used strategy for reducing central fatigue is to rinse the oral cavity with a carbohydrate (CHO) solution while exercising to possibly stimulate reward related areas in the brain involved in improving motor control during exercise as part of a central response in the brain in order to enhance endurance performance1–5. By mouth rinsing (MR) with solutions instead of ingesting them, one is able to look at the impact of solutions in performance or perception of effort independent of substrate delivery.
One of the first studies to examine the effects of a CHO mouth rinse (MR) on exercise showed a 2.9% faster cycling time trial (TT) when subjects MR a maltodextrin solution (contains energy but is flavorless) compared to a flavor matched placebo (artificial sweetener)6. This finding was confirmed in another study with cyclists7. Since then, others have shown improvements in sprint, high intensity exercises performance, or strength with sweetened MR8–11. Exposure to CHO has been associated with a ‘feel good’ sensation, possibly due to the detection of energy content of carbohydrates, while another possible mechanism of action could be related to the sweet taste of the MR solutions. It is known that sweet taste perception can trigger the brain reward system for measures of taste quality as well as an incentive motivational component12. Sweet taste is thought to have evolved to indicate a source of food that is calorically rich13;14. Nearly all previous studies utilizing a CHO MR during exercise performance have used a taste-matched placebo, which doesn’t allow them to isolate the effect that sweet taste itself can affect exercise performance independent of substrate availability.
Therefore, it is not well known how much sweet taste itself, which is associated with increased neural activation in reward related areas of the brain, contributes to the overall ergogenic effect of a sweetened MR since nearly all previous studies have employed a taste matched (sweet taste) control. Only one recent study in male cyclists was done comparing a carbohydrate solution to an unsweetened control15 along with one study looking at walking distance in adults16. Therefore, it is largely unknown whether the intensity of sweet taste, independent of energy content, impacts performance, especially running performance.
Since no previous studies exist that isolated the effects of sweet taste, independent of energy availability, as it relates to MR a solution as an ergogenic aid during running, research in this area is needed. Our study was designed to address that question by using an unsweetened control. Further, research on the ergogenic effects of CHO MR has never been studied during running performance or in women, so we utilized a subject population of both men and women. Finally, in addition to a lack of research using unsweetened controls in order to isolate the effects of sweet taste, independent of energy content, on performance, it is unknown whether the intensity of sweet taste can impact performance. Therefore, the purpose of this study was to examine the ergogenic effects of sweet taste, the intensity of sweet taste, and energy content from different MR on a running TT in endurance trained men and women. We used four different solutions: water (unsweetened control), two sucralose solutions with differing sweetness intensities (no energy since it is an artificial sweetener), and sucrose (energy plus sweet taste). We hypothesized that exercise performance would be enhanced more with sucrose MR vs. either sucralose solution, and that the three sweetened MR would provide an increased ergogenic effect vs. water. We also hypothesized that the higher intensity sucralose solution would improve TT performance over the lower intensity sucralose solution.
Methods
Design
This study was a randomized, single blind crossover design that took place in the Human Nutrition Lab (HNL) and an indoor 400-meter track. All subjects completed four study visits separated by at least 4 days, and each visit took place at the same time of day (between 0600 – 0900 hours). For the visits, subjects performed a 12.8km running TT with the only difference between trials being the different MR solution being administered at each visit in a random order. All procedures were approved by the Institutional Review Board and written informed consent was obtained from each subject prior to starting study procedures.
Subjects
Twelve (12) male and nine (9) female trained endurance athletes were recruited for participation in the study. Inclusion criteria was for individuals who trained in aerobic exercise at least 4 days per week for at least 1 hour per day, between the ages of 18–45, and a BMI between 18.5–24.9kg/m2. Exclusion criteria for the study included changes in current exercise program, a low carbohydrate diet, chronic diseases or medications that could alter metabolic rate or hydration status, nicotine use, pregnancy or nursing, allergy to red food dye FD&C Red No. 40 or sucralose. Women were tested only during the follicular phase of their menstrual cycle (days 3–9) to control for any fluctuation in hormones. Subjects were asked to arrive for each visit following an 8–12 hour fast with no vigorous exercise for 12 hours before, and they were asked to not brush their teeth with toothpaste before arriving.
Methodology - Mouth Rinse Solutions
The four treatments or MR solutions that were used in a random order were: (1) a sucrose solution (S) which was table sugar and contained both a sweet taste and energy (4 kilocalories per gram), (2) a sucralose solution that had a 1:1 ratio of sweetness intensity with sucrose (S1:1), (3) a sucralose solution that was 100:1 ratio of sweetness intensity with sucrose (S100:1), and (4) a water solution (25mL bolus as a control) (C). The S solution consisted of 64g of sucrose dissolved in 1000mL of water, with a bolus of 25mL used for the MR protocol. The S100:1 solution consisted of 10.5g of sucralose powder (American Health Foods and Ingredients, CA) dissolved in 1000mL of water, with a bolus of 25mL used for the MR protocol. This amount of sucralose made the MR 100 times as sweet as sucrose to investigate the effects of sweetness intensity. The S1:1 solution consisted of 0.11g of sucralose powder dissolved in 1000 ml of water, with a bolus of 25 mL used for the MR protocol. This amount of sucralose made the solution have a 1:1 sweetness with sucrose. The concentrations of each solution were determined based on manufacturer recommendations and psychophysical information collected from a panel of subjects. Each MR solution had 2mL of red food dye FD&C Red No. 40 to ensure the same sensory response through appearance.
Protocol
Baseline Testing (Visit 1)
Prior to the first study visit, participants were asked to consume a standard diet (55–60% carbohydrates, 15–20% protein, and 20–25% fat) and keep a dietary log for 24 hours prior to the first visit. They were also asked not to consume alcohol or caffeine during this period. The evening meal consumed prior to visit 1 was repeated exactly before each subsequent visit. Subjects were also asked to keep a training log for 7 days prior to each visit. The participants were then asked to follow the same training as what was reported on their training log between study visits. Analysis of this data (not shown) revealed that the desired macronutrient distribution was achieved (55–60% carbohydrates, 15–20% protein, and 20–25% fat) and no significant differences between trials for either macronutrient distribution of the diet (ns) or for training intensity and volume (ns) were found.
Following an overnight fast, participants reported to the HNL for baseline testing. Height, body weight, body composition, and blood pressure measurements were taken. Body composition measures were done using air displacement plethysmography with the BodPod (Cosmed USA, Inc Concord, CA). Participants then answered questions regarding their current and usual exercise patterns. These questions were used to document the type, frequency, duration, and intensity of exercise.
Following baseline testing participants reported to the indoor track to complete a 12.8km running TT. For the TT, subjects were fitted with a heart rate (HR) monitor. The only instruction the subjects were given was related to the distance of the TT and that they should try to complete the 12.8km TT as quickly as possible. A script was used to ensure that each participant was given the exact same information. Each subject was given 10 minutes to warm up before the TT began. The researchers constantly monitored progress for the TT and completion time was recorded. The participant had no knowledge of their completion time or HR during the TT so as not to influence performance at subsequent visits. The researchers administered the MR solutions during the TT. Subjects were instructed to rinse the solution (25mL) in their mouth, swishing it around for 5 seconds, which was timed and communicated by researchers7. The subjects then expectorated the solution so that none of the solution was swallowed. The amount of expectorated solution was examined by researchers to ensure that none of the solution was swallowed. This rinsing and swishing protocol was incorporated at the following time points: immediately before starting the TT and every 12.5% of the 12.8km TT completed (calculated based on distance covered). The subjects rinsed with the solution a total of 8 times during each TT.
There was no interaction or communication between the subjects and the researcher other than giving the MR every 12.5% of the TT completed and informing the subject of the distance covered and how much distance was left to complete the 12.8km TT. This information was provided during each MR time to keep it consistent between trials. No encouragement or additional communication was provided. Subjects were also asked to rate their perceived exertion (RPE) based on the Borg scale at the beginning, end, and every 12.5% of the TT17. Following the TT, HR data was recorded from the HR watches, which were programmed to record HR at the beginning, end, and every 1-minute during the TT (Polar Electro, Finland).
Statistical Analysis
All analyses were done in R version 3.1.1 (Vienna, Austria). Descriptive statistics including mean, range, standard deviation, standard error, and percent change (difference) from control were calculated for all outcome variables. A two-way repeated measures ANOVA was used to determine if there were significant treatment effects on the TT performance, HR, and RPE for each MR. If a significant treatment or time effect was found, post hoc analyses were done using a Tukey’s test. Statistical significance was set at p<0.05.
Results
Time Trial Completion
Twenty-one subjects (12 males, and 9 females) completed all four exercise visits. Descriptive characteristics can be found in Table 1. The mean age and BMI between men and women were not different; while height, weight, and body fat were all different, as expected. The average completion time for all subjects was 63.47±2.17min for S, 64.55±2.45min for S1:1, 65.38±2.12 min for S100:1, and 66.56±2.18 min for C (Figure 1). There was a main effect of treatment (p=0.03) and time (p=0.04) but no treatment × time interaction (p=ns). The S time trial was completed significantly faster than C (p<0.001), and there was a trend for a faster completion time compared to the S100:1 trial (p=0.07). No other treatment differences were found (Figure 1). When analyzed by sex, as expected, men completed each time trial faster than the women (59.34±3.17 min vs. 69.24±1.26 min for S, 60.14±2.45 min vs. 71.1±3.24 min for S1:1, 60.27±2.34 min vs. 72.34±2.25 min for S100:1, and 61.46±2.41 min vs. 73.5±2.47 min for C, p<0.01 for men vs. women, respectively). However, there were no differences in completion times between solutions when analyzed by sex, so we grouped the sexes together for analysis. Finally, analyzing the TT data based on percent change from control (each subject’s trial of interest – control/control) allowed us to look at the magnitude of difference for each treatment compared to the control trial but to also compare the magnitude of difference vs. control for each of the 3 sweet MR. This analysis revealed that the S TT was significantly faster than S1:1 (−0.045±0.02 vs. −0.022±0.01, p=0.04) and the S100:1 solution (−0.045±0.02 vs. −0.017±0.01, p=0.01) (Figure 2).
Table 1.
Subject Characteristics
| Men (n=12) | Women (n=9) | |
|---|---|---|
| Age (years) | 25.2±6.7 | 24.1±3.0 |
| Height (cm) | 181.3±3.5* | 153.7±2.2 |
| Weight (kg) | 74.7±4.5* | 51.7±2.2 |
| Body Fat % | 10.2±4.1* | 21.1±4.2 |
| BMI (kg/m2) | 21.3±1.2 | 22.0±1.7 |
Data is presented as mean±SD
denotes significant difference between sexes
BMI=Body Mass index
Figure 1.

Performance times for the final 4 stages (last four 12.5% intervals) of the time trial. Bar graph represents the average completion time for all subjects for all solutions. There was a main effect of treatment (p=0.03) and time (p=0.04) but no treatment × time interaction (p=ns). Time trail was completed fasting for S vs. C (p<0.001), and there was a trend for faster time with S vs. S100:1 (p=0.07).
S=sucrose, S1:1=sucralose 1:1, S100:1=sucralose 100:1, and C=control
*denotes significance vs. S at p<0.05
^denotes a trend vs. S at p<0.10
Figure 2.

Percent change in completion time from control (each subject’s trial of interest– control/control) revealed that the S time trial was significantly faster than S1:1 (p=0.04) and the S100:1 solution (p=0.01).
S=sucrose, S1:1=sucralose 1:1, S100:1=sucralose 100:1, and C=control
*denotes significance vs. S at p<0.05
Heart Rate (HR)
The average HR across the TT for each solution is shown in Figure 3. Average HR for S showed a trend for being higher than the C solution (164.4±2.5 vs. 159.7±2.8bpm for S vs. C, respectively, p=0.08). No other treatment differences for average HR were found. Additionally, there were no differences between treatments in max HR or percent change from C (data not shown).
Figure 3.
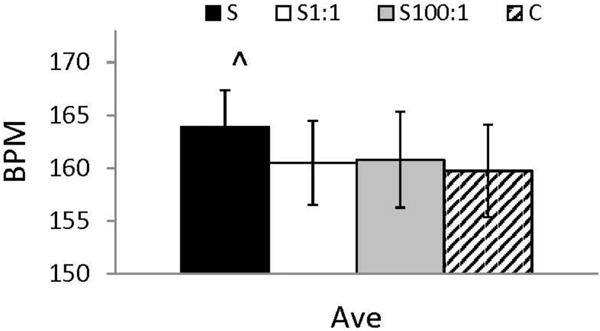
Average HR for all subjects for all solutions (S=sucrose, S1:1=sucralose 1:1, S100:1=sucralose 100:1, and C=control). There was a main effect of treatment (p=0.05). The S solution showed a trend for higher average HR compared to C (p=0.08).
S=sucrose, S1:1=sucralose 1:1, S100:1=sucralose 100:1, and C=control
^denotes a trend vs. C at p<0.10
Ratings of Perceived Exertion (RPE)
Average RPE across the whole TT for each solution is shown in Figure 4. There were no significant main effects for RPE for any solution. Additionally, the max RPE for all subjects can be found in Figure 5. There was a main effect of treatment (p=0.04) for RPE between the solutions. Max RPE was significantly lower for the S1:1 solution vs. control (15.05±0.39 vs. 16.05±0.44, p=0.02) and showed a trend for being lower than S100:1 (15.05±0.39 vs 15.81±0.45, p=0.10). No other treatment differences were found.
Figure 4.

Average rating of perceived exertion (RPE) for all subjects for all solutions. There were no significant differences in RPE shown for any of the solutions.
S=sucrose, S1:1=sucralose 1:1, S100:1=sucralose 100:1, and C=control
^denotes a trend vs. S1:1 at p<0.10
Figure 5.

Maximum rating of perceived exertion (RPE) for all subjects for all solutions. There was a main effect of treatment (p=0.04) for RPE between the solutions. The C time trial had a higher max RPE than S1:1 (p=0.02), and the S100:1 showed a trend for higher max RPE vs. S1:1 (p<0.10).
S=sucrose, S1:1=sucralose 1:1, S100:1=sucralose 100:1, and C=control
*denotes significance vs. S1:1 at p<0.05
^denotes a trend vs. S1:1 at p<0.10
Discussion
The purpose of this study was to investigate the effects of utilizing sweetened MR, which contain differing energy content and sweet taste intensity, on endurance performance as measured in a 12.8km running TT. We found that energy availability in the MR was required for observed improvements in exercise performance and that sweet taste alone was not sufficient to improve performance compared to water. The sucrose solution resulted in a marked decreased performance time, but had no significant effect on HR or RPE. Although the existence of the physiological responses to sweet taste has been shown in the past, the central and peripheral effects of these responses in humans are still not fully understood. The results of this study indicate that carbohydrate MR is an effective strategy for improving exercise performance; but the presence of energy content seems to be the key mechanism possibly due to associations with reward-value driven processes in the brain or some other factors yet to be determined2;3.
One of our correct hypotheses was that sucrose MR (sweet taste plus energy) did improve TT performance compared to water alone. We were, however, somewhat surprised by the magnitude of that difference. The average completion time for the S trial was approximately 4.5% faster than the C trial. This equated to a little over 3 minutes faster on average for S vs. C. This difference is slightly higher than the 2–3% fasting cycling TT performances that has been reported previously6;7; however, the use of taste-matched placebos in those studies compared to an unsweetened control in ours could explain why we saw larger differences. Stated differently, if sweet taste plays even a small role, we would expect that our results with sucrose vs. an unsweetened control would enhance the magnitude of difference between treatments. This is supported by the results from Sinclair et al15 which was the only other previous study looking at endurance performance using water as the control. Over a 30-minute TT, they found that cycling distance in men was approximately 5% further with the carbohydrate solution compared to water which is similar to our results in male and female runners.
It would stand to reason that if TT completion was over 3 minutes faster during the S trial, RPE and/or HR differences would exist. In other words, a potential cephalic phase response from the S solution that may trigger reward centers in the brain would allow the athlete to work harder. We did, in fact, see a trend for higher HR during the S vs. C trials. Therefore, the athletes were possibly working harder during this TT (which resulted in a faster finish). What is interesting, however, is that the average RPE was not higher during the S trial. In fact, there was a trend for higher RPE during the C trial compared to the S1:1 trial. Thus, the athletes MR the sucrose solution were able to run faster but it did not feel any more difficult than any of the other trials based on the lack of significant differences between S vs. all other treatments for RPE. Further research into the exact mechanisms resulting in this effect, possibly through the use of fMRI, is warranted.
We looked at the intensity of sweet taste in our study, which had not been done previously with regard to endurance performance. We had included this as one of our aims because the potential of intensity of sweet taste to influence exercise performance results from an innate hypersensitivity to sweet taste and in most mammals, including humans, sweet receptors evolved in ancestral environments with reduced sugar availability and therefore mammals were not adapted to products containing such high amounts of sugar18;19. When taste receptors come in contact with substances that produce a greater sensory response than would normally be expected, the brain reward signal is also increased. This observation is paralleled with the capacity to override mechanisms related to self-control and motivation20–22. In the case of central fatigue during exercise, the intensity of sweet taste could signal an incoming source of energy in a time when the metabolic processes are especially vulnerable. However, as shown here, energy content does seem to be the most important impact factor for effective utilization of MR to improve exercise measures and intensity did not seem to impact running performance. It is still possible that intensity could play a role in affecting exercise performance, but it needs to be studied in conjunction with the presence of energy content.
It is known that sweet taste perception can trigger the brain reward system for measures of taste quality as well as an incentive motivational component13;20;21;23–27. Sucrose, which contains energy and sweet taste, has been shown to activate taste recognition and reward related regions of the brain differently than sucralose, which contains only sweet taste28. Neural communication dedicated to relaying information for the nutritive value of food separate from the sweet taste of food may have evolved as a separate part of a homeostatic system that responds to the consumption of highly nutritive foods or when rates of fuel depletion are rapid or when fuel reserves are limited. The sensory system is most likely responsible for the detection of energy dense nutrients which can encode sweet taste separately from nutritive value. It has been previously shown that activation of taste recognition areas of the brain as well as processing of reward value are more intense when in a fasted vs. a fed state. This is potentially why we observed these effects during exercise while a change in energy status was occurring that favored catabolism over anabolism.
Limitations and future direction
Although there were aspects of this study that had never been done before, there are certain limitations to our study. The biggest limitation is that we employed a single blinded study design while previous studies have often employed a double blinded design. Although this is a limitation of our study, the research team did not communicate any different information to the participants for any trial. We also only tested running TT performance, so whether similar results would be found for other endurance events (triathlon, swimming) or other types of exercise such as higher intensity, intermittent exercise, remains to be seen. We did not have a treatment condition that incorporated a MR with energy, but no sweet taste (such as maltodextrin). This additional treatment would be able to shed more lights on the effect of sweet taste alone given similar energy contents between groups. However, others have previously compared maltodextrin MR to a sugar MR (sucrose or glucose) and found differences between groups6;7. Therefore, there is the possibility for a synergistic effect between sweet taste and energy content in a MR. Finally, in this study, we were unable to look at potential mechanisms behind our treatment differences or lack of impact of sweetness intensity. Future studies are needed to explore these potential mechanisms to better understand how they are affecting physical performance and which combination between energy content, sweet taste, and sweetness intensity would yield the best performance results.
Practical Applications
From a practical standpoint, this effect of sucrose MR could have huge performance implications. The duration of this TT was 12.8km (or a little less than 8 miles) and was finished in just over 1 hour on average. For athletes competing at races of a similar distance (10Km, 15Km, sprint triathlon, etc.) a 3 minute faster completion time could mean the difference between finishing first or in the middle of the pack. For example, in the 2015 world cross country championships, the top 3 places in the men’s 12Km senior race were separated by 14 seconds and the top 3 senior women in the 8Km race were separated by just 10 seconds29. Our study shows that MR with a sweet solution that also contains energy can lead to substantial performance gains over relatively short distance races. It is less likely that this effect would be as pronounced, or even exist, in longer duration races when glycogen depletion actually occurs and ingestion of carbohydrates becomes crucial.
Conclusion
The findings of this study show that mouth rinsing sweet tasting solutions was shown to be associated with improvements in physical performance in men and women compared to an unsweetened control but only when energy content was also present. Further, without the presence of energy, there was no effect of the intensity of sweetness on endurance performance. These results highlight the hypothesis that there is a possible neural mechanism committed to detecting energy value separately from sweet taste and that this may be impacting physical performance outcomes.
Acknowledgments
We would like to thank the other members of the Human Nutrition Lab for their assistance with this study.
References
- 1.Turner CE, Byblow WD, Stinear CM, Gant N. Carbohydrate in the mouth enhances activation of brain circuitry involved in motor performance and sensory perception. Appetite. 2014;80:212–219. doi: 10.1016/j.appet.2014.05.020. [DOI] [PubMed] [Google Scholar]
- 2.Coyle EF. Carbohydrate supplementation during exercise. J Nutr. 1992;122:788–795. doi: 10.1093/jn/122.suppl_3.788. [DOI] [PubMed] [Google Scholar]
- 3.Coyle EF, Coggan AR, Hemmert MK, Ivy JL. Muscle glycogen utilization during prolonged strenuous exercise when fed carbohydrate. J Appl Physiol. 1986;61:165–172. doi: 10.1152/jappl.1986.61.1.165. [DOI] [PubMed] [Google Scholar]
- 4.Jeukendrup AE, Chambers ES. Oral carbohydrate sensing and exercise performance. Curr Opin Clin Nutr Metab Care. 2010;13:447–451. doi: 10.1097/MCO.0b013e328339de83. [DOI] [PubMed] [Google Scholar]
- 5.Chambers ES, Bridge MW, Jones DA. Carbohydrate sensing in the human mouth: effects on exercise performance and brain activity. J Physiol. 2009;587:1779–1794. doi: 10.1113/jphysiol.2008.164285. [DOI] [PMC free article] [PubMed] [Google Scholar]
- 6.Carter JM, Jeukendrup AE, Jones DA. The effect of carbohydrate mouth rinse on 1-h cycle time trial performance. Med Sci Sports Exerc. 2004;36:2107–2111. doi: 10.1249/01.mss.0000147585.65709.6f. [DOI] [PubMed] [Google Scholar]
- 7.Pottier A, Bouckaert J, Gilis W, Roels T, Derave W. Mouth rinse but not ingestion of a carbohydrate solution improves 1-h cycle time trial performance. Scand J Med Sci Sports. 2010;20:105–111. doi: 10.1111/j.1600-0838.2008.00868.x. [DOI] [PubMed] [Google Scholar]
- 8.Chong E, Guelfi KJ, Fournier PA. Effect of a carbohydrate mouth rinse on maximal sprint performance in competitive male cyclists. J Sci Med Sport. 2011;14:162–167. doi: 10.1016/j.jsams.2010.08.003. [DOI] [PubMed] [Google Scholar]
- 9.Chong E, Guelfi KJ, Fournier PA. Combined glucose ingestion and mouth rinsing improves sprint cycling performance. Int J Sport Nutr Exerc Metab. 2014;24:605–612. doi: 10.1123/ijsnem.2013-0097. [DOI] [PubMed] [Google Scholar]
- 10.Dorling JL, Earnest CP. Effect of carbohydrate mouth rinsing on multiple sprint performance. J Int Soc Sports Nutr. 2013;10:41. doi: 10.1186/1550-2783-10-41. [DOI] [PMC free article] [PubMed] [Google Scholar]
- 11.Painelli VS, Roschel H, Gualano B, et al. The effect of carbohydrate mouth rinse on maximal strength and strength endurance. Eur J Appl Physiol. 2011;111:2381–2386. doi: 10.1007/s00421-011-1865-8. [DOI] [PubMed] [Google Scholar]
- 12.McCaughey SA. The taste of sugars. Neurosci Biobehav Rev. 2008;32:1024–1043. doi: 10.1016/j.neubiorev.2008.04.002. [DOI] [PMC free article] [PubMed] [Google Scholar]
- 13.Bartoshuk LM, Duffy VB, Hayes JE, Moskowitz HR, Snyder DJ. Psychophysics of sweet and fat perception in obesity: problems, solutions and new perspectives. Philos Trans R Soc Lond B Biol Sci. 2006;361:1137–1148. doi: 10.1098/rstb.2006.1853. [DOI] [PMC free article] [PubMed] [Google Scholar]
- 14.Drewnowski A, Mennella JA, Johnson SL, Bellisle F. Sweetness and food preference. J Nutr. 2012;142:1142S–1148S. doi: 10.3945/jn.111.149575. [DOI] [PMC free article] [PubMed] [Google Scholar]
- 15.Sinclair J, Bottoms L, Flynn C, et al. The effect of different durations of carbohydrate mouth rinse on cycling performance. Eur J Sport Sci. 2014;14:259–264. doi: 10.1080/17461391.2013.785599. [DOI] [PubMed] [Google Scholar]
- 16.Deighton K, Duckworth L, Matu J, et al. Mouth rinsing with a sweet solution increases energy expenditure and decreases appetite during 60 minutes of self-regulated walking exercise. Applied Physiology, Nutrition, and Metabolism. doi: 10.1139/apnm-2016-0344. In press. [DOI] [PubMed] [Google Scholar]
- 17.Borg GA. Psychophysical bases of perceived exertion. Med Sci Sports Exerc. 1982;14:377–381. [PubMed] [Google Scholar]
- 18.Small DM. Taste representation in the human insula. Brain Struct Funct. 2010;214:551–561. doi: 10.1007/s00429-010-0266-9. [DOI] [PubMed] [Google Scholar]
- 19.Berthoud HR. Interactions between the “cognitive” and “metabolic” brain in the control of food intake. Physiol Behav. 2007;91:486–498. doi: 10.1016/j.physbeh.2006.12.016. [DOI] [PubMed] [Google Scholar]
- 20.Berthoud HR. Metabolic and hedonic drives in the neural control of appetite: who is the boss? Curr Opin Neurobiol. 2011;21:888–896. doi: 10.1016/j.conb.2011.09.004. [DOI] [PMC free article] [PubMed] [Google Scholar]
- 21.Berthoud HR. Neural control of appetite: cross-talk between homeostatic and non-homeostatic systems. Appetite. 2004;43:315–317. doi: 10.1016/j.appet.2004.04.009. [DOI] [PubMed] [Google Scholar]
- 22.Berthoud HR. Homeostatic and non-homeostatic pathways involved in the control of food intake and energy balance. Obesity (Silver Spring) 2006;14(Suppl 5):197S–200S. doi: 10.1038/oby.2006.308. [DOI] [PubMed] [Google Scholar]
- 23.Connolly L, Coveleskie K, Kilpatrick LA, et al. Differences in brain responses between lean and obese women to a sweetened drink. Neurogastroenterol Motil. 2013 doi: 10.1111/nmo.12125. [DOI] [PMC free article] [PubMed] [Google Scholar]
- 24.Yang Q. Gain weight by “going diet? ” Artificial sweeteners and the neurobiology of sugar cravings: Neuroscience 2010. Yale J Biol Med. 2010;83:101–108. [PMC free article] [PubMed] [Google Scholar]
- 25.Berthoud HR. Brain, appetite and obesity. Physiol Behav. 2005;85:1–2. doi: 10.1016/j.physbeh.2005.04.006. [DOI] [PubMed] [Google Scholar]
- 26.Lenard NR, Berthoud HR. Central and peripheral regulation of food intake and physical activity: pathways and genes. Obesity (Silver Spring) 2008;16(Suppl 3):S11–S22. doi: 10.1038/oby.2008.511. [DOI] [PMC free article] [PubMed] [Google Scholar]
- 27.Zheng H, Berthoud HR. Neural systems controlling the drive to eat: mind versus metabolism. Physiology (Bethesda) 2008;23:75–83. doi: 10.1152/physiol.00047.2007. [DOI] [PubMed] [Google Scholar]
- 28.Frank GK, Oberndorfer TA, Simmons AN, et al. Sucrose activates human taste pathways differently from artificial sweetener. Neuroimage. 2008;39:1559–1569. doi: 10.1016/j.neuroimage.2007.10.061. [DOI] [PubMed] [Google Scholar]
- 29.International Association of Athletics Federations-IAAF. IAAF World Cross Country Championships. 2015 [Google Scholar]