

Abstract
Background and Purpose
Activators of Kv11.1 (hERG) channels have potential utility in the treatment of acquired and congenital long QT (LQT) syndrome. Here, we describe a new hERG channel activator, 5‐(((1H–indazol‐5‐yl)oxy)methyl)‐N‐(4‐(trifluoromethoxy)phenyl)pyrimidin‐2‐amine (ITP‐2), with a chemical structure distinct from previously reported compounds.
Experimental Approach
Conventional electrophysiological methods were used to assess the effects of ITP‐2 on hERG1a and hERG1a/1b channels expressed heterologously in HEK‐293 cells.
Key Results
ITP‐2 selectively increased test pulse currents (EC50 1.0 μM) and decreased tail currents. ITP‐2 activated hERG1a homomeric channels primarily by causing large depolarizing shifts in the midpoint of voltage‐dependent inactivation and hyperpolarizing shifts in the voltage‐dependence of activation. In addition, ITP‐2 slowed rates of inactivation and made recovery from inactivation faster. hERG1a/1b heteromeric channels showed reduced sensitivity to ITP‐2 and their inactivation properties were differentially modulated. Effects on midpoint of voltage‐dependent inactivation and rates of inactivation were less pronounced for hERG1a/1b channels. Effects on voltage‐dependent activation and activation kinetics were not different from hERG1a channels. Interestingly, hERG1b channels were inhibited by ITP‐2. Inactivation‐impairing mutations abolished activation by ITP‐2 and led to inhibition of hERG channels. ITP‐2 exerted agonistic effect from extracellular side of the membrane and could activate one of the arrhythmia‐associated trafficking‐deficient LQT2 mutants.
Conclusions and Implications
ITP‐2 may serve as another novel lead molecule for designing robust activators of hERG channels. hERG1a/1b gating kinetics were differentially modulated by ITP‐2 leading to altered sensitivity. ITP‐2 is capable of activating an LQT2 mutant and may be potentially useful in the development of LQT2 therapeutics.
Abbreviations
- hERG
human ether‐a‐go‐go‐related gene
- LQT1
long QT syndrome type 1
- LQT2
long QT syndrome type 2
Introduction
The voltage activated K+ channel Kv11.1 (hERG) carries the delayed rectifier K+ current (IKr) in cardiac tissue and plays a critical role in the contraction of the human heart, contributing to phase 3 repolarization of cardiac action potentials (Sanguinetti et al., 1995; Trudeau et al., 1995). hERG channel dysfunction is associated with the long QT syndrome (LQTS), characterized by prolonged ventricular action potential and increased risk of developing life‐threatening arrhythmias, torsades de pointes. Genetic mutations leading to loss of hERG channel function result in type 2 congenital LQTS (Curran et al., 1995). Similarly, unintended blockade of hERG by medications cause acquired LQTS, a far more significant clinical problem with limited treatment options. It is proposed that hERG agonists could have therapeutic potential in treating congenital and acquired LQTS (Zhou et al., 2005; Diness et al., 2008; Potet et al., 2012; Zhang et al., 2012). Drugs that increase hERG1a channel currents shorten the action potential duration in ventricular myocytes, QT interval and prevent arrhythmias induced by cardiac delayed repolarization (Zhou et al., 2005; Diness et al., 2008; Gerlach et al., 2010; Meng et al., 2013). Further, a hERG channel activator normalized the action potential duration prolonged by dysfunctional KCNQ1 channels in iPSC‐derived cardiac myocytes from a patient with LQT1 (Zhang et al., 2012).
So far, 12 hERG channel activators have been reported (Kang et al., 2005; Zhou et al., 2005; Casis et al., 2006; Zeng et al., 2006; Hansen et al., 2006a,b; Gordon et al., 2008; Su et al., 2009; Gerlach et al., 2010; Gessner et al., 2010; Potet et al., 2012; Zhang et al., 2012; Mannikko et al., 2015). Except for mallotoxin, which is a naturally occurring substance, all the others are synthetic small molecules. These chemical agents were shown to increase hERG channel currents by different mechanisms. Three primary mechanisms have been proposed: (i) slowing the channel deactivation; (ii) depolarizing the voltage‐dependence of inactivation; and (iii) hyperpolarizing the voltage‐dependence of activation, or a combination of the above mechanisms. In addition, changes in activation/ inactivation kinetics have been reported, which are activator‐specific.
Given the therapeutic potential of hERG channel activators in treating LQTS, it is important to identify novel compounds that activate hERG channels and to characterize their mechanism of action. Furthermore, it is important to evaluate these compounds on heteromeric hERG1a/1b channels as increasing evidence suggests that native IKr channels are heteromers arising from co‐assembly of hERG1a with 1b subunits (Jones et al., 2004; Sale et al., 2008; McPate et al., 2009; Larsen and Olesen, 2010; Jones et al., 2014). These two subunits readily form heteromeric channels in heterologous systems with gating properties and pharmacology distinct from homomeric hERG1a channels (London et al., 1997; Larsen et al., 2008; Sale et al., 2008). Indeed, previous studies have shown differential sensitivity of hERG1a/1b channels to drugs, influencing cardiac safety margins (Sale et al., 2008; Abi‐Gerges et al., 2011).
Here, we report the characterization of 5‐(((1H–indazol‐5‐yl)oxy)methyl)‐N‐(4‐(trifluoromethoxy)phenyl)pyrimidin‐2‐amine (ITP‐2), a novel hERG channel activator that exerted differential effects on hERG channels depending on the subunit composition. ITP‐2 has a distinct chemical structure, hence, may serve as another novel lead for the development of more potent hERG channel activators and this study further demonstrates differential modulation of hERG1a/1b channels leading to altered sensitivity.
Methods
Molecular biology
hERG1b was cloned using hERG1a as template and the unique 106 bp were added to the 5′ region by the PCR method. Three forward primers were designed to incorporate a Hind III restriction site, KOZAK sequence and 106 bp to get the full length hERG1b sequence. Primers used were, hERG1b F1 5′ GTGAGGCGGGCCGTGCGCATCTCCAGCCTCGTGGCCCAGGAGGTCCTGTCCCTGGGCGCC 3′; hERG1b F2 5′ GCAGGACAGGGGCTCTGCGGCCCAGGGCCCAGAAAGGCCGGGTGAGGCGGGCCGTGCGC 3′; hERG1b F3 5′ AAGCTTGCCGCCACCATGGCGGCCCCAGCCGGGAAGGCGAGCAGGACAGGGGCTCTGCGG 3′ hERG1b RP 5′ GGATCCCTAACTGCCCGGGTCCGA. Final amplicon was generated in three PCR steps using Phusion polymerase. Finally, the full length hERG1b was cloned into pCDNA 3.1 expression vector using Hind III and Bam HI restriction enzyme sites and sequence confirmed. Site‐directed mutagenesis of hERG was performed using QuikChange® II XL kit (Stratagene Catalogue #200521, La Jolla, California, USA) according to the recommended protocol. Mutation constructs were confirmed by restriction enzyme digestion and DNA sequence analyses.
Cell culture
HEK‐293 cells stably expressing hERG1a channels or cells transiently expressing homomeric hERG1b or heteromeric hERG1a/1b were grown in DMEM medium supplemented with 10% foetal bovine serum, 1% penicillin–streptomycin, 1% sodium pyruvate, 1% non‐essential amino acids and 450 μg·mL−1 of G418, at 37°C and 5% CO2. For heteromeric hERG1a/1b channels, 2 μg of hERG1b cDNA was co‐transfected with the EGFP (0.3 μg) into HEK293 cells stably expressing hERG1a using Effectene transfection reagent (Qiagen, New Delhi, India) in a 35 mm petri dish. Similarly, for hERG1b/mutant hERG1a channels, 2 μg of hERG1b/mutant hERG1a cDNA was co‐transfected with the EGFP into wild‐type HEK‐293 cells. Cells with green fluorescence were chosen for electrophysiological recordings after 48 h of transfection. For electrophysiological measurements, cells were plated onto 12 mm glass cover slips a day before the recording.
Electrophysiology
Patch‐clamp recordings were performed in conventional whole‐cell configuration using an Axopatch 200B amplifier and Digidata 1440 digitizer (Molecular Devices, Sunnyvale, California, USA). Cover slips with cells were transferred to the stage of an inverted microscope and continuously perfused with external solution (3–4 mL·min−1) containing 140 mM NaCl, 4 mM KCl, 1.8 mM CaCl2, 1 mM MgCl2, 10 mM glucose, 10 mM HEPES (pH 7.4). Patch pipettes were made from borosilicate glass capillary tubing using a P‐97 micropipette puller and filled with internal solution consisting of 130 mM KCl, 1 mM MgCl2, 1 mM CaCl2, 10 mM EGTA, 10 mM HEPES, 5 mM Mg2+ATP (pH 7.2 with KOH). Series resistance compensation was 60–70% with no leak subtraction applied. Patch‐clamp experiments were performed at room temperature (~22°C). ITP‐2 was freshly prepared in the external solution and continuously perfused (3–4 mL·min−1) over the cell, immediately after establishing the whole cell configuration. Data was acquired using PClamp software (version 10.02).
ITP‐2 effects on hERG currents were evaluated using different pulse protocols. To determine differences in rectification in the presence of ITP‐2, currents were activated by 2 s step commands from −80 to +60 mV and tail currents were evoked by a subsequent step to −105 mV. The currents at the end of each pulse were normalized to the absolute value of the extrapolated maximum tail current obtained for each cell following the step to +60 mV and plotted against voltage. The peak current, determined using a double exponential fit to the deactivating current, extrapolated back to the moment of the voltage change, represents the maximal conductance and is proportional to the number of channels in the cell (Sale et al., 2008). A three‐pulse protocol was used to assess the effects on inactivation, similar to the one described previously for hERG mutants S631A and N588K (Zou et al., 1998; McPate et al., 2005). In the absence of drug, a 1 s pulse to +40 mV followed by a brief 10 ms pulse to potentials between −120 and +40 mV applied, to relieve from inactivation to different extents. Following this, membrane potential stepped back to +40 mV for 200 ms and peak currents elicited at this step reflected the available hERG channels. After recording in control conditions, cells were perfused with 3 μM ITP‐2. Subsequently, a slightly modified protocol was applied in the presence of drug due to reduced rectification: a 1 s step to +100 mV to facilitate inactivation, followed by 10 ms step to potentials between −100 and +90 mV and then stepped to +100 mV for 200 ms. Inactivation curves were generated by plotting the normalized peak currents during the third pulse against the membrane potential of corresponding 10 ms voltage step. The resulting data were fitted with the Boltzmann function (GraphPad Prism) to obtain the V1/2 values. Time course of inactivation was measured using a three pulse protocol, following 1 s step to +40 mV (channels were activated and then inactivated at this step), a 10 ms step to −120 mV was applied to allow recovery from inactivation. A third test pulse was then applied to potentials ranging from +20 to +60 mV to induce the re‐onset of channel inactivation. Inactivating currents elicited at the third test pulse were fitted to a single exponential function to obtain the time constants for inactivation. Effects on recovery from inactivation were determined using the protocol where channels were first activated and inactivated by a 1 s step to +20 mV, followed by stepping the membrane to a range of voltages between −60 and −10 mV for 300 ms. Initial rising phase of the tail current at the second step was fit to a mono exponential function to obtain the tau recovery from inactivation (τ). To investigate effects on voltage‐dependence of activation, channels were depolarized to various potentials (−80 to +40 mV) and then tail currents were recorded at −120 mV. Steady‐state activation curves were obtained by plotting the normalized peak tail currents at −120 mV against step voltages. A Boltzmann function was fit (GraphPad Prism) to the resulting data to determine the V1/2 value for channel activation. Activation kinetics were assessed by fitting the rising phase of the step current at +20 mV to a single exponential function. Deactivation kinetics were investigated by employing a voltage protocol where channels were first stepped to +20 mV for 2 s, followed by changing the membrane potential to either −65 or −120 mV for 3 s. Tail currents were fitted to double exponential functions to obtain the fast and slow time constants (τfast, τslow) for deactivation.
In our experience (from previous titration experiments with our hERG1a cell line) transfection of 2 μg hERG1b cDNA into hERG1a cell line was sufficient to yield fastest deactivating tail currents, suggesting channels are predominantly pushed towards heteromerization under these experimental conditions. For evaluating ITP‐2 effects on hERG1a/1b channels, we chose only those cells with rapid deactivation kinetics, i.e., τfast <80 ms and τslow <550 ms. The concentration–response relationship was fitted to a three parameter dose–response curve (GraphPad Prism). ITP‐2 concentration was transformed to log values to reduce data dispersion. In few experiments (with mutant channels), n is less than 5 (n = 4) and could not collect data more than n = 4 either due to poor cell quality because of transfection (inactivation mutants) or the channel expression was very poor (trafficking‐deficient mutants).
Data and statistical analysis
These studies comply with the recommendations on experimental design and analysis in pharmacology (Curtis et al., 2015). Data analysis was performed with PClamp (version 10.2; MDS technologies) and GraphPad Prism (version 5.02) software. For statistical analysis, two‐way ANOVA followed by Bonferroni post test or paired t‐test was used, probability values <0.05 were considered statistically significant. Group sizes were equal by design for paired data, except as indicated in Figures 7D, 7E; 10D; 11D and S1, where group sizes were unequal primarily due to experimental challenges in recording from transiently transfected cells (transfection of hERG1b and mutant constructs). Evaluation of ITP‐2 on cells expressing hERG1a or hERG1a mutant channels was completely randomized. However, for hERG1a/1b channels we picked only those cells with deactivation kinetics τfast <80 ms and τslow <550 ms, to ensure the recorded currents were predominantly arising from heteromeric channels. Data were normalized to eliminate the differences in basal current amplitudes recorded from different cells and, in some cases, currents were normalized to the maximal pre‐pulse/tail current in a given cell to study the voltage‐dependent effects of ITP‐2. In our study, indicated ‘n’ represents data collected from independent experiments.
Figure 7.

hERG1a/1b channels are less sensitive to ITP‐2. (A) Family of current traces showing reduced sensitivity of hERG1a/1b channels to ITP‐2. Currents were elicited as in Figure 1A. (B, C) Corresponding current–voltage relationships for hERG1a/1b steady‐state currents and tail currents before and after 3 μM ITP‐2. ITP‐2 selectively increases test pulse currents, similar to hERG1a channels. Data shown are means±SEM; n = 5. *P < 0.05; significantly different from control; two‐way ANOVA. (D, E) Bar graphs showing reduced sensitivity of hERG1a/1b channels to ITP‐2 (nearly sixfold); n = 13 for hERG1a; n = 8 for hERG1a/1b channels and ICA‐105574 at +20 mV (nearly threefold); n = 5 for hERG1a; n = 8 for hERG1a/1b channels. *P < 0.05, significantly different from hERG1a channels.
Materials
ITP‐2 salt (trifluoroacetate) was synthesized (99.9% pure, determined by HPLC) as reported earlier in the patent: US 20130079338 A1 (King et al., 2013). ICA‐105574 was purchased from Sigma (Bangalore, India). Both the drugs were dissolved in DMSO to give stock solutions of 10 mM. ITP‐2 stocks were prepared freshly in a glass vial and used within a day or two.
Nomenclature of targets and ligands
Key protein targets and ligands in this article are hyperlinked to corresponding entries in http://www.guidetopharmacology.org, the common portal for data from the IUPHAR/BPS Guide to PHARMACOLOGY (Southan et al., 2016), and are permanently archived in the Concise Guide to PHARMACOLOGY 2015/16 (Alexander et al., 2015).
Results
ITP‐2 activates hERG1a channels in HEK‐293 cells
ITP‐2 was identified in a recent hERG screen, as an activator of hERG currents in HEK‐293 cells. ITP‐2 is structurally distinct from previously reported hERG activators (Figure 1A). To better understand the effects of ITP‐2 on hERG1a channels, steady‐state currents were elicited with 20 mV voltage steps from −60 to +60 mV and tail currents at –65 mV. Figure 1B compares hERG outward currents in the absence and presence of 3 μM ITP‐2. Continuous perfusion of 3 μM ITP‐2 selectively increased steady‐state currents at different test potentials and decreased tail currents at −65 mV. The corresponding current–voltage relationships for steady‐state currents and tail currents with those changes are shown in Figure 1C,D. To investigate if the reduction in tail current was observed at different potentials, currents were elicited by step depolarizations to +20 mV for 2 s and then tail currents were recorded in a range of voltages between −120 and +20 mV for 2 s. Tail currents were reduced at potentials below −20 mV and increased at potentials above –20 mV. This action of ITP‐2 was different from earlier hERG activators. Fully activated I‐V relationship became linear in the presence of 3 μM ITP‐2 and reversal potential was not altered (control, −88 ± 1 mV; ITP‐2, ‐86 ± 0.7 mV) as shown in Figure 2A. To evaluate whether a difference in the rectification due to ITP‐2 is responsible for decreased tail currents at negative potentials, currents were activated by 2 s step commands from −80 to +60 mV and tail currents were evoked by a subsequent step to −105 mV. The currents at the end of each pulse were normalized to the absolute value of the extrapolated maximum tail current obtained for each cell following the step to +60 mV and plotted against voltage. This analysis indicated that rectification is reduced in the presence of drug resulting in larger test pulse currents and decreased tail currents (Figure 2B).
Figure 1.
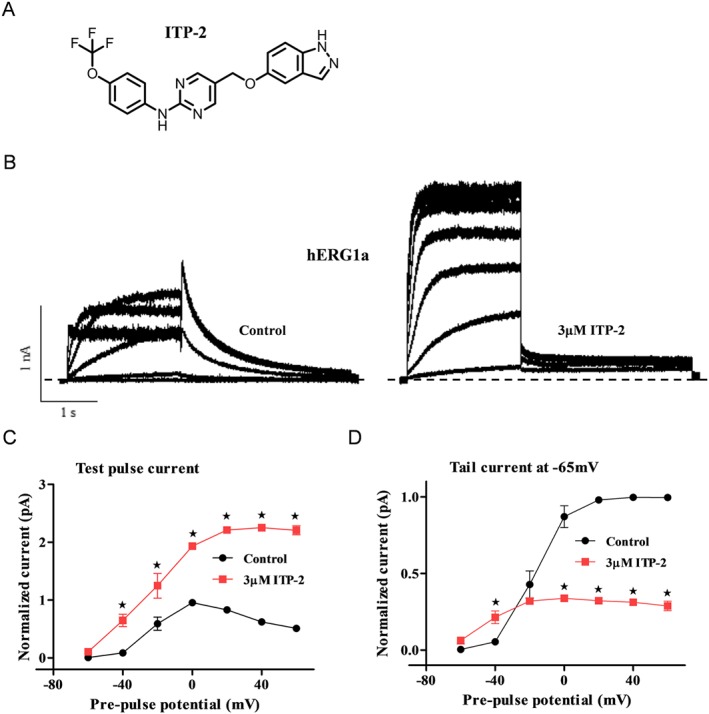
ITP‐2 enhances hERG1a channel current in HEK‐293 cells. (A) Structure of ITP‐2. (B) Representative hERG1a current traces showing activation by ITP‐2. Whole‐cell currents were elicited with 20 mV voltage steps from −60 to +60 mV for 2 s and tail currents at −65 mV for 3 s. (C, D) Representative I‐V relationships for steady‐state currents and tail currents before and after 3 μM ITP‐2. ITP‐2 selectively increases test pulse currents. Data shown are means±SEM; n = 5 . *P < 0.05, significantly different from control; two‐way ANOVA.
Figure 2.

Effect of ITP‐2 on reversal potential and rectification of hERG1a channels. (A) Fully activated I‐V relationships for hERG1a channels were generated from a holding potential of −80 mV with a single step to +20 mV for 2 s and then recorded tail currents in a range of voltages between −120 to +20 mV for 2 s. Currents were normalized to the peak of the outward control current. Amplitudes of currents in the presence of ITP‐2 were normalized to their matched control. Representative current traces before and after perfusion with 3 μM ITP‐2 (top). Fully activated I‐V plots showing no changes in reversal potential with ITP‐2 (n = 5; bottom). (B) Steady‐state I‐V plots revealing differences in rectification in the presence of 3 μM ITP‐2 (left). Currents at the end of each pulse were normalized to the absolute value of the extrapolated maximum tail current evoked subsequent to a pulse to +60 mV and plotted as a function of membrane potential (means±SEM; n = 5). Representative hERG1a current traces showing larger test pulse currents and decreased tail currents in the presence of 3 μM ITP‐2 (right).
In Figure 3A, concentration‐dependent effects of ITP‐2 were assessed. Currents were elicited with a 2 s pulse at +20 mV followed by a 3 s tail step to −65 mV applied every 20 s. The mean current increases, over control, at 0.3, 1, 3 and 10 μM ITP‐2 are shown in Figure 3A, with an EC50 value of 1.0 μM (Figure 3A). At higher concentrations (3 and 10 μM) ITP‐2 had an inhibitory effect, following activation, suggesting that compound has both agonistic and antagonistic effects on hERG channels (Figure 3B). In subsequent experiments, 3 μM ITP‐2 was used, since at this concentration, there was a maximal increase in hERG current and less pronounced secondary current suppressing effect.
Figure 3.

Concentration‐dependent effects of ITP‐2 on hERG1a channel currents. (A) hERG1a current traces in response to increasing concentrations of ITP‐2. Membrane currents were elicited using the protocol shown in inset with an inter‐pulse interval of 20 s. ITP‐2 increases hERG1a currents over a concentration range from 0.3 to 10 μM (left). Concentration‐response relationship for ITP‐2 versus the test pulse current (right). B. ITP‐2 has dual agonistic and antagonistic effects on hERG channels. At higher concentrations (3 and 10 μM), activation is followed by a secondary blocking effect. Data shown are means±SEM; n = 5 at 0.3 and 1μM; n = 13 at 3μM; n = 8 at 10μM.
To further understand the mechanisms responsible for hERG enhancing activity, voltage protocols were designed such that ITP‐2 effects were evaluated before an appreciable secondary current suppressing effect occurred. First, ITP‐2 effects were investigated on voltage‐dependence of inactivation, since initial experiments (Figure 2B) suggested reduced rectification. A three‐pulse protocol was used to assess the effects on inactivation as described in Methods. In the control condition V1/2 value was −72 ± 1 mV and in the presence of ITP‐2 V1/2 value was −2 ± 5 mV, demonstrating a significant shift of voltage‐dependent inactivation, about 70 mV, in the depolarizing direction (Figure 4A). Slope factors (k) were not significantly different in the absence and presence of ITP‐2 (control: −12 ± 8 mV, ITP‐2: −12 ± 21 mV). ITP‐2 was tested further to see if there were any effects on the time course of inactivation. As shown in Figure 4B, time constants for inactivation were significantly increased (two to threefold) by ITP‐2 at various potentials tested and slowing of inactivation time constant was voltage‐dependent. Normalized inactivating currents for comparison of the time course of inactivation are shown in Figure 4B. Recovery from inactivation was faster (lower values of τ) in the presence of ITP‐2 at two indicated voltages −60 and −50 mV (n = 8), while τ values increased from −40 to −10 mV (Figure 4C). Quantification of τ values at very negative potentials (−120 to −100 mV) was not possible, as recovery was extremely rapid at these potentials in the presence of ITP‐2 and the rising phase of the tail current could not be resolved from the overlapping capacitance transient.
Figure 4.

ITP‐2 modulates hERG1a channel inactivation. (A) ITP‐2 shifts voltage‐dependent inactivation to more depolarized potentials (right); data shown are means ±SEM; n = 5. Representative current traces before and after exposure to ITP‐2; for clarity, only selected sweeps are shown (left). Dashed line represents the zero current level. (B) ITP‐2 slows inactivation kinetics of hERG1a channels. Scaled inactivating currents for comparison of time course of inactivation in the absence and presence of ITP‐2 (left). Time constants for inactivation were significantly slower at various potentials tested in the presence of ITP‐2 (right). Data shown are means±SEM; n = 6. *P < 0.05, significantly different from control. (C) Plot showing recovery from inactivation is faster in the presence of ITP‐2 at two indicated voltages −60 and −50 mV (right). Data shown are means±SEM ; n = 8. *P < 0.05, significantly different from control. Scaled tail currents showing faster recovery from inactivation after exposure to ITP‐2 (left). Time constants for recovery from inactivation were obtained by fitting the initial rising phase of the tail current to a mono exponential function.
Further, activation plots were constructed to investigate whether the compound had any effect on voltage‐dependence of activation. ITP‐2 altered the voltage‐dependence of activation by inducing about 23 mV hyperpolarizing shift of the V1/2 (Figure 5A). The slope factor (k) increased significantly in the presence of compound from 7.5 ± 0.2 to 9.5 ± 0.5 mV. Activation kinetics were assessed by fitting the rising phase of the test pulse current at +20 mV to a single exponential function, though this approach has a limitation of an overlapping inactivation process at positive step voltages. Time constants at +20 mV were significantly faster in the presence of ITP‐2 (Figure 5B). An envelope of tails protocol was not employed for investigating activation kinetics, since the peak tail currents overlapped with the capacitance transients (at negative membrane potentials like −100 mV) because of extremely rapid recovery from inactivation in the presence of ITP‐2. The effect of ITP‐2 on deactivation kinetics was investigated at two representative voltages −65 and −120 mV. In the presence of the drug, at −65 mV, ιfast was decreased and ιslow of deactivation was increased but, at −120 mV, both ιfast and ιslow were decreased (Figure 5C).
Figure 5.

ITP‐2 effects on hERG1a channel activation and deactivation. (A) ITP‐2 causes hyperpolarizing shift in the voltage‐dependence of activation. Conductance‐voltage plots were generated by plotting the normalized peak tail currents at −120 mV against the preceding voltage steps. Data shown are means±SEM; n = 8. (B) ITP‐2 accelerates hERG1a channel activation kinetics. Normalized test pulse currents before and after exposure to ITP‐2 (left). A single exponential was used to fit the activation time course. Time constants of activation at a representative voltage (+20 mV) were plotted for comparison (right). Data shown are means±SEM; n = 15. *P < 0.05, significantly different from control. (C) Scaled tail currents showing deactivation is faster after exposure to ITP‐2 at −120 mV (left). Tail currents were fitted to double exponential functions to obtain the fast and slow time constants for deactivation. Time constants of deactivation (slow and fast component) at two representative voltages (−65 and −120 mV) were plotted for comparison (right). Data shown are means±SEM; n = 5, ‐65mV; n = 12, ‐120mV. *P < 0.05, significantly different from control.
Because ITP‐2 selectively increased test pulse currents and reduced tail currents, we evaluated if ITP‐2 does actually function as an activator under physiological conditions. For this purpose, we used a pre‐recorded action potential from rabbit ventricular myocyte as a voltage‐clamp stimulus to evaluate the overall effect of ITP‐2 on hERG1a currents during an action potential. Current traces before and after 3 μM ITP‐2 in response to action potential stimulus are shown in Figure 6. Integrating the current traces in control and in the presence of 3 μM ITP‐2 indicated that there was 2.73 ± 0.11‐fold increase in total potassium ions conducted by hERG1a channels during the action potential voltage‐command in the presence of the compound (n = 5).
Figure 6.
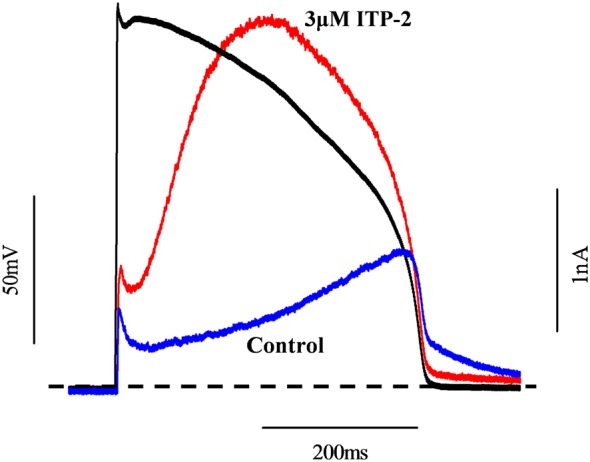
ITP‐2 increases total potassium ions conducted by hERG1a channels during an action potential stimulus. Typical current traces before and after exposure to ITP‐2 are shown. Dashed line represents the zero current level.
ITP‐2 differentially modulates hERG1a/1b heteromeric channels
We investigated the effects of ITP‐2 on heteromeric hERG1a/1b channels as increasing evidence indicates that hERG1a/1b channels, rather than homomeric 1a channels, mediate repolarization in human cardiac cells (Jones et al., 2014). Transfection of hERG1b into hERG1a stable cell line resulted in heteromeric hERG1a/1b currents, as reported earlier (Sale et al., 2008). To confirm that transfection of hERG1b into hERG1a cell line led to the formation of heteromeric channels, deactivation kinetics were compared to those of homomeric hERG1a and hERG1b channels at −65 mV. The average deactivation time constants when hERG1b transfected into hERG1a cell line (hERG1a/1b channels) were τfast 65 ± 3 ms, τslow 506 ± 18 ms (n = 33); for homomeric hERG1a channels τfast 160 ± 4 ms, τslow 902 ± 48 ms (n = 34); and for homomeric hERG1b channels τfast 27 ± 2 ms, τslow 326 ± 82 ms (n = 5). The observed deactivation time constants when hERG1b transfected into hERG1a cell line were much faster than the theoretical deactivation time constants (calculated as algebraic summation of the deactivation kinetics of hERG1a and hERG1b homomeric channels), assuming the formation of only homomeric hERG1a and hERG1b channels. This strongly suggested that observed currents are due to heteromeric channel formation and cells expressing currents with deactivation kinetics τfast < 80 ms and τslow < 550 ms were picked for evaluating ITP‐2 effects. When we tested ITP‐2, hERG1a/1b channels showed reduced sensitivity in comparison to homomeric hERG1a channels and Figure 7A illustrates hERG1a/1b currents in the absence and presence of 3 μM ITP‐2. Heteromeric channels showed nearly sixfold reduced sensitivity to ITP‐2 when compared to hERG1a channels (Figure 7D). ITP‐2 selectively increased hERG1a/1b test pulse currents and decreased tail currents, very similar to the effects on homomeric hERG1a channels. Corresponding current–voltage relationships for steady‐state currents and tail currents were shown in Figure 7B,C. Similar to the results with ITP‐2, the heteromeric hERG channels showed nearly threefold reduced sensitivity to ICA‐105574, another known hERG activator (Figure 7E).
To explore the biophysical basis for differential sensitivity, we investigated whether differences in the modulation of the gating properties of hERG1a/1b channels by ITP‐2 could account for the reduced sensitivity. For this, steady‐state inactivation curves were plotted for heteromeric channels in the absence and presence of ITP‐2 with exactly similar protocols used for hERG1a channels earlier. Boltzmann fits to the plots yielded V1/2 values (Figure 8A) and, in the control condition, V1/2 values were consistent with earlier results (Sale et al., 2008). However, V1/2 values were depolarized for hERG1a/1b channels in comparison to hERG1a channels (Figure 8A vs. Figure 4A). In the presence of ITP‐2, V1/2 values for the heteromeric channels were significantly shifted by about 58 mV in the depolarizing direction. Slope factors (k) were not significantly different in the absence and presence of ITP‐2 (control: −9 ± 8 mV, drug: −26 ± 10 mV). This shift in V1/2 of voltage‐dependent inactivation for hERG1a/1b channels was significantly less (about 12 mV) when compared to hERG1a channels. V1/2 shift for hERG1a/1b channels was 58 ± 2 mV (n = 7), while V1/2 shift for hERG1a channels was 70 ± 4 mV (n = 5) (P < 0.05). Examination of time course of inactivation revealed significant differences in modulation of heteromeric channels by ITP‐2. Slowing of inactivation was less pronounced for hERG1a/1b channels (Figure 8B vs. Figure 4B). Quantification of fold increase in time course of inactivation showed that the slowing of inactivation was significantly less at several potentials for hERG1a/1b channels, compared with hERG1a channels (Figure 8C; P < 0.05, n = 5 for hERG1a/1b, n = 6 for hERG1a). ITP‐2 caused recovery from inactivation faster for hERG1a/1b channels, similar to hERG1a channels (Figure 8D); however, effects appeared to be pronounced for heteromeric channels (compare Figure 8D with Figure 4C). Corresponding scaled tail currents for recovery from inactivation without and with ITP‐2 are shown in Figure 8D.
Figure 8.

ITP‐2 differentially modulates hERG1a/1b channel inactivation. (A) Steady‐state inactivation curves for hERG1a/1b channels before and after exposure to ITP‐2 (right). Shift in V1/2 of voltage‐dependent inactivation for hERG1a/1b channels is significantly less when compared to hERG1a. Representative current traces before and after exposure to ITP‐2, for clarity only selected sweeps are shown (left). Dashed line represents the zero current level. Data shown are means±SEM; n = 7. (B) Slowing of inactivation is less pronounced for hERG1a/1b channels (compare Figure 4B for hERG1a). Time course of inactivation was significantly slower only at +60 mV. Data shown are means±SEM; n = 5. *P < 0.05, significantly different from control. (C) Comparison of fold change in ιinactivation for hERG1a and hERG1a/1b channels. ITP‐2 has less effect on slowing of inactivation for hERG1a/1b channels. Data shown are means±SEM; n = 5, hERG1a/1b; n = 6, hERG1a. *P < 0.05, significantly different from hERG1a channels. (D) Plot showing recovery from inactivation for hERG1a/1b channels is faster in the presence of ITP‐2 (right). Data shown are means±SEM; n = 6. *P < 0.05, significantly different from control. Corresponding scaled tail currents for recovery from inactivation without and with ITP‐2 (left).
We next constructed steady‐state activation curves to investigate modulation of voltage‐dependence of activation. ITP‐2 changed the voltage‐dependence of activation for hERG1a/1b channels by a hyperpolarizing shift of the V1/2 of nearly 20 mV (Figure 9A). Slope factor (k) increased significantly in the presence of compound from 9 ± 0.7 to 12 ± 0.5 mV. The change in voltage‐dependence of activation for heteromeric channels, however, was not significantly different from that observed with homomeric hERG1a channels (V1/2 shift for hERG1a/1b channels, 20 ± 1.5 mV; n = 5: V1/2 shift for hERG1a channels, 22.5 ± 1 mV; n = 8). Similar to hERG1a channels, activation kinetics at +20 mV were faster in the presence of ITP‐2 (Figure 9B) and the fold reduction in time constant of activation was not significantly different from that in hERG1a channels. Effects on deactivation kinetics were also similar to those on hERG1a channels. Thus, at −65 mV, deactivation was slower (both ιfast and ιslow increased) and, at −120 mV, both ιFast and ιSlow were decreased, in the presence of ITP‐2 (Figure 9C).
Figure 9.

ITP‐2 effects on activation and deactivation of hERG1a/1b channels. (A) ITP‐2 causes a hyperpolarizing shift in the voltage‐dependence of activation for hERG1a/1b channels, similar to hERG1a channels. Data shown are means±SEM; n = 5. Change in V1/2 of activation for hERG1a/1b channels is not significantly different from hERG1a channels (compare Figure 5A for hERG1a). (B) ITP‐2 accelerates hERG1a/1b activation kinetics, as with hERG1a channels. Normalized test pulse currents before and after exposure to ITP‐2 (left). Time constants of activation at a representative voltage (+20 mV) were plotted for comparison (right). Data shown are means±SEM; n = 18. *P < 0.05, significantly different from control. (C) Scaled tail currents showing deactivation is faster after exposure to ITP‐2 at −120 mV, similar to hERG1a channels (left). Time constants of deactivation (slow and fast component) at two representative voltages (−65 and −120 mV) were plotted for comparison (right). Data shown are means±SEM; n = 16, ‐65 mV; n = 5, ‐120 mV. *P < 0.05, significantly different from control.
ITP‐2 inhibits homomeric hERG1b channels
Because ITP‐2 exerted different effects on heteromeric hERG1a/1b channels, we then investigated actions of ITP‐2 on homomeric hERG1b channels as well. Consistent with the earlier report (Phartiyal et al., 2008), transfection of hERG1b into HEK cells resulted in extremely poor functional expression of hERG1b currents with very rapid deactivation kinetics (Figure S1A). For evaluating drug effects, hERG1b currents were elicited using the protocol shown in Figure 3A inset and application of ITP‐2 caused inhibition of hERG1b channels (23 ± 8%, n = 5; Figure S1A). Figure S1B shows comparison of ITP‐2 effects on homomeric hERG1a and hERG1b channels.
Inactivation‐impairing mutations abolish the activating effects of ITP‐2
To assess the role of inactivation in the agonistic effects of ITP‐2, this compound was tested on two inactivation‐impaired hERG1a mutant channels S620 T and S631A. Both the mutations completely abolished activating effects and instead led to channel inhibition by ITP‐2 (Figure 10A,B). Inhibition of inactivation‐impaired mutant channels indicated that ITP‐2 has an intrinsic antagonistic activity, which is masked by its activating effect. This is in line with our initial experiments showing antagonistic activity of ITP‐2 (Figure 3B). If this current inhibition is due to the binding in the central cavity of the pore, mutation of the high affinity binding sites in the pore would be expected to enhance the activating effect of ITP‐2. We mutated F656, a critical residue in the pore that determines the affinity to a number of blockers and mutation of this residue (F656M) greatly reduces the drug block (Lees‐Miller et al., 2000; Mitcheson et al., 2005). In our model, F656M mutation did not enhance activator effects and instead led to channel inhibition to the same magnitude as in the inactivation‐impaired mutants (Figure 10C). Figure 10D shows comparison of ITP‐2 effects on wild type hERG and mutant channels. We then investigated if the activating and inhibitory effects are from extracellular side or intracellular side of the membrane. This was done by first applying 10 μM ITP‐2 on the intracellular side through pipette solution. Currents were monitored continuously (every 20 s) using the protocol shown in Figure 3A inset. Intracellular application of ITP‐2 (Figure 10E) produced a minimal block (13 ± 5%, n = 5) with no enhancing effect on hERG current. However, subsequent extracellular (bath) application on the same cell caused robust activation followed by strong inhibition (48 ± 9.7%) of hERG current (Figure 10E), suggesting agonistic/antagonistic effects are exerted from the extracellular side of the membrane. To confirm the lack of activating effect from the intracellular side was not due to ineffective drug diffusion, E‐4031 (0.3 μM) was applied through the pipette solution. Intracellular E‐4031 application completely blocked hERG currents, confirming the effectiveness of drug diffusion.
Figure 10.
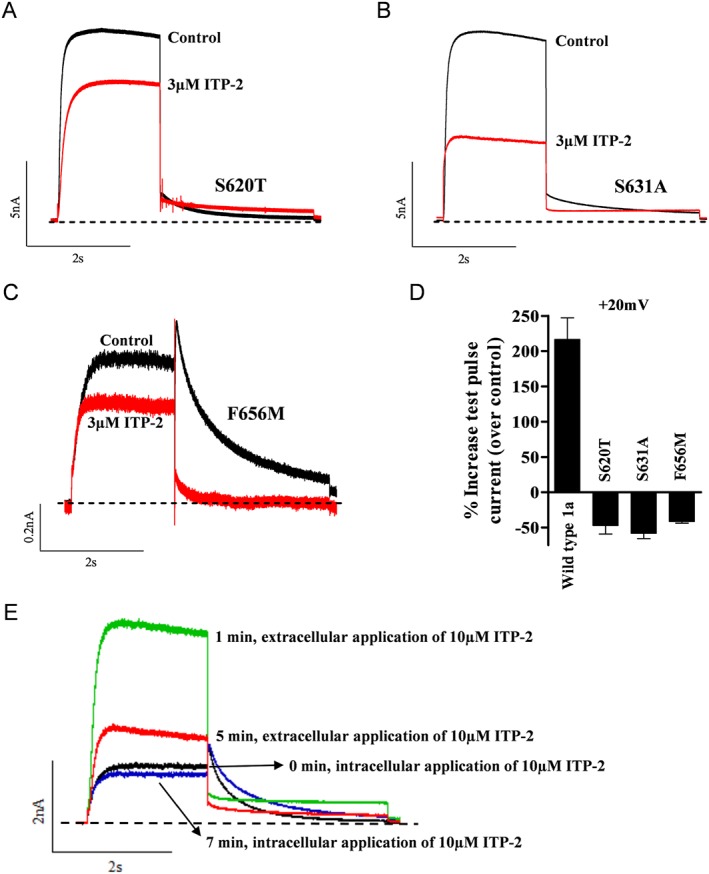
Inactivation‐impairing mutations abolish activating effects of ITP‐2. (A, B) Response of inactivation‐impairing mutations S620T and S631A to ITP‐2. ITP‐2 failed to activate and instead inhibited S620T and S631A channels. (C) Drug binding site mutant F656M was also inhibited by ITP‐2 and did not enhance activator effects. (D) Bar graph showing comparison of ITP‐2 effects on wild type hERG and mutant channels at +20 mV. Data shown are means±SEM; n = 4, S620T and S631A; n = 5, F656M. (E) Intracellular application of 10 μM ITP‐2 through the patch‐pipette resulted in a minimal block, rather than activation. Only extracellular application of ITP‐2 on the same cell led to robust activation and inhibition of hERG current.
ITP‐2 activates trafficking‐deficient LQT2 mutant channels
Mutations in hERG cause LQT2 and trafficking deficiency is the dominant mechanism by which LQT2 mutations result in loss of IKr function (Anderson et al., 2006). Here, we examined the ability of ITP‐2 to activate two trafficking‐deficient LQT2 mutants, G601S and N470D, to test the hypothesis that pharmacological activation of residual mutant channels at the cell surface can be another approach for restoring hERG channel function. As previously reported, both the mutants resulted in poor functional expression of hERG currents (Figure 11A–C). To assess ITP‐2 effects on G601S and N470D mutants, currents were elicited with a 2 s pulse at +20 mV followed by a 3 s tail step at −65 mV applied every 20 s. ITP‐2 (3μM) activated the G601S mutant channels with nearly twofold reduced potency, compared with the wild type, but completely failed to activate the N470D mutant (Figure 11A,C), while ICA‐105574 could activate both the mutants with threefold reduced potency (Figure 11B,C). Figure 11D shows comparison of ITP‐2 and ICA‐105574 effects on hERG1a wild type and LQT2 mutants.
Figure 11.

ITP‐2 activates a trafficking‐deficient LQT2 mutant channel. (A, B) ITP‐2 and ICA‐105574 activated the LQT2 mutant G601S channel but with reduced potency. (C) ITP‐2 failed to activate the N470D LQT2 mutant channel, while ICA‐105574 could activate but again with reduced potency. (D) Bar graph showing comparison of ITP‐2 effects on wild type hERG (n = 13) and LQT2 mutant channels (n = 4) with those of ICA‐105574 (wild type, n = 5; mutantchannels, n = 4). Experiments were carried out at +20 mV.
Discussion
We have described, here, a novel hERG channel opener ITP‐2, with a structure distinct from the previously reported compounds. It exerted several effects on hERG channel gating. Major effects were on voltage‐dependent inactivation (a rightward shift in V1/2 by about 70 mV at 3 μM) and voltage‐dependent activation (a leftward shift in V1/2 by about 23 mV at 3 μM). In addition, there were changes in time course of inactivation (slower), recovery from inactivation (faster) and activation kinetics (accelerated). All these changes are expected to increase hERG current amplitude. ITP‐2 also had an intrinsic antagonistic activity which was evident at concentrations of 3 μM and above. In addition to its unique structure, ITP‐2 is distinct in its actions from earlier hERG activators. ITP‐2 selectively increased test pulse currents and decreased tail currents while earlier reported activators increased both pre‐pulse and tail currents (Kang et al., 2005; Zhou et al., 2005; Casis et al., 2006; Zeng et al., 2006; Hansen et al., 2006a,b; Gordon et al., 2008; Su et al., 2009; Gerlach et al., 2010; Gessner et al., 2010; Potet et al., 2012; Zhang et al., 2012). This is due to reduced rectification in the presence of ITP‐2 resulting in larger test pulse currents and decreased tail currents, similar to the effects caused by a non‐inactivating mutation. ITP‐2 (at 3 μM) produced large shifts in both voltage‐dependent inactivation and activation (+70 and −23 mV respectively). None of the previously reported activators induced such large shifts in both voltage‐dependent inactivation and activation. PD‐307243, NS‐3623, ICA‐105574, ML‐T531 and AZSMO‐23 were shown to produce a shift only in voltage‐dependent inactivation (PD‐307243 at 3 μM +16 mV; NS‐3623 at 30 μM +18 mV; ICA‐105574 at 1 μM > +180 mV; ML‐T531 at 10 μM +28 mV; AZSMO‐23 at 30 μM +74.5 mV) (Hansen et al., 2006b; Gordon et al., 2008; Gerlach et al., 2010; Garg et al., 2011; Zhang et al., 2012; Mannikko et al., 2015), while NS‐1643, mallotoxin and KB130015‐induced shift only in voltage‐dependent activation (NS‐1643 at 10 μM −27 mV; mallotoxin at 10 μM −26 mV; KB130015 at 10 μM −16 mV) (Zeng et al., 2006; Gessner et al., 2010; Schuster et al., 2011). A‐935142 and VU0405601 were shown to produce changes in V1/2 of both voltage‐dependent activation and inactivation, however, V1/2 changes produced by A‐935142 and VU0405601 even at very high concentrations were smaller in magnitude, compared with those produced by ITP‐2 (Su et al., 2009; Potet et al., 2012). With ITP‐2 at 3 μM, the magnitude of effects on V1/2 of inactivation was similar to ICA‐105574 and the magnitude of effects on V1/2 of activation was in the same range as that of NS‐1643. Reversal potential of the hERG current was not altered in the presence of ITP‐2, indicating it did not disrupt the selectivity filter. During the action potential voltage command, a large dome‐shaped current was observed with ITP‐2 application that peaked earlier than the current observed in the control, similar to that reported for the N588K short QT mutant channel (McPate et al., 2005). As suggested earlier (McPate et al., 2005), the anticipated consequence of this altered profile is greater repolarising current during the action potential plateau phase, leading to accelerated repolarisation.
We characterized ITP‐2 effects on heteromeric hERG1a/1b channels as well, as such heteromeric channels mediate repolarization in human cardiac cells (Jones et al., 2014). Interestingly, ITP‐2 was less potent on hERG1a/1b channels by about sixfold, compared with its effects on hERG1a homomeric channels. When we examined the biophysical basis for this differential sensitivity, hERG1a/1b gating kinetics were found to be differentially modulated by ITP‐2. Major differences were observed in the modulation of voltage‐dependent inactivation and time course of inactivation. The rightward shift in V1/2 of voltage‐dependent inactivation was 12 mV less than that induced in hERG1a channels. Also, slowing of inactivation (fold change in ιinactivation) was significantly less pronounced for heteromeric channels at several potentials. This differential modulation of inactivation properties may explain the reduced sensitivity of heteromeric channels to ITP‐2. Previous studies have shown differences in ‘blocker’ potencies for hERG1a/1b channels, some blockers were more potent and some less potent on hERG1a/1b channels (Sale et al., 2008; Abi‐Gerges et al., 2011). Accordingly, it was proposed that differential sensitivity of hERG1a/1b channels may lead to changes in the safety or therapeutic margins for drugs (Abi‐Gerges et al., 2011). Larsen et al. (2010) observed no differences in efficacy for two hERG ‘activators’ between hERG1a and hERG1a/1b channels. In another study, Schuster et al. (2011) showed differences in potency for NS1643, but these were on rat ERG1a and 1a/1b channels. NS1643 was more potent (approximately twofold) on rERG1a/1b channels than on rERG1a channels. In the current study, we showed for the first time differential sensitivity of human ERG1a/1b channels to an activator. Similarly, we also observed reduced sensitivity of hERG1a/1b channels to ICA‐105574, another well‐known hERG activator. Thus, our data emphasizes the importance of testing on hERG1a/1b channels, when developing novel hERG activators. Consistent with the previous findings, this study further confirms that heteromeric hERG1a/1b channels can indeed demonstrate different sensitivity to drugs, relative to the homomeric hERG1a channels.
Mutant hERG channels were employed to further probe the mechanism of action of ITP‐2. The inactivation‐impairing mutations (S620T and S631A) completely abolished activation and caused inhibition of the channels. When inactivation was impaired, the antagonistic effect appeared to be dominant and that led to inhibition of S620T and S631A mutant channels. This may also explain why homomeric hERG1b channels were inhibited by ITP‐2. hERG1b channels have less inactivation and depolarized voltage‐dependence of inactivation when compared to hERG1a and hERG1a/1b channels (Crotti et al., 2013), so that inactivation is somewhat impaired and the dominant antagonistic effect is observed on hERG1b channels. Antagonistic effect was masked by agonistic effects when the C‐type inactivation was intact. The results from the S620T and S631A mutant channels strongly suggest that the agonistic effect of ITP‐2 was primarily due to modification of C‐type inactivation. However, we cannot exclude modification of channel activation contributing to the agonistic effect, as there appear to be allosteric interactions between outer mouth and activation gating apparatus in hERG channels (Jiang et al., 1999; Liu et al., 2002). Mutations in the outer mouth region that disrupt C‐type inactivation are also associated with profound changes in the voltage‐dependence and kinetics of activation in the negative voltage range (Jiang et al., 1999). In fact, inactivation‐disrupting mutations abolished the activator effects of NS1643, which acts primarily by modifying the voltage‐dependence of activation (Xu et al., 2008). It is possible that ITP‐2 binding could be inducing conformational changes, similar to those induced by C‐type inactivation‐disrupting mutations, affecting not only inactivation but also the voltage‐dependence of activation. We investigated if the antagonistic effect was due to binding in the central pore cavity, by mutating one of the high affinity binding sites, F656, in the pore. Earlier study showed enhanced activating effects for NS‐3623, when F656 was mutated to methionine (Hansen et al., 2006b). In contrast, in our model, F656M mutation did not show enhancement of the activating effect for ITP‐2 but, instead, showed channel inhibition, to the same extent as inactivation‐impaired mutant channels. Mutation of F656 did not alter the inhibitory response, suggesting current inhibition may not be due to binding in the central pore cavity. As proposed for ICA‐105574, current inhibition may be due to stabilization of channels either in the closed or inactivated state, rather than pore occlusion (Garg et al., 2011). Intracellular application of 10 μM ITP‐2 produced a minimal block with no enhancing effects and ITP‐2 exerted agonistic/antagonistic effects only from outside the cell membrane, presumably by binding to site(s) on the extracellular side of the membrane. It is not known if activating and inhibitory effects of ITP‐2 involve a single binding site or two different binding sites, one for agonistic activity and another for antagonistic activity. Clearly, a thorough mutational analysis is needed to identify the putative binding sites of ITP‐2.
Trafficking deficiency appears to be the dominant mechanism that underlies loss of IKr in LQT2 and the trafficking‐deficient phenotype in majority of the cases can be corrected either pharmacologically or by different cell culture conditions (Anderson et al., 2006). Even without correction, however, most of the trafficking‐defective LQT2 mutants can still generate small hERG currents (Anderson et al., 2006) and we hypothesized that pharmacological activation of this residual hERG current at the cell surface could be another approach for restoring hERG channel function in LQT2. Therefore, we examined whether ITP‐2 is capable of activating two trafficking‐deficient LQT2 mutants, G601S and N470D. ITP‐2 was able to activate the G601S mutant channel but with twofold reduced potency. However, it failed to activate N470D mutant, suggesting possibly this mutation disrupted a key component of the binding site for agonistic activity, while ICA‐105574 was able to activate both the mutants, with about threefold reduced potency. It is worth noting that although inactivation is reported to be intact in both G601S and N470D LQT2 mutants (Sanguinetti et al., 1996; Furutani et al., 1999), surprisingly both the activators showed reduced potency or lack of effect on these mutant hERG channels. The reduced effects of ITP‐2 and ICA‐105574 on LQT2 mutants, in general, should be considered as important factors while developing new therapeutic agents for LQT2.
In conclusion, we have identified ITP‐2, a new hERG channel activator with a unique chemical structure that exerted distinct effects on hERG channels. hERG1a/1b channels were differentially modulated by ITP‐2 leading to reduced sensitivity and our study further stresses the importance of testing compounds on hERG1a/1b channels. ITP‐2 provides a novel scaffold that may be useful in the development of new therapeutic agents for LQT2.
Author contributions
H.S. and M.R. conceived and designed the experiments: H.S. ans S.R. performed the experiments; reagents were generated by J.W., S.T., Y.V., S.G. and P.K.; data was analysed by H.S.; the paper was written by H.S. and M.R.
Conflict of interest
The authors are employees of Biocon Bristol‐Myers Squibb R&D centre (BBRC) and BBRC is involved in the synthesis of ITP‐2 used in the current study.
Declaration of transparency and scientific rigour
This Declaration acknowledges that this paper adheres to the principles for transparent reporting and scientific rigour of preclinical research recommended by funding agencies, publishers and other organisations engaged with supporting research.
Supporting information
Figure S1 ITP‐2 inhibits hERG1b channels. A. Poor functional expression of hERG1b in HEK cells (top). hERG1b current traces in response to ITP‐2 (bottom). Membrane currents were elicited using the protocol shown in Figure 3A inset with an interpulse interval of 20s. Inset shows rapidly deactivating hERG1b tail currents. B. Bar graph showing comparison of ITP‐2 effects on homomeric hERG1a (n = 15) and hERG1b (n = 5) channels at +20 mV.
Acknowledgements
Authors would like to thank Ravichandra Venkateshappa and Sheela P Das for their expert technical assistance.
Sale, H. , Roy, S. , Warrier, J. , Thangathirupathy, S. , Vadari, Y. , Gopal, S. K. , Krishnamurthy, P. , and Ramarao, M. (2017) Modulation of Kv11.1 (hERG) channels by 5‐(((1H–indazol‐5‐yl)oxy)methyl)‐N‐(4‐(trifluoromethoxy)phenyl)pyrimidin‐2‐amine (ITP‐2), a novel small molecule activator. British Journal of Pharmacology, 174: 2484–2500. doi: 10.1111/bph.13859.
Contributor Information
Harinath Sale, Email: harinath.sale@syngeneintl.com.
Manjunath Ramarao, Email: manjunath.ramarao@bms.com.
References
- Abi‐Gerges N, Holkham H, Jones EMC, Pollard CE, Valentin JP, Robertson GA (2011). hERG subunit composition determines differential drug sensitivity. Br J Pharmacol 164: 419–432. [DOI] [PMC free article] [PubMed] [Google Scholar]
- Alexander SPH, Catterall WA, Kelly E, Marrion N, Peters JA, Benson HE et al. (2015). The concise guide to PHARMACOLOGY 2015/16: Voltage‐gated ion channels. Br J Pharmacol 172: 5904–5941. [DOI] [PMC free article] [PubMed] [Google Scholar]
- Anderson CL, Delisle BP, Anson BD, Kilby JA, Will ML, Tester DJ et al. (2006). Most LQT2 mutations reduce Kv11.1 (hERG) current by a class 2 (trafficking‐deficient) mechanism. Circulation 113: 365–373. [DOI] [PubMed] [Google Scholar]
- Casis O, Olesen SP, Sanguinetti MC (2006). Mechanism of action of a novel human ether‐a‐go‐go‐related gene channel activator. Mol Pharmacol 69: 658–665. [DOI] [PubMed] [Google Scholar]
- Crotti L, Tester DJ, White WM, Bartos DC, Insolia R, Besana A et al. (2013). Long QT syndrome–associated mutations in intrauterine fetal death. JAMA 309: 1473–1482 (Supplementary information). [DOI] [PMC free article] [PubMed] [Google Scholar]
- Curran ME, Splawski I, Timothy KW, Vincent GM, Green ED, Keating MT (1995). A molecular basis for cardiac arrhythmia: HERG mutations cause long QT syndrome. Cell 80: 795–803. [DOI] [PubMed] [Google Scholar]
- Curtis MJ, Bond RA, Ahluwalia A, Alexander SPA, Giembycz MA et al. (2015). Experimental design and analysis and their reporting: new guidance for publication in BJP. Br J Pharmacol 172: 3461–3471. [DOI] [PMC free article] [PubMed] [Google Scholar]
- Diness TG, Yeh YH, Qi XY, Chartier D, Tsuji Y, Hansen RS et al. (2008). Antiarrhythmic properties of a rapid delayed‐rectifier current activator in rabbit models of acquired long QT syndrome. Cardiovasc Res 79: 61–69. [DOI] [PubMed] [Google Scholar]
- Furutani M, Trudeau MC, Hagiwara N, Seki A, Gong Q, Zhou Z et al. (1999). Novel mechanism associated with an inherited cardiac arrhythmia defective protein trafficking by the mutant HERG (G601S) potassium channel. Circulation 99: 2290–2294. [DOI] [PubMed] [Google Scholar]
- Garg V, Stary‐Weinzinger A, Sachse F, Sanguinetti MC (2011). Molecular determinants for activation of human ether‐a‐go‐go‐related gene 1 potassium channels by 3‐nitro‐n‐(4 phenoxyphenyl) benzamide. Mol Pharmacol 80: 630–637. [DOI] [PMC free article] [PubMed] [Google Scholar]
- Gerlach AC, Stoehr SJ, Castle NA (2010). Pharmacological removal of human ether‐à‐go‐go‐related gene potassium channel inactivation by 3‐nitro‐N‐(4‐phenoxyphenyl) benzamide (ICA‐105574). Mol Pharmacol 77: 58–68. [DOI] [PubMed] [Google Scholar]
- Gessner G, Macianskiene R, Starkus JG, Schonherr R, Heinemann SH (2010). The amiodarone derivative KB130015 activates hERG1 potassium channels via a novel mechanism. Eur J Pharmacol 632: 52–59. [DOI] [PMC free article] [PubMed] [Google Scholar]
- Gordon E, Lozinskaya IM, Lin Z, Semus SF, Blaney FE, Willette RN et al. (2008). 2‐[2‐(3,4‐Dichloro‐phenyl)‐2,3‐dihydro‐1H‐isoindol‐5‐ylamino]‐nicotinic acid (PD‐307243) causes instantaneous current through human ether‐a‐go‐go‐related gene potassium channels. Mol Pharmacol 73: 639–651. [DOI] [PubMed] [Google Scholar]
- Hansen RS, Diness TG, Christ T, Demnitz J, Ravens U, Olesen SP et al. (2006a). Activation of human ether‐a‐go‐go‐related gene potassium channels by the diphenylurea 1,3‐bis‐(2‐hydroxy‐5‐trifluoromethyl‐phenyl)‐urea (NS1643). Mol Pharmacol 69: 266–277. [DOI] [PubMed] [Google Scholar]
- Hansen RS, Diness TG, Christ T, Wettwer E, Ravens U, Olesen SP et al. (2006b). Biophysical characterization of the new human ether‐a‐go‐go‐related gene channel opener NS3623 [N‐(4‐bromo‐2‐(1H‐tetrazol‐5‐yl)‐phenyl)‐N2‐(32 trifluoromethylphenyl)urea]. Mol Pharmacol 70: 1319–1329. [DOI] [PubMed] [Google Scholar]
- Jiang M, Dun W, Fan JS, Tseng GN (1999). Use‐dependent ‘agonist’ effect of azimilide on the HERG channel. J Pharmacol Exp Ther 291: 1324–1336. [PubMed] [Google Scholar]
- Jones DK, Liu F, Vaidyanathan R, Eckhardt LL, Trudeau MC, Robertson GA (2014). hERG1b is critical for human cardiac repolarization. Proc Natl Acad Sci U S A 111: 18073–18077. [DOI] [PMC free article] [PubMed] [Google Scholar]
- Jones EM, Roti Roti EC, Wang J, Delfosse SA, Robertson GA (2004). Cardiac IKr channels minimally comprise hERG 1a and 1b subunits. J Biol Chem 279: 44690–44694. [DOI] [PubMed] [Google Scholar]
- Kang J, Chen XL, Wang H, Ji J, Cheng H, Incardona J et al. (2005). Discovery of a small molecule activator of the human ether‐a‐go‐go‐related gene (HERG) cardiac K+ channel. Mol Pharmacol 67: 827–836. [DOI] [PubMed] [Google Scholar]
- King D, Macor JE, Olson RE, Iwuagwu C, Karageorge GN (2013). Preparation of substituted pyrimidinamines as selective NR2B antagonists. U.S. Pat. Appl. Publ, US 20130079338 A1.
- Larsen AP, Bentzen BH, Grunnet M (2010). Differential effects of Kv11.1 activators on Kv11.1a, Kv11.1b and Kv11.1a/Kv11.1b channels. Br J Pharmacol 161: 614–628. [DOI] [PMC free article] [PubMed] [Google Scholar]
- Larsen AP, Olesen SP (2010). Differential expression of hERG1 channel isoforms reproduces properties of native I(Kr) and modulates cardiac action potential characteristics. PLoS One 5: e9021. [DOI] [PMC free article] [PubMed] [Google Scholar]
- Larsen AP, Olesen SP, Grunnet M, Jespersen T (2008). Characterization of hERG1a and hERG1b potassium channels‐a possible role for hERG1b in the I(Kr) current. Pflugers Arch 456: 1137–1148. [DOI] [PubMed] [Google Scholar]
- Lees‐Miller JP, Duan Y, Teng GQ, Duff HJ (2000). Molecular determinant of high‐affinity dofetilide binding to HERG1 expressed in Xenopus oocytes: involvement of S6 sites. Mol Pharmacol 57: 367–374. [PubMed] [Google Scholar]
- Liu J, Zhang M, Jiang M, Tseng GN (2002). Structural and functional role of the extracellular S5‐P linker in the HERG potassium channel. J Gen Physiol 120: 723–737. [DOI] [PMC free article] [PubMed] [Google Scholar]
- London B, Trudeau MC, Newton KP, Beyer AK, Copeland NG, Gilbert DJ et al. (1997). Two isoforms of the mouse ether‐a‐go‐go‐related gene coassemble to form channels with properties similar to the rapidly activating component of the cardiac delayed rectifier K+ current. Circ Res 81: 870–878. [DOI] [PubMed] [Google Scholar]
- Mannikko R, Bridgland‐Taylor MH, Pye H, Swallow S, Abi‐Gerges N, Morton MJ et al. (2015). Pharmacological and electrophysiological characterization of AZSMO‐23, an activator of the hERG K+ channel. Br J Pharmacol 172: 3112–3125. [DOI] [PMC free article] [PubMed] [Google Scholar]
- McPate MJ, Duncan RS, Milnes JT, Witchel HJ, Hancox JC (2005). The N588K‐HERG K+ channel mutation in the ‘short QT syndrome’: Mechanism of gain‐in‐function determined at 37°C. Biochem Biophys Res Commun 334: 441–449. [DOI] [PubMed] [Google Scholar]
- McPate MJ, Zhang H, Cordeiro JM, Dempsey CE, Witchel HJ, Hancox JC (2009). hERG1a/1b heteromeric currents exhibit amplified attenuation of inactivation in variant 1 short QT syndrome. Biochem Biophys Res Commun 386: 111–117. [DOI] [PMC free article] [PubMed] [Google Scholar]
- Meng J, Shi C, Li L, Du Y, Xu Y (2013). Compound ICA‐105574 prevents arrhythmias induced by cardiac delayed repolarization. Eur J Pharmacol 718: 87–97. [DOI] [PubMed] [Google Scholar]
- Mitcheson J, Perry M, Stansfeld P, Sanguinetti MC, Witchel H, Hancox J (2005). Structural determinants for high‐affinity block of hERG potassium channels. Novartis Found Symp 266: 136–150. [PubMed] [Google Scholar]
- Phartiyal P, Sale H, Jones EM, Robertson GA (2008). ER retention and rescue by heteromeric assembly regulate hERG 1a/1b surface channel composition. J Biol Chem 283: 3702–3707. [DOI] [PubMed] [Google Scholar]
- Potet F, Lorinc AN, Chaigne S, Hopkins CR, Venkataraman R, Stepanovic SZ et al. (2012). Identification and characterization of a compound that protects cardiac tissue from human ether‐a‐go‐go‐related gene (hERG)‐related drug‐induced arrhythmias. J Biol Chem 287: 39613–39625. [DOI] [PMC free article] [PubMed] [Google Scholar]
- Sale H, Wang J, O'Hara TJ, Tester DJ, Phartiyal P, He JQ et al. (2008). Physiological properties of hERG 1a/1b heteromeric currents and a hERG 1b‐specific mutation associated with long‐QT syndrome. Circ Res 103: e81–e95. [DOI] [PMC free article] [PubMed] [Google Scholar]
- Sanguinetti MC, Jiang C, Curran MF, Keating MT (1995). A mechanistic link between an inherited and an acquired cardiac arrhythmia: HERG encodes the IKr potassium channel. Cell 81: 299–307. [DOI] [PubMed] [Google Scholar]
- Sanguninetti MC, Curran ME, Spector PS, Keating MT (1996). Spectrum of HERG K+‐channel dysfunction in an inherited cardiac arrhythmia. Proc Natl Acad Sci U S A 93: 2208–2212. [DOI] [PMC free article] [PubMed] [Google Scholar]
- Schuster AM, Glassmeier G, Bauer CK (2011). Strong activation of ether‐a‐go‐go‐related gene 1 K+ channel isoforms by NS1643 in human embryonic kidney 293 and Chinese hamster ovary cells. Mol Pharmacol 80: 930–942. [DOI] [PubMed] [Google Scholar]
- Southan C, Sharman JL, Benson HE, Faccenda E, Pawson AJ, Alexander SP et al. (2016). The IUPHAR/BPS Guide to PHARMACOLOGY in 2016: towards curated quantitative interactions between 1300 protein targets and 6000 ligands. Nucl Acids Res 44: D1054–D1068. [DOI] [PMC free article] [PubMed] [Google Scholar]
- Su Z, Limberis J, Souers A, Kym P, Mikhail A, Houseman K et al. (2009). Electrophysiologic characterization of a novel hERG channel activator. Biochem Pharmacol 77: 1383–1390. [DOI] [PubMed] [Google Scholar]
- Trudeau MC, Warmke JW, Ganetzky B, Robertson GA (1995). HERG, a human inward rectifier in the voltage‐gated potassium channel family. Science 269: 92–95. [DOI] [PubMed] [Google Scholar]
- Xu X, Recanatini M, Roberti M, Tseng GN (2008). Probing the binding sites and mechanisms of action of two human ether‐a‐go‐go‐related gene channel activators, 1,3‐bis‐(2‐hydroxy‐5‐trifluoromethyl‐phenyl)‐urea (NS1643) and 2‐[2‐(3,4‐dichloro‐phenyl) 2,3‐dihydro‐1H‐isoindol‐5‐ylamino]‐nicotinic acid (PD307243). Mol Pharmacol 73: 1709–1721. [DOI] [PMC free article] [PubMed] [Google Scholar]
- Zeng H, Lozinskaya IM, Lin Z, Willette RN, Brooks DP, Xu X (2006). Mallotoxin is a novel human ether‐a‐go‐go‐related gene (hERG) potassium channel activator. J Pharmacol Exp Ther 319: 957–962. [DOI] [PubMed] [Google Scholar]
- Zhang H, Zou B, Yu H, Moretti A, Wang X, Yan W et al. (2012). Modulation of hERG potassium channel gating normalizes action potential duration prolonged by dysfunctional KCNQ1 potassium channel. Proc Natl Acad Sci U S A 109: 11866–11871. [DOI] [PMC free article] [PubMed] [Google Scholar]
- Zhou J, Augelli‐Szafran CE, Bradley JA, Chen X, Koci BJ, Volberg WA et al. (2005). Novel potent human ether‐a‐go‐go‐related gene (hERG) potassium channel enhancers and their in vitro antiarrhythmic activity. Mol Pharmacol 68: 876–884. [DOI] [PubMed] [Google Scholar]
- Zou A, Xu QP, Sanguinetti MC (1998). A mutation in the pore region of HERG K+ channels expressed in Xenopus oocytes reduces rectification by shifting the voltage dependence of inactivation. J Physiol 509: 129–137. [DOI] [PMC free article] [PubMed] [Google Scholar]
Associated Data
This section collects any data citations, data availability statements, or supplementary materials included in this article.
Supplementary Materials
Figure S1 ITP‐2 inhibits hERG1b channels. A. Poor functional expression of hERG1b in HEK cells (top). hERG1b current traces in response to ITP‐2 (bottom). Membrane currents were elicited using the protocol shown in Figure 3A inset with an interpulse interval of 20s. Inset shows rapidly deactivating hERG1b tail currents. B. Bar graph showing comparison of ITP‐2 effects on homomeric hERG1a (n = 15) and hERG1b (n = 5) channels at +20 mV.