Abstract
Introduction
In Germany the rate of deliveries by cesarean section is continually increasing. Many different reasons have been put forward to explain this trend. The aim of this study was to examine how the C-section rate developed at the University Gynecology Clinic Rostock, one of the biggest maternity hospitals and level I perinatal centers in Germany, based on various maternal and neonatal parameters. The aim was also to identify potential risk factors for C-sections.
Material and Method
Various obstetric parameters were obtained from the birth cohort (2008 to 2014; n = 20 091) of the University Gynecology Clinic Rostock. The data was used to calculate parameter-specific C-section rates. Potential risk factors for C-section were identified by regression analysis.
Results
The C-section rate dropped from 26.24% to 23.57%. The rate of repeat C-sections also declined. The mean age of the pregnant women increased. Nevertheless, the frequency of cesarean sections in pregnant women aged more than 35 years declined. Rates of being overweight or obese preconception increased. C-section rates increased as BMI values preconception increased. There was a perceptible trend towards attempting the vaginal delivery of children in breech presentation and of twins. The frequency of depressed neonates after vaginal delivery and after C-section decreased. Rates for mild and advanced acidosis increased after both C-sections and vaginal deliveries. Previous C-section, older maternal age, overweight and obesity prior to conception, breech presentation and multiple pregnancies all increased the risk of cesarean sections.
Conclusion
This study showed that reducing the rates of C-sections without a deterioration in neonatal outcomes can be achieved even in a large maternity hospital that cares for many high-risk pregnancies.
Key words: cesarean section, neonatal outcome, breech presentation, twins
Zusammenfassung
Einleitung Die Entbindung mittels Sectio caesarea nimmt in Deutschland stetig zu. Dafür werden vielfältige Gründe diskutiert. Ziel dieser Studie war es, die Entwicklung der Sectiorate an der Universitätsfrauenklinik Rostock, einer der größten Geburtskliniken und Perinatalzentren Level I Deutschlands, in Bezug auf verschiedene mütterliche und kindliche Parameter zu untersuchen. Mögliche Risikofaktoren für einen Kaiserschnitt sollten identifiziert werden.
Material und Methode Im Geburtenkollektiv der Universitätsfrauenklinik Rostock (2008 bis 2014; n = 20 091) wurden verschiedene geburtshilfliche Parameter erfasst. Daraus wurden parameterspezifische Sectioraten berechnet. Mittels Regressionsanalyse wurden mögliche Risikofaktoren für eine Sectio ermittelt.
Ergebnisse Die Sectiorate nahm von 26,24% auf 23,57% ab. Auch die Rate der Re-Sectiones war rückläufig. Das Durchschnittsalter der Schwangeren ist gestiegen. Trotzdem war die Sectiofrequenz bei Schwangeren älter als 35 Jahre rückläufig. Präkonzeptionelles Übergewicht und präkonzeptionelle Adipositas haben zugenommen. Mit steigendem präkonzeptionellen BMI-Wert nahm auch die Sectiorate zu. Bei Kindern in Beckenendlage und Zwillingsgeburten war ein Trend zur vaginalen Geburtsleitung erkennbar. Nach vaginaler Entbindung und Sectio nahm die Häufigkeit deprimierter Neugeborener ab. Leichtgradige und fortgeschrittene Azidosen nahmen sowohl nach Sectio als auch nach vaginalen Entbindungen zu. Zustand nach Sectio, zunehmendes Alter, präkonzeptionelles Übergewicht und Adipositas, Beckenendlage und Mehrlingsschwangerschaft erhöhen das Risiko für eine Sectio.
Schlussfolgerung Mit dieser Untersuchung wurde herausgestellt, dass auch an einer großen Geburtsklinik, die viele Risikoschwangerschaften betreut, eine Senkung der Sectiorate ohne Verschlechterung des neonatalen Outcomes erreichbar ist.
Schlüsselwörter: Kaiserschnitt, neonatales Outcome, Beckenendlage, Mehrlinge
Introduction
In 1985 the World Health Organization recommended that the rate of cesarean sections should not be higher than 10 – 15% of births 1 . Nevertheless, an increase in the rate of C-sections was noted in Germany, rising from 15.3% (in 1991) to 31.1% (in 2015) and increasing in Mecklenburg-Vorpommern from 11.5% (in 1991) to 29.1% (in 2015) 2 . In certain obstetric situations such as transverse presentation, premature placental abruption or uterine rupture, a C-section is absolutely indicated to save the lives of mother and child or ensure that their lives are not in danger. Around 10% of C-sections are carried out because of such absolute indications. The overwhelming majority of C-section indications are relative indications, where the decision for or against a C-section is based on a weighing up of the obstetric risks. They can include a previous history of cesarean section, breech presentation, and multiple births 3 . These indications along with the increasingly older maternal age at pregnancy and maternal comorbidities are often discussed as possible factors for the increased incidence of C-sections 4 , 5 , 6 . Elective C-sections are also often cited as a reason 7 , 8 , 9 , 10 . The fear of legal consequences for birth defects and organizational reasons can also play a role 4 , 10 , 11 .
Even though C-sections are now considered a safe operative procedure, it is important to consider the potential risks. Primary maternal risks include the anesthetic risk, blood loss, infection, thromboembolism, and injuries to internal organs 12 , 13 , 14 . The risk of placentation disorders in any subsequent pregnancy is also increased 15 , 16 . Common respiratory adjustment disorders, a propensity to bronchial asthma and other autoimmune disorders such as atopic dermatitis or food allergies have also been reported for children delivered by cesarean section 17 , 18 , 19 , 20 , 21 , 22 . The precise mechanisms of how such risks develop and the causal connections are still largely not understood and require further study.
This primary focus of this study was to investigate changes in the incidence of C-sections carried out at the University Gynecology Clinic Rostock between 2008 and 2014 and how these are related to various maternal and neonatal parameters. The secondary study objective was to determine the risk factors for C-sections. Results were compared to the findings obtained in a previous analysis of local conditions for the years 1997 to 2003.
Material and Method
Patient cohort, investigated parameters and data collection
In this retrospective study, all births that took place in the University Gynecology Clinic Rostock between 2008 and 2014 were recorded (n = 20 091). Collected parameters included previous history of C-section, maternal age (under 18 years, 18 to 35 years, over 35 years), BMI prior to conception (WHO classification), breech presentation, and whether it was a singleton or multiple birth; these parameters were investigated in relation to the birth procedure “C-section”. Neonatal outcomes were evaluated based on the Apgar scores at 5 minutes (8 – 10 points: healthy newborn, ≤ 7 points: depressed neonate) and umbilical cord arterial pH (UApH) (> 7.29: normal, 7.20 – 7.29: slight increase in acidosis, 7.10 – 7.19: mild acidosis, 7.00 – 7.09: advanced acidosis, < 7.00: severe acidosis) 23 . The parameters were obtained from the obstetric data acquisition system of the University Gynecologic Clinic Rostock. The indications for C-section based on surgery reports were only collected for the years 2012 to 2014, as the medical records for the remaining period were no longer available in the hospital archive.
Statistical analysis
Analysis of the collected data was done using the statistical program IBM SPSS Statistics 20. Data were first analyzed descriptively. Selected parameters were then analyzed for statistical significance with regard to their impact on C-section rates using χ 2 -test and Fisherʼs exact test. p < 0.05 was considered statistically significant. Regression analysis was used to determine whether and to what extent specific parameters correlated with an increased risk of C-section. The confidence interval (CI) was set at 95%.
Results
Births and delivery procedure
The annual number of births rose from 2645 (in 2008) to 3136 (in 2014). The number of spontaneous deliveries and vaginal-surgical deliveries increased. The C-section rate decreased from 26.24% (in 2008) to 23.57% (in 2014) ( Fig. 1 ). The percentage of primary C-sections out of the total number of C-sections dropped from 69.60% (in 2008) to 40.05% (in 2014). However, secondary C-sections increased over the same period ( Fig. 1 ).
Fig. 1.

C-section rate and percentages of primary and secondary C-sections compared to the total number of C-sections performed in one year for the period 2008 to 2014.
Maternal parameters
The percentage of pregnant women who had previously already had one C-section rose from 9.68% (in 2008) to 10.27% (in 2014). During the investigated period, more than 50% of these pregnant women were again delivered by C-section, although the percentage decreased from 58.20% (in 2008) to 56.85% (in 2014). The percentage of primary repeat C-sections decreased in the same period from 85.23% (in 2008) to 67.21% (in 2014).
The mean age of pregnant women increased ( Fig. 2 ). The percentage of pregnant women above the age of 35 years giving birth increased from 11.15% (in 2008) to 12.85% (in 2014). However the rate of C-sections in this cohort of pregnant women decreased from 33.90% (in 2008) to 32.75% (in 2014).
Fig. 2.
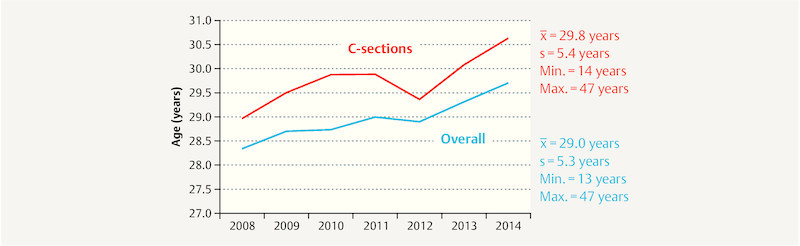
Mean overall maternal age and mean age of women who had a C-section between 2008 and 2014.
Maternal rates of overweight and obesity prior to conception increased ( Table 1 ). Pregnant overweight women and pregnant obese women were more likely to deliver by C-section in each year of the investigated period compared to pregnant women of normal weight.
Table 1 Mean maternal body mass index (BMI, in kg/m 2 ) prior to conception, between 2008 and 2014.
| BMI group | Year | Total | |||||||
|---|---|---|---|---|---|---|---|---|---|
| 2008 | 2009 | 2010 | 2011 | 2012 | 2013 | 2014 | |||
| < 18.50 | n | 142 | 140 | 142 | 113 | 136 | 128 | 138 | 939 |
| % | 5.46 | 5.01 | 4.87 | 4.04 | 4.72 | 4.49 | 4.40 | 4.70 | |
| 18.50 – 24.99 | n | 1694 | 1781 | 1852 | 1765 | 1787 | 1792 | 1920 | 12 591 |
| % | 65.18 | 63.68 | 63.56 | 63.13 | 62.03 | 62.81 | 61.26 | 63.04 | |
| 25.00 – 29.99 | n | 484 | 543 | 560 | 576 | 595 | 565 | 648 | 3971 |
| % | 18.62 | 19.41 | 19.22 | 20.60 | 20.65 | 19.80 | 20.68 | 19.88 | |
| 30.00 – 34.99 | n | 173 | 223 | 236 | 223 | 237 | 232 | 273 | 1597 |
| % | 6.66 | 7.97 | 8.10 | 7.98 | 8.23 | 8.13 | 8.71 | 8.00 | |
| 35.00 – 39.99 | n | 74 | 78 | 83 | 90 | 88 | 97 | 115 | 625 |
| % | 2.85 | 2.79 | 2.85 | 3.22 | 3.05 | 3.40 | 3.67 | 3.13 | |
| ≥ 40.00 | n | 32 | 32 | 41 | 29 | 38 | 39 | 40 | 251 |
| % | 1.23 | 1.14 | 1.41 | 1.04 | 1.32 | 1.37 | 1.28 | 1.26 | |
| Total | n | 2599 | 2797 | 2914 | 2796 | 2881 | 2853 | 3134 | 19 974 |
| % | 100.00 | 100.00 | 100.00 | 100.00 | 100.00 | 100.00 | 100.00 | 100.00 | |
Neonatal parameters
The percentage of children in breech presentation decreased from 7.02% (in 2008) to 5.68% (in 2014). But this did not correlate unequivocally with the decrease in the rate of C-sections. With the exception of 2013 (76.37%), in all other years more than 85% of breech presentation babies were delivered by cesarean section.
The incidence of multiple pregnancies increased from 2.23% (in 2008) to 2.68% (in 2014). The majority of these were twin births. The percentage of C-sections to deliver multiple births decreased from 73.11% (in 2008) to 62.50% (in 2014).
Neonatal outcomes
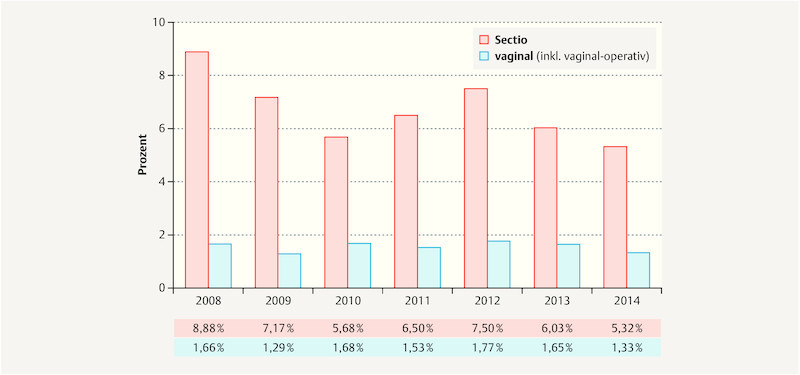
The percentage of depressed neonates following C-section decreased. Despite the drop in the number of C-sections and the rise in the number of vaginal deliveries there was no increase in the number of depressed neonates after vaginal delivery ( Fig. 3 ).
Fig. 3.
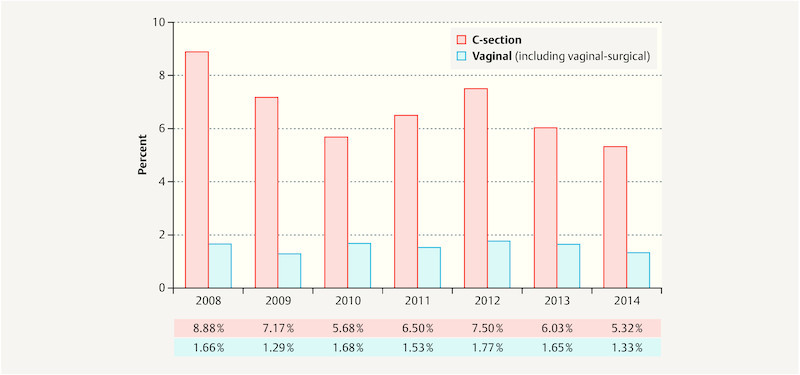
Percentage of depressed neonates with an Apgar score ≤ 7 point at 5 minutes between 2008 and 2014.
Acidosis rates increased following delivery by C-section and following vaginal delivery ( Fig. 4 ). However, only the rates for mild and advanced acidosis increased. Severe acidosis following delivery by C-section declined from an initial figure of 0.83% (in 2008) to 0.51% (in 2014). The rate of severe acidosis after vaginal delivery remained the same at 0.1%.
Fig. 4.
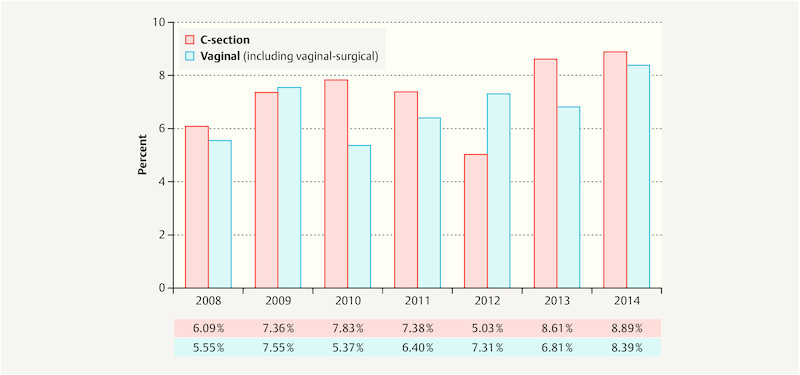
Percentage of newborns with acidosis (UApH < 7.20) between 2008 and 2014.
Indications for C-section
For C-sections performed between 2012 and 2014, breech presentation (14.29%), elective C-section (13.69%), and pathological CTG (10.93%) were the most common indications for delivery by cesarean section. Most elective C-sections were carried out as elective repeat C-sections (48.66%). This was followed by elective C-sections without stating the reason (24.83%) and other elective indications (e.g. following unsuccessful induction of labor, maternal exhaustion; 14.09%).
Risk factors for C-section
A previous C-section increased the risk of being delivered by cesarean section again, compared to pregnant women who had no prior history of C-section. Increasingly older maternal age and higher maternal BMI prior to conception also increased the risk of being delivered by cesarean section compared to pregnant women under the age of 18 years or pregnant women with a BMI < 25.00 kg/m 2 . Breech presentation and multiple pregnancy also increased the risk of delivery by C-section ( Table 2 ).
Table 2 Risk factors for delivery by C-section based on multivariate regression analysis.
| Variable | Odds ratio | 95% CI | p-value |
|---|---|---|---|
| * Reference group | |||
| Prior C-section | |||
|
10.06 | 8.93 – 11.3 | < 0.001 |
| Maternal age | |||
|
1.63 | 1.01 – 2.66 | 0.049 |
|
2.82 | 1.71 – 4.65 | < 0.001 |
| BMI prior to conception | |||
|
1.35 | 1.23 – 1.48 | < 0.001 |
|
1.80 | 1.61 – 2.01 | < 0.001 |
| Breech presentation | |||
|
23.41 | 19.7 – 27.7 | < 0.001 |
| Multiple pregnancy | |||
|
2.18 | 1.69 – 2.81 | < 0.001 |
Discussion
C-section rates during the investigated period decreased from 26.24% (in 2008) to 23.57% (in 2014). This result was contrary to the findings of a previous location analysis which reported an increase in C-section rates from 19.71% (in 1997) to 26.50% (in 2003) 24 . In Germany, overall C-section rates rose from 30.2% (in 2008) to 31.8% (in 2014), and in Mecklenburg-Vorpommern they rose from 27.6% (in 2008) to 29.4% (in 2014), with an interim peak figure von 30.2% (in 2010) 2 . In an analysis of births which occurred in Bern University Hospital (between 1999 and 2009), Mueller et al. reported an average C-section rate of 36.6%. In every individual year, the recorded figures were always over 30%, with the percentages for the years from 2007 to 2009 even topping 40% 9 . Given the fact that the location analyzed in our study was a level I perinatal center where more high-risk pregnancies are cared for, the comparatively low and even declining rates of C-sections are remarkable. An indications training program (obstetrician/midwife) was set up in 2008 to help make the decision whether a C-section is indicated, and interdisciplinary prenatal meetings (obstetrician/neonatologist) on the planned form of delivery for high-risk pregnant women were initiated; both of these changes may have contributed to the decline in C-section rates. Even against the background of an overall rise in legal consequences for medical errors and increasing patient autonomy, this decline in the rate of C-sections is remarkable.
The percentage of primary C-sections decreased while the percentage of secondary C-sections rose. This correlation can be taken as an indication that more pregnant women are now opting for a vaginal delivery after receiving prenatal counselling. If there are maternal and/or fetal problems or complications during the birth, it may be necessary to take the decision to carry out a secondary C-section. However, between 1997 and 2003, the rate of primary C-sections increased from 32.63% (in 1997) to 48.23% (in 2003), while the rate of secondary C-sections dropped correspondingly 24 . Other studies have also reported an increase in the number of primary C-sections and blamed it for the overall rise in C-sections 7 , 12 . It was therefore thought that lowering the rate of primary C-sections would be one way of decreasing the high rates of cesarean sections 25 .
Although more pregnant women had a history of previous C-section, the repeat C-section rate and the percentage of primary repeat C-sections decreased. The percentage of pregnant women who had previously had a C-section was lower between 1997 and 2003. Nevertheless, the rate of repeat C-sections rose in the same period from 52.50% (in 1997) to 59.09% (in 2003). The rate of primary repeat C-sections increased from 40.48% (in 1997) to 66.67% (in 2003) 24 . In contrast, Kyvernitakis et al. reported an average repeat C-section rate of 63.8% for the state of Hesse between 1990 and 2012, which rose from 52.1% (in 1990) to 73.9% (in 2012) 26 .
The mean maternal age at delivery increased both in the overall patient cohort and in the cohort of women who had a C-section. Although the percentage of women who gave birth at a later age increased, the C-section rate in this age cohort declined. Between 1997 and 2003, the mean maternal age rose from 27.90 years (in 1997) to 28.33 years (in 2003), and the mean maternal age of women delivered by C-section increased from 28.75 years (in 1997) to 28.89 years (in 2003). The percentage of pregnant women who were older than 35 years also increased 24 . According to the German Perinatal Survey, the mean age rose from 29.9 years (in 2007) to 30.2 years (in 2011) 27 . A study of women who delivered by cesarean section in a Swiss hospital found an increase from 31.1 years (in 2002) to 32.5 years (in 2008) 28 . Voigt et al. reported a higher rate of C-sections (32.3%) among first-time mothers older than 32 years compared to younger pregnant women (20.7% for women aged 22 to 32 years; 14.5% for women under the age of 22 years). A higher incidence of malpresentation, pathological CTG findings during childbirth, premature rupture of membranes and an increasing number of chronic and pregnancy-related disorders associated with higher maternal age have all been proposed as possible causes 29 . Poorer contractility of the myometrium has also been conjectured to be a further potential reason 30 .
The data from our current study highlight an increase in the percentage of pregnant women who are overweight or obese before conception. Based on an evaluation of the German Perinatal Survey, Scholz et al. showed that the percentage of pregnant women who were overweight at their first antenatal exam increased from 24.9% (in 2007) to 25.4% (in 2011). The obesity incidence has risen continuously from 13.2% (in 2007) to 14.8% (in 2011). The study also recorded an increase in the incidence of obesity during the reference period (from 1995 to 1997). However, both were lower than during the period between 2007 and 2011 27 . A higher incidence of C-sections was found among women who were overweight or obese prior to becoming pregnant compared to women of normal weight. In their analysis of perinatal data from eight German federal states (from 1998 to 2000), Briese et al. reported a C-section rate of 32.3% for pregnant women with a BMI between 40.00 and 44.99 kg/m 2 and a C-section rate of 38.4% for pregnant women with a BMI ≥ 45.00 kg/m 2 compared to a rate of 15.5% for pregnant women of normal weight 31 . In the study by Callaway et al., the mean C-section rate for overweight pregnant women was 29.5%, and the C-section rate for pregnant women with class III obesity was 42.7% 32 . These data show that the rise in overweight and obesity is an extremely serious problem in obstetrics, particularly against a background of possible additional complications (e.g. gestational diabetes mellitus, hypertensive pregnancy disorders, neonatal macrosomia). The higher risk of injury to internal organs, wound healing disorders and, not least, the longer operation time for C-sections and the additional stresses involved for the pregnant women and staff are additional concerns.
During the period under observation the percentage of breech presentations decreased from 7.02% (in 2008) to 5.68% (in 2014). The previous location analysis reported a decrease from 6.30% (in 1997) to 4.67% (in 2003) 24 . With the exception of 2013, more than 85% of breech presentations were delivered by cesarean section. Between 1997 and 2003 the C-section rate for breech presentation was always more than 90% 24 . In a study of children in breech presentation born at term, Hannah et al. reported better outcomes with regard to morbidity and mortality following a planned C-section procedure compared to neonates born after a planned vaginal birth 33 . A study of French perinatal data (from 1994 to 2010) showed a significant increase in C-section rates for breech presentation following the publication of that study 34 . The same correlation was also observed in a Dutch study 35 . Both the French and the Dutch studies registered a slight decrease in the rate of C-sections for breech presentation after 2005 34 , 35 . This could be due to a follow-up study by Whyte et al. which found no difference with regard to death or neurological developmental delay between children in breech presentation delivered vaginally or by C-section by the time the children were two years old 36 . A Canadian study found significantly higher morbidity and mortality rates with higher vaginal delivery rates of breech presentations (≥ 37 GW) compared to delivery by planned C-section 37 . In contrast, Maier et al. found only minor differences in neonatal outcomes (UApH values, base excess, Apgar scores, birth trauma, transfers to the intensive care unit) between vaginal deliveries and delivery by C-section. There were slightly lower UApH values and Apgar scores at 1 minute for vaginal deliveries. The authors concluded that vaginal breech presentation delivery was a safe delivery for pregnant women who were not high-risk and who were attended by an experienced obstetrician 38 . It is clear that no definitive statement on the best mode of delivery for breech presentation currently exists. In recent years, the possibility of vaginal delivery of breech presentation is being considered more often. However, the perinatal risk associated with vaginal delivery of breech presentation should not be ignored. The impact of external cephalic version of breech presentation on reducing the rate of C-sections was not included in our study because the method was only reintroduced gradually into standard clinical practice at the University Gynecology Clinic Rostock since 2012.
Multiple pregnancies, of which the majority consisted of twin births, increased as the rate of C-sections decreased. Between 1997 and 2003 there was an increase in the rate of multiple pregnancies and in the rate of C-sections for these pregnancies, rising from 77.78% (in 1997) to 96.55% (in 2003) 24 . The currently recorded decrease in the percentage of C-sections for multiple pregnancy may be due to the fact that there has been some rethinking in obstetrics with regard to the best way of delivering twin pregnancies when there is no increased risk, with a trend to opt for vaginal delivery. Kyvernitakis et al. noted an increase in the rate of C-sections performed between 1990 and 2012 to deliver twins at university hospitals in Hesse, with the rate rising from 59.0% (in 1990) to 75.8% (in 2012) 39 .
The percentage of depressed neonates decreased both after C-sections and after vaginal delivery. The previous location analysis reported the same correlation but the percentage of depressed neonates in that analysis was still significantly higher 24 . There are different reports in the literature on whether lower Apgar scores are more common after C-sections or not. Arikan et al. found no difference in Apgar scores at 5 minutes between vaginal delivery and delivery by C-section 40 . However Karlström et al. reported a lower percentage of depressed newborns after planned C-sections compared to vaginal deliveries and subsequent emergency C-sections 13 .
The increase in acidosis rates reported for C-sections and vaginal deliveries in the period under observation only referred to rates of mild and advanced acidosis. Rates of severe acidosis did not increase. Although the rate of acidosis after C-sections declined between 1997 and 2003 from 17.82% (in 1997) to 12.29% (in 2003) and the rate of severe acidosis declined from 2.47% (in 1997) to 1.66% (in 2003) 24 , acidosis still occurred significantly more often than in our study. In the previous location analysis, acidosis rates after vaginal delivery remained relatively constant at around 12%. Severe acidosis occurred in 0.1% of cases. The currently identified increase in the rates of mild and advance acidosis, which have a relatively low prognostic value for newborns, should not be categorically viewed as problematic. Consistent testing using fetal blood analysis has resulted, on the one hand, in a reduction in the incidence of C-sections and, on the other hand, in stricter indications for secondary C-sections, particularly in cases with pre-acidosis. The results of our study make it clear that lowering the rate of C-sections did not result in a worsening of neonatal outcomes as measured by lower Apgar scores or severe acidosis. In this context, setting up an interdisciplinary acidosis conference (obstetrician/neonatologist/midwife) for the retrospective analysis of cases of acidosis and critically analyzing the indications for C-section (learning from previous cases and developing strategies for action) have been very important.
Analysis of C-section surgery reports for the period from 2012 to 2014 showed that breech presentation, elective C-section and pathological CTG were the most common indications for C-section. In the previous location analysis, breech presentation was also the most common indication for C-section. Pathological CTG and cephalopelvic disproportion were the second and third most common indications cited 24 . In a British study (for the period 2001 to 2007), previous C-section, failure to progress in labor, pathological CTG and BEL were the most common indications for C-section 41 . According to Timofeev et al., the reasons for C-section differed depending on maternal age. For pregnant women up to the age of 25 years, the indications “failure to progress in labor”, “cephalopelvic disproportion” and “pathological CTG” dominated, while among women giving birth above the age of 25 years “previous C-section” was the most common indication 6 .
The wish to have a repeat cesarean section accounted for the majority of elective C-sections on request. The analysis of a cohort of pregnant women treated at a level 1 perinatal center in Switzerland (from 2002 to 2008) showed an increase in the rate of elective cesarean sections from 2.1% to 5.1% and an increase in the indication “wish to have a repeat C-section” from 0.3% to 1.2%. The differences between their rates and the rates reported for Rostock can be explained that in our study only elective C-sections were included in the calculation whereas the Swiss study included all C-section deliveries. To explain their results, the authors referred to the increasing support of maternal choices by obstetricians, the lack of psychological counselling and the fact that pregnant women interpreted C-sections as a safer way of giving birth 28 . Elective C-sections have often been cited as one reason for the increasing rate of C-sections but, according to the results from a number of studies, this reason appears to be overestimated 7 , 8 , 9 , 42 . It has been surmised that, in fact, elective C-sections are rarely preferred, a surmise was supported by a survey of 534 pregnant women carried out at the University Gynecology Clinic Lübeck on their preferred mode of delivery. In that study, the pregnant women preferred a vaginal delivery. Naturalness, the birth experience, and the presence of an attendant were cited as the main reasons for preferring a vaginal delivery. The safety of the child was the most decisive reason to opt for a C-section. Reasons cited against having a cesarean section were, in the first instance, the operation itself, followed by the potential postoperative pain 43 .
The issue of opting for an elective C-section because of maternal fears has often been discussed. In a Swedish maternity hospital, primiparae who had an elective C-section were more likely to be afraid of giving birth and of the child dying than pregnant women who had a C-section for breech presentation and pregnant women who planned to have a vaginal delivery 44 . Halvorsen et al. were able to show that the rate of cesarean sections dropped and more mothers opted for vaginal delivery when pregnant women who were afraid of giving birth were shown coping strategies 45 . Identifying the fear of giving birth in good time during obstetric counselling and offering support to help pregnant women cope are important strategies to avoid C-sections because of maternal fears.
The quality of the data required for this study depended on the care taken when collecting and entering the data exercised by different hospital staff, which was why occasionally individual datasets were incomplete. If the diagnosis was not coded, then it may have escaped notice that data for the respective parameters remained incomplete. Data collection of the indications for C-section was also incomplete, as medical charts were only available for part of the investigated period. This study investigated several obstetric factors relating to the C-section as the mode of delivery. Further studies could focus on individual factors. Another study could be considered in a few years to find out how the rate of C-sections and the associated parameters and neonatal outcomes continued to develop following this study and the previous location analysis.
Conclusion
The rate of cesarean sections can be lowered at a level I perinatal center without leading to a worsening of neonatal outcomes.
Compared to the previous location analysis (for the period from 1997 to 2003), rates for C-sections during the period investigated in our study dropped, particularly the rates of primary C-sections. The number of primary repeat C-sections also decreased. The lower incidence of C-sections for breech presentation and multiple births are particularly interesting. This indicates that after carefully weighing up the maternal and fetal risks in each individual case, vaginal delivery was often attempted. Neonatal outcomes in terms of the incidence of depressed neonates and of newborns with acidosis also improved, compared to the results of the previous location analysis.
The main instruments which reduced the rate of cesarean sections were:
more intensive counselling and information (“planning”) by obstetricians and midwives and an interdisciplinary prenatal meeting for high-risk pregnant women (obstetrician/neonatologist),
an indications training program (obstetrician/midwife), which has existed since 2008, to help make the decision whether a C-section is indicated or not,
an interdisciplinary acidosis conference of obstetricians, neonatologists and midwives.
Footnotes
Conflict of Interest/Interessenkonflikt The authors declare that they have no conflict of interest. Die Autoren geben an, dass kein Interessenkonflikt besteht.
References/Literatur
- 1.World Health Organization (WHO) . Appropriate technology for birth. Lancet. 1985;326:436–437. [PubMed] [Google Scholar]
- 2.Gesundheitsberichterstattung des Bundes Tabelle (gestaltbar): Entbindungen im Krankenhaus, u.a. nach RegionOnline:http://www.gbe-bund.de/oowa921-install/servlet/oowa/aw92/WS0100/_XWD_FORMPROC?TARGET=&PAGE=_XWD_2&OPINDEX=1&HANDLER=_XWD_CUBE.SETPGS&DATACUBE=_XWD_30&D.000=3736&D.100=10102last access: 03.02.2017
- 3.DGGG – Deutsche Gesellschaft für Gynäkologie und Geburtshilfe Absolute und relative Indikationen zur Sectio caesarea. AWMF-Registernummer: 015/054 (S1) 2010Online:https://www.dggg.de/fileadmin/documents/leitlinien/archiviert/federfuehrend/015054_Absolute_und_relative_Indikationen_zur_Sectio_caesarea/015054_2010.pdflast access: 26.06.2017
- 4.Kolip P, Nolting H D, Zich K.Kaiserschnittgeburten – Entwicklung und regionale Verteilung, Faktencheck GesundheitErstellt im Auftrag der Bertelsmann-Stiftung2012. Online:http://www.bertelsmann-stiftung.de/de/publikationen/publikation/did/faktencheck-gesundheit-kaiserschnitt/last access: 26.06.2017
- 5.Louwen F, Leuchter L M, Reitter A. Beckenendlagengeburt – mehr als Sectio vs. Spontangeburt. Z Geburtshilfe Neonatol. 2012;216:191–194. doi: 10.1055/s-0032-1309052. [DOI] [PubMed] [Google Scholar]
- 6.Timofeev J, Reddy U M, Huang C. Obstetric complications, neonatal morbidity, and indications for cesarean delivery by maternal age. Obstet Gynecol. 2013;122:1184–1195. doi: 10.1097/AOG.0000000000000017. [DOI] [PMC free article] [PubMed] [Google Scholar]
- 7.Barber E L, Lundsberg L S, Belanger K. Indications contributing to the increasing cesarean delivery rate. Obstet Gynecol. 2011;118:29–38. doi: 10.1097/AOG.0b013e31821e5f65. [DOI] [PMC free article] [PubMed] [Google Scholar]
- 8.Karlström A, Rådestad I, Eriksson C. Cesarean section without medical reason, 1997 to 2006: a Swedish register study. Birth. 2010;37:11–20. doi: 10.1111/j.1523-536X.2009.00373.x. [DOI] [PubMed] [Google Scholar]
- 9.Mueller M, Kolly L, Bauman M. Analysis of caesarean section rates over time in a single Swiss centre using a ten-group classification system. Swiss Med Wkly. 2014;144:w13921. doi: 10.4414/smw.2014.13921. [DOI] [PubMed] [Google Scholar]
- 10.Schuller R, Surbek D. Sectio caesarea: Aktuelle Kontroversen. Ther Umsch. 2014;71:717–722. doi: 10.1024/0040-5930/a000617. [DOI] [PubMed] [Google Scholar]
- 11.Fuglenes D, Oian P, Kristiansen I S. Obstetriciansʼ choice of cesarean delivery in ambiguous cases: is it influenced by risk attitude or fear of complaints and litigation? Am J Obstet Gynecol. 2009;200:480–4.8E9. doi: 10.1016/j.ajog.2008.07.021. [DOI] [PubMed] [Google Scholar]
- 12.Branch D W, Silver R M. Managing the primary cesarean delivery rate. Clin Obstet Gynecol. 2012;55:946–960. doi: 10.1097/GRF.0b013e318263c547. [DOI] [PubMed] [Google Scholar]
- 13.Karlström A, Lindgren H, Hildingsson I. Maternal and infant outcome after caesarean section without recorded medical indication: findings from a Swedish case-control study. BJOG. 2013;120:479–486. doi: 10.1111/1471-0528.12129. [DOI] [PubMed] [Google Scholar]
- 14.Hadar E, Melamed N, Tzadikevitch-Geffen K. Timing and risk factors of maternal complications of cesarean section. Arch Gynecol Obstet. 2011;283:735–741. doi: 10.1007/s00404-010-1450-0. [DOI] [PubMed] [Google Scholar]
- 15.Creanga A A, Bateman B T, Butwick A J. Morbidity associated with cesarean delivery in the United States: is placenta accreta an increasingly important contributor? Am J Obstet Gynecol. 2015;213:3840–3.84E13. doi: 10.1016/j.ajog.2015.05.002. [DOI] [PubMed] [Google Scholar]
- 16.Solheim K N, Esakoff T F, Little S E. The effect of cesarean delivery rates on the future incidence of placenta previa, placenta accreta, and maternal mortality. J Matern Fetal Neonatal Med. 2011;24:1341–1346. doi: 10.3109/14767058.2011.553695. [DOI] [PubMed] [Google Scholar]
- 17.Offermann H, Gebauer C, Pulzer F. Cesarean section increases the risk of respiratory adaptive disorders in healthy late preterm and two groups of mature newborns. Z Geburtshilfe Neonatol. 2016;219:259–265. doi: 10.1055/s-0035-1545323. [DOI] [PubMed] [Google Scholar]
- 18.Tita A T, Landon M B, Spong C Y. Timing of elective repeat cesarean delivery at term and neonatal outcomes. N Engl J Med. 2009;360:111–120. doi: 10.1056/NEJMoa0803267. [DOI] [PMC free article] [PubMed] [Google Scholar]
- 19.Metsälä J, Kilkkinen A, Kaila M. Perinatal factors and the risk of asthma in childhood–a population-based register study in Finland. Am J Epidemiol. 2008;168:170–178. doi: 10.1093/aje/kwn105. [DOI] [PubMed] [Google Scholar]
- 20.Thavagnanam S, Fleming J, Bromley A. A meta-analysis of the association between Caesarean section and childhood asthma. Clin Exp Allergy. 2008;38:629–633. doi: 10.1111/j.1365-2222.2007.02780.x. [DOI] [PubMed] [Google Scholar]
- 21.Marrs T, Bruce K D, Logan K. Is there an association between microbial exposure and food allergy? A systematic review. Pediatr Allergy Immunol. 2013;24:311–3.2E10. doi: 10.1111/pai.12064. [DOI] [PubMed] [Google Scholar]
- 22.Penders J, Gerhold K, Stobberingh E E. Establishment of the intestinal microbiota and its role for atopic dermatitis in early childhood. J Allergy Clin Immunol. 2013;132:601–6.07E10. doi: 10.1016/j.jaci.2013.05.043. [DOI] [PubMed] [Google Scholar]
- 23.Saling E. Stuttgart: Thieme; 1966. Das Kind im Bereich der Geburtshilfe. [Google Scholar]
- 24.Stroth M. Rostock: Universität Rostock; 2007. Die Sectio an der Universitätsfrauenklinik Rostock von 1997 – 2003 [Dissertation]
- 25.Zhang J, Troendle J, Reddy U M. Contemporary cesarean delivery practice in the United States. Am J Obstet Gynecol. 2010;203:3260–3.26E12. doi: 10.1016/j.ajog.2010.06.058. [DOI] [PMC free article] [PubMed] [Google Scholar]
- 26.Kyvernitakis I, Reichelt J, Kyvernitakis A. Trends of vaginal birth after cesarean delivery in Germany from 1990 to 2012: a population-based study. Z Geburtshilfe Neonatol. 2014;218:203–209. doi: 10.1055/s-0034-1385920. [DOI] [PubMed] [Google Scholar]
- 27.Scholz R, Voigt M, Schneider K T. Analysis of the German perinatal survey of the years 2007–2011 and comparison with data from 1995–1997: maternal characteristics. Geburtsh Frauenheilk. 2013;73:1247–1251. doi: 10.1055/s-0033-1350830. [DOI] [PMC free article] [PubMed] [Google Scholar]
- 28.Kottmel A, Hoesli I, Traub R. Maternal request: a reason for rising rates of cesarean section? Arch Gynecol Obstet. 2012;286:93–98. doi: 10.1007/s00404-012-2273-y. [DOI] [PubMed] [Google Scholar]
- 29.Voigt M, Rochow N, Zygmunt M. Risks of pregnancy and birth, birth presentation, and mode of delivery in relation to the age of primiparous women. Z Geburtshilfe Neonatol. 2008;212:206–210. doi: 10.1055/s-0028-1098732. [DOI] [PubMed] [Google Scholar]
- 30.Rosenthal A N, Paterson-Brown S. Is there an incremental rise in the risk of obstetric intervention with increasing maternal age? BJOG. 1998;105:1064–1069. doi: 10.1111/j.1471-0528.1998.tb09937.x. [DOI] [PubMed] [Google Scholar]
- 31.Briese V, Voigt M, Wisser J. Risks of pregnancy and birth in obese primiparous women: an analysis of German perinatal statistics. Arch Gynecol Obstet. 2011;283:249–253. doi: 10.1007/s00404-009-1349-9. [DOI] [PMC free article] [PubMed] [Google Scholar]
- 32.Callaway L K, Prins J B, Chang A M. The prevalence and impact of overweight and obesity in an Australian obstetric population. Med J Aust. 2006;184:56–59. doi: 10.5694/j.1326-5377.2006.tb00115.x. [DOI] [PubMed] [Google Scholar]
- 33.Hannah M E, Hannah W J, Hewson S A. Planned caesarean section versus planned vaginal birth for breech presentation at term: a randomised multicentre trial. Lancet. 2000;356:1375–1383. doi: 10.1016/s0140-6736(00)02840-3. [DOI] [PubMed] [Google Scholar]
- 34.Lansac J, Crenn-Hebert C, Rivière O. How singleton breech babies at term are born in France: a survey of data from the AUDIPOG network. Eur J Obstet Gynecol Reprod Biol. 2015;188:79–82. doi: 10.1016/j.ejogrb.2015.02.029. [DOI] [PubMed] [Google Scholar]
- 35.Vlemmix F, Bergenhenegouwen L, Schaaf J M. Term breech deliveries in the Netherlands: did the increased cesarean rate affect neonatal outcome? A population-based cohort study. Acta Obstet Gynecol Scand. 2014;93:888–896. doi: 10.1111/aogs.12449. [DOI] [PubMed] [Google Scholar]
- 36.Whyte H, Hannah M E, Saigal S. Outcomes of children at 2 years after planned cesarean birth versus planned vaginal birth for breech presentation at term: the International Randomized Term Breech Trial. Am J Obstet Gynecol. 2004;191:864–871. doi: 10.1016/j.ajog.2004.06.056. [DOI] [PubMed] [Google Scholar]
- 37.Lyons J, Pressey T, Bartholomew S. Delivery of breech presentation at term gestation in Canada, 2003–2011. Obstet Gynecol. 2015;125:1153–1161. doi: 10.1097/AOG.0000000000000794. [DOI] [PubMed] [Google Scholar]
- 38.Maier B, Georgoulopoulos A, Zajc M. Fetal outcome for infants in breech by method of delivery: experiences with a stand-by service system of senior obstetricians and womenʼs choices of mode of delivery. J Perinat Med. 2011;39:385–390. doi: 10.1515/jpm.2011.044. [DOI] [PubMed] [Google Scholar]
- 39.Kyvernitakis A, Kyvernitakis I, Karageorgiadis A. Rising cesarean rates of twin deliveries in Germany from 1990 to 2012. Z Geburtshilfe Neonatol. 2013;217:177–182. doi: 10.1055/s-0033-1357137. [DOI] [PubMed] [Google Scholar]
- 40.Arikan I, Barut A, Harma M. Cesarean section with relative indications versus spontaneous vaginal delivery: short-term outcomes of maternofetal health. Clin Exp Obstet Gynecol. 2012;39:288–292. [PubMed] [Google Scholar]
- 41.Choudhury A P, Dawson A J. Trends in indications for caesarean sections over 7 years in a Welsh district general hospital. J Obstet Gynaecol. 2009;29:714–717. doi: 10.3109/01443610903191269. [DOI] [PubMed] [Google Scholar]
- 42.Fuglenes D, Aas E, Botten G. Why do some pregnant women prefer cesarean? The influence of parity, delivery experiences, and fear. Am J Obstet Gynecol. 2011;205:450–4.5E10. doi: 10.1016/j.ajog.2011.03.043. [DOI] [PubMed] [Google Scholar]
- 43.Hainer F, Kowalcek I. Wünsche von Schwangeren an den Geburtsmodus. Z Geburtshilfe Neonatol. 2011;215:35–40. doi: 10.1055/s-0031-1271743. [DOI] [PubMed] [Google Scholar]
- 44.Wiklund I, Edman G, Ryding E. Expectation and experiences of childbirth in primiparae with caesarean section. BJOG. 2008;115:324–331. doi: 10.1111/j.1471-0528.2007.01564.x. [DOI] [PubMed] [Google Scholar]
- 45.Halvorsen L, Nerum H, Sørlie T. Does counsellorʼs attitude influence change in a request for a caesarean in women with fear of birth? Midwifery. 2010;26:45–52. doi: 10.1016/j.midw.2008.04.011. [DOI] [PubMed] [Google Scholar]