

Abstract
The search for reliable indicators of biological age, rather than chronological age, has been ongoing for over three decades, and until recently, largely without success. Advances in the fields of molecular biology have increased the variety of potential candidate biomarkers that may be considered as biological age predictors. In this review, we summarize current state-of-the-art findings considering six potential types of biological age predictors: epigenetic clocks, telomere length, transcriptomic predictors, proteomic predictors, metabolomics-based predictors, and composite biomarker predictors. Promising developments consider multiple combinations of these various types of predictors, which may shed light on the aging process and provide further understanding of what contributes to healthy aging. Thus far, the most promising, new biological age predictor is the epigenetic clock; however its true value as a biomarker of aging requires longitudinal confirmation.
Keywords: Aging, Biomarker, Prediction, Epigenetic clock, Telomere length
Highlights
-
•
Telomere length is the most well studied biological age predictor, but many new predictors are emerging.
-
•
The epigenetic clock is currently the best biological age predictor, as it correlates well with age and predicts mortality.
-
•
The various biological age predictors tend to reflect different aspects of the aging process.
1. Introduction
Chronological age is a major risk factor for functional impairments, chronic diseases and mortality. However, there is still great heterogeneity in the health outcomes of older individuals (Lowsky et al., 2014). Some individuals appear frail and require assistance in daily routines already in their 70′s whereas others remain independent of assistance and seem to escape major physiological deterioration until very extreme ages. In keeping with the unprecedented growth rate of the world's aging population, there is a clear need for a better understanding of the biological aging process and the determinants of healthy aging. Towards this aim, a quest for (biological) markers that track the state of biophysiological aging and ideally lend insights to the underlying mechanisms has been embarked upon.
During the past decades, extensive effort has been made to identify such aging biomarkers that, according to the stage-setting definition (Baker and Sprott, 1988), are “biological parameters of an organism that either alone or in some multivariate composite will, in the absence of disease, better predict functional capability at some late age, than will chronological age”. Later on, the American Federation for Aging Research (AFAR) formulated the criteria for aging biomarkers as follows (Johnson, 2006, Butler et al., 2004):
-
1.
It must predict the rate of aging. In other words, it would tell exactly where a person is in their total life span. It must be a better predictor of life span than chronological age.
-
2.
It must monitor a basic process that underlies the aging process, not the effects of disease.
-
3.
It must be able to be tested repeatedly without harming the person. For example, a blood test or an imaging technique.
-
4.
It must be something that works in humans and in laboratory animals, such as mice. This is so that it can be tested in lab animals before being validated in humans.
However, to date, no such marker or marker combination has emerged. Moreover, the existence of such markers has been questioned, because the effects of many chronic diseases are inseparable from normal aging. The rate of biological aging can also vary across different tissues, and hence it may not be feasible to assume a measurable overall rate. On the other hand, as consensus around the definition is missing, the term “aging biomarker” has been widely used in the literature as reviewed in (Lara et al., 2015, Johnson, 2006, Engelfriet et al., 2013).
Recently, several new biomarkers for biological aging have come into play. They can be separated into molecular- (based on DNA, RNA etc.) or phenotypic biomarkers of aging (clinical measures such as blood pressure, grip strength, lipids etc.), although we include both types. The focus of this review is on novel biological age predictors, and we define them as markers that predict chronological age, or at least can separate “young” from “old”. They should also be associated with a normal aging phenotype or a non-communicable age-related disease independent of chronological age in humans (Fig. 1). A list of the final biological age predictors discussed in the paper can be found in Table 1.
Fig. 1.
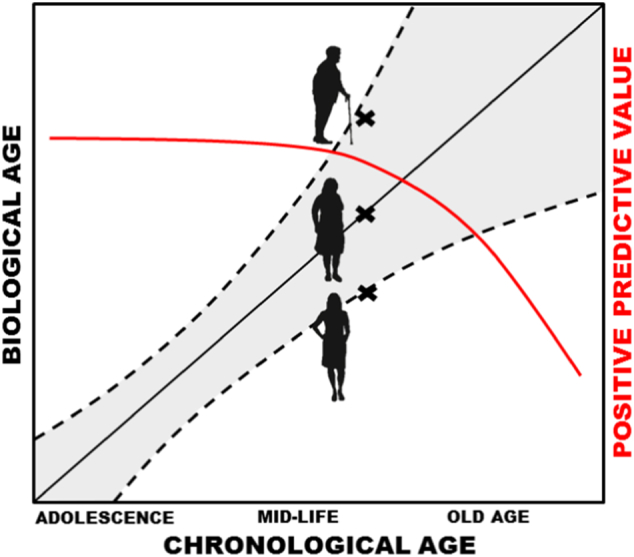
The concept of biological age predictors. A biological age predictor could be defined as a biomarker correlated with chronological age (black line), which brings additive information in the risk assessments for age-related conditions on top of chronological age. Hence, adult individuals of the same chronological age could possess different risks for age-associated diseases as judged from their biological ages (x's in figure). Usually, the positive predictive value (red line) of a biological age predictor decreases from mid-life and onwards due to the increased biological heterogeneity at old age (confidence interval described by dashed lines increases at old age).
Table 1.
Summary of biological age predictors.
| Predictor | Method | Studies, N | Age-associated outcome | References |
|---|---|---|---|---|
| DNAmAge | DNA methylation | 100 + | Mortality, frailty, cognition, physical function, self-rated health, AD, PD, cancer | Horvath (2013), Hannum et al. (2013) |
| Telomere length | qPCR (T/S-ratio), Sothern blot (bp) | 1000 + | Mortality, cancer, CVD, AD, physical function, cognition | Blackburn et al. (2006) |
| Transcriptomic age | Gene expression | 2 | IL-6, urea, albumin, muscle strength, blood pressure, lipids, glucose, BMI, smoking | Holly et al. (2013), Peters et al. (2015) |
| Glycan age | Glycans, proteomics | 1 | Fibrinogen, HbA1c, BMI, triglycerides, uric acid | Kristic et al. (2014) |
| Protein-derived age | Proteomics | 1 | Low birth weight, Framingham risk score | Menni et al. (2015) |
| C-glyTrp | Metabolomics | 1 | Lung function, hip bone mineral density | Menni et al. (2013) |
| Metabolic age score | Metabolomics | 1 | Mortality, kidney function, HbA1c, hyperglyceridemia | Hertel et al. (2016) |
| Composite biomarker | 10 biomarkers combined | 3 | Mortality, IQ, physical function | Levine (2013), Belsky et al. (2015) |
| Composite biomarker | 19 biomarkers in a clustering approach | 1 | Mortality, cancer, CVD, T2D, physical function, cognition | Sebastiani et al. (2017) |
AD, Alzheimer's Disease; PD, Parkinson's Disease; CVD, cardiovascular disease; T2D, type 2 diabetes; IL-6, interleukine 6; BMI, body mass index.
2. Search Strategy and Selection Criteria
PubMed was used as the search engine where Medical Subject Headings (MeSH) terms “Aging” and “Humans” and the specific term for each of the six marker categories: 1) Epigenetic clock, 2) Telomere length, 3) Transcriptomics, 4) Proteomics, 5) Metabolomics, and 6) Multi-biomarker, were combined. Cited papers in the selected publications and papers that referenced the selected publications were also considered. We also searched in bioRxiv using a combination of the following search terms: “aging”, “biomarker”, “humans” and each of the six marker categories described above. The searches were performed between 22nd of November 2016 and 16th of January 2017.
We limited the discussion to those predictors that have been trained/identified in a discovery population of human adults, and then validated in a separate cohort. Only scores derived from multiple measurements, such as different probe signals, were considered (except for telomere length due to its classical role as benchmark biomarker), and studies published in English from 2010 and onwards were included.
2.1. Epigenetic Clock
A number of recent studies have identified a measure of DNA methylation age (DNAmAge), also referred to as the epigenetic clock, as a viable biological age predictor. Two of these clock measures, (Horvath, 2013) and (Hannum et al., 2013) calculators, are currently perhaps the most robust predictors of chronological age. Both of them show high age correlations (r = 0.96 for Horvath and r = 0.91 for Hannum) and small, mean deviations from calendar age (3.6 and 4.9 years, respectively) in their corresponding validation cohorts (Hannum et al., 2013, Horvath, 2013). Both algorithms have been developed in large samples (n = 8000 for Horvath and n = 656 for Hannum) covering the entire adult life span and different ethnic populations. The Horvath clock is a multi-tissue predictor based on methylation levels of 353 CpG sites on the Illumina 27 k array, whereas the Hannum clock uses only 71 CpG sites from the Illumina 450 k array and performs best using whole blood samples. Selection of the CpG sites for both predictors was done using a similar penalized regression model, yet they only have six CpG sites in common. Nevertheless, the correlations between the clocks appear to vary from fairly strong (r = 0.76) (Chen et al., 2016) to moderate (r = 0.37) (Belsky et al., 2016) in independent studies.
2.1.1. DNAmAge and Mortality
The most striking feature of the Horvath and Hannum clocks is their ability to predict all-cause mortality independent of classic risk factors. A recent meta-analysis in 13 different cohorts with a total sample size of 13,089 demonstrated that the epigenetic clock was able to predict all-cause mortality independent of several risk factors such as age, body mass index (BMI), education, smoking, physical activity, alcohol use, smoking and certain comorbidities (Chen et al., 2016). When the authors divided the samples into subgroups by race, sex, follow-up time, BMI, smoking status, physical activity and given comorbidities they could, with some exceptions, observe largely similar mortality associations across subgroups (Chen et al., 2016). Furthermore, they showed that a weighted average of the Hannum clock based on distinct aging-associated blood cell counts outperformed the other clock measures in terms of statistically significant associations with mortality (Chen et al., 2016). Recently, two studies addressed cause-specific mortality predicted by the epigenetic clock, where the clock is a stronger predictor for cancer mortality than cardiovascular disease (Perna et al., 2016, Zheng et al., 2016). In the study by Zheng et al., the results suggested a dose-responsive relationship between increased DNAmAge and cancer incidence and mortality; for each one-year increase in the difference between chronological and epigenetic age (the Δage), there was a 6% increased risk of developing cancer within three years and a 17% increased risk of dying of cancer in the next five years. The fact that the DNAmAges were measured in blood and not in the cancer tissue itself makes these results intriguing. As the authors speculated, the actual link could be attributed immune (blood) cells' role in tumor development via inflammatory mechanisms and pro-apoptotic processes, both of which themselves may accelerate epigenetic aging. Perna and colleagues showed similar results for cancer mortality, however, they concluded that DNAmAge also predicted cardiovascular mortality, even though the cardiovascular analysis had less power and was only significant for the Horvath clock. Furthermore, in line with the sex differences in overall mortality ages, consistent observations of men having higher DNAmAges compared to women have been seen (Horvath et al., 2016, Hannum et al., 2013, Horvath and Ritz, 2015, Marioni et al., 2016, Marioni et al., 2015a). Nevertheless, despite the strong epidemiological evidence, the major issue is the functional role, if any, of DNAmAge in mortality. Longitudinal studies are missing which could shed light on changes of the predictive value over time.
2.1.2. DNAmAge and Aging Phenotypes
Several associations with different aging phenotypes and diseases have been demonstrated. When considering analyses in blood, the clocks correlate with certain blood cell types that also show age-related changes (Marioni et al., 2015a, Chen et al., 2016). Hence, only the cell type-adjusted DNAmAges yield the “pure” clock estimates independent of the changes in cells. Marioni and colleagues were the first to report associations between blood DNAmAge and fitness measures of aging. They observed that age and sex-adjusted Horvath's clock was cross-sectionally associated with poorer cognitive performance (fluid intelligence), lower grip strength and poorer lung function at baseline (Marioni et al., 2015b). The baseline DNAmAge at ∼ 70 years did not, however, predict the rate of change of these fitness measures nor was its change correlated with the changes in the fitness measures during the 6-year follow-up. In a cohort of 38 years-old adults, Belsky and co-authors observed that increased blood-based Hannum's clock, but not Horvath's, was associated with poorer metrics in balance, motor coordination, self-reported physical limitations, cognitive abilities, self-rated health and facial aging but not in grip strength (Belsky et al., 2016). In a recent study of epigenetic age and age-related frailty – a state of vulnerability measured as deficits in multiple bodily systems – Breitling and colleagues discovered that the Horvath clock was directly associated with increased number of deficits (i.e., frailty index) in two cohorts even after accounting for several risk factors and blood cell counts (Breitling et al., 2016). Both the Horvath and the Hannum clock have also demonstrated associations with an increase in BMI and with indicators of the metabolic syndrome (Quach et al., 2017). Based on these findings it seems that the epigenetic clock can indeed reflect aging in different bio-physiological domains and across a wide age range, most notably in cross-sectional settings.
2.1.3. DNAmAge and Diseases of Aging
Several studies addressing associations between age-related diseases and DNAmAge have been conducted. Specifically, acceleration of the Horvath clock in Alzheimer's Disease (AD) patients' prefrontal cortex was associated with the presence of plaques, amyloid load and a decline in global cognitive functioning, episodic memory and working memory (Levine et al., 2015b). However, no associations with cognition and memory were observed in non-demented individuals in the same study. The latter finding is in line with the results of a recent study in middle-aged twins where no associations between blood DNAmAge and cognitive abilities were found (Starnawska et al., 2017). However, when cognition was assessed using psychometric measures direct associations were observed (Belsky et al., 2016, Marioni et al., 2015b). In Parkinson's Disease (PD) patients, although they exhibit markedly elevated (computationally estimated) granulocyte counts, their DNAmAge is still elevated compared to controls after adjusting for blood cell composition (Horvath and Ritz, 2015). The results of this study thus support the hypothesis that peripheral immunoinflammatory characteristics, observed as accelerated methylome aging of blood cells, are involved in PD. As regards to cancer, the Hannum clock shows increased epigenetic age in the tested tumor tissues (Hannum et al., 2013), whereas the Horvath clock assigns increased DNAmAges only to certain cancer types (Horvath, 2013). Nevertheless, increased blood DNAmAge has been shown to predict the incidence of lung cancer (Levine et al., 2015a), other cancers as well as cancer mortality (Zheng et al., 2016, Perna et al., 2016). Lastly, in osteoarthritis the Horvath clock in the joint of the affected cartilage, but not in nearby bone or blood, was associated increased epigenetic age (Vidal-Bralo et al., 2016).
2.1.4. DNAmAge and Other Biomarkers
Correlations between DNAmAge and telomere length, as well as with clinical measures, have generally been low or non-significant (Belsky et al., 2016, Marioni et al., 2016, Breitling et al., 2016). DNAmAge and telomere length are associated with age and mortality independently of each other (Marioni et al., 2016). In addition, the cell-type adjusted Horvath clock is not associated with common disease risk factors such as alcohol use, smoking, diabetes, hypertension, and the levels of high- and low density lipoproteins, insulin, glucose, triglycerides, C-reactive protein (CRP) and creatinine (Horvath et al., 2016). Another interesting feature of the epigenetic clock is that offspring of semi-supercentenarians exhibit lower epigenetic age than age-matched controls (Horvath et al., 2015). As centenarians are an excellent example of successful, healthy agers who managed to escape or postpone the onset of major aging diseases, their offspring's youthful DNAmAge could indicate that common (genetic or shared environmental) factors matters for protection from aging diseases and DNAmAge maintenance.
2.1.5. Potential Mechanisms
Currently it is not entirely clear what aspect(s) of physiological or cellular aging the epigenetic clocks represent. Although the original paper on the epigenetic clock (Horvath, 2013) demonstrated that the clock estimate is close to zero in embryonic and induced pluripotent stem cells, it correlates with cell passage number, and the ticking rate is highest during organismal growth, it is not purely a mitotic clock since it tracks chronological age in non-proliferative tissue such as brain as well. Recent experimental work in primary endothelial cells demonstrated that cells that were forced into replicative senescence and oncogene-induced senescence exhibited increased epigenetic aging, measured using the Horvath clock, whereas cells whose senescence was induced by DNA damage did not. Hence, the authors concluded that epigenetic aging is an intrinsic property of the cells that is uncoupled from senescence per se (Lowe et al., 2016). This conclusion is somewhat in line with the interpretation by Horvath (Horvath, 2013) that the DNAmAge measure represents the function of the epigenetic maintenance system. Hormonal factors may also play a role as late menopause is associated with lower DNAmAge and menopause itself also seems to accelerate epigenetic aging (Levine et al., 2016). To date only one genome-wide association study (GWAS) has reported genetic associations for the epigenetic clock. The results of this GWAS suggest that variants near an mTOR complex2 gene (MLST8) and in a putative RNA-helicase (DHX57) are associated with epigenetic age, yet only in the cerebellum (Lu et al., 2016). Moreover, the intrinsic Horvath clock has been suggested to represent overall frailty in the body while the Hannum clock is more related to immune responses (Horvath and Ritz, 2015).
Taken together, the epigenetic clock appears to be associated with a wide spectrum of aging outcomes, most consistently mortality. Its predictability is observable in several different tissues, suggesting a pervasive, systems-level mechanism. However, as the epigenetic clock concept is still in its infancy, it is likely that many negative findings have remained unreported. Furthermore, there is a lack of evidence for mortality prediction by the epigenetic clock in tissues other than blood. Lastly, the epigenetic aging rate in one tissue can be quite different from that of another and for biomarker purposes, it is not realistic to obtain a combination of epigenetic age estimates in several tissues. With advances in technologies and increased coverage of arrays, it is likely that a better understanding of DNA methylation will soon be achieved. The remaining unresolved questions are if, and if so how, the clock's ticking rate is modifiable and whether the methylation changes seen with age and aging phenotypes actually drive the phenotypes, or whether they merely represent the work of other genomic control mechanisms, such as histone regulation.
2.2. Telomere Length
Telomeres are repetitive DNA sequences capping chromosomes, which shorten every time cells divide; thus, telomere length is a popular marker of biological aging (Blackburn et al., 2006). Today, > 6000 publications exist on the topic “telomere length”. Many excellent reviews have been written on basic function (Blackburn et al., 2015), associations with aging (Sanders and Newman, 2013), on the trade-off between cellular senescence and regeneration (Stone et al., 2016), and the article by Passos in this special issue on aging, just to mention a few. Hence, this review will focus only on summarizing what is known from large-scale and meta-analysis studies on associations between telomere length and age-associated traits, as well as address telomere length in relation to other biological markers. To start with, a meta-analysis on 36,230 participants (Gardner et al., 2014), and the largest population-based telomere length study to date (n = 105,539) (Lapham et al., 2015), concluded that women on average have longer telomeres than men. Hence, women have a lower biological age than men as judged from the telomere lengths, which is in accordance with measures of the DNAmAge. This observation might be related to the increased longevity seen in women, all discussed in detail elsewhere (Barrett and Richardson, 2011), but important to keep in mind when looking at associations between telomere length and disease. Thus, associations reported below were found in analyses adjusted for age and sex.
Although no meta-analysis on mortality has been reported yet, the association between short telomeres and increased mortality risk has been shown repeatedly in many studies (Needham et al., 2015, Bakaysa et al., 2007, Deelen et al., 2014), and recently in a large cohort study (n = 64,637) (Rode et al., 2015). Unlike the epigenetic clock, telomere length seems to work equally well for cancer and cardiovascular mortality predictions, and as alluded to above, the effect is independent of the epigenetic clock. However, a meta-analysis on telomere length and overall cancer risk (23,379 cases and 68,792 controls) showed a null result, indicating that telomeres may play different roles for different cancers (Zhu et al., 2016). Short telomeres were found to be risk factors for gastrointestinal, head and neck cancers only. Furthermore, short telomere length has been described as a risk factor for coronary heart disease as judged from a meta-analysis of 43,725 participants (8400 events) (Haycock et al., 2014), and from a large-scale observational study (Scheller Madrid et al., 2016). In fact, this relationship has been suggested to be causal by inferring genetic information (Scheller Madrid et al., 2016, Codd et al., 2013). Likewise, in AD patients, telomere lengths have been shown to be shorter, both in observational (Forero et al., 2016a) and causal Mendelian Randomization (Zhan et al., 2015) studies. For PD, only small studies exist with inconclusive results (Forero et al., 2016b). Telomeres have also been associated with many age-related traits such as cognition and physical function. However, studies, and even meta-analysis efforts, are often small with limited conclusions (Gardner et al., 2013). Technical bias in the measurement of telomere lengths may also contribute to the lack of consistent results. For further reading on telomeres and traits related to aging we suggest another review (Mather et al., 2011). To conclude, the suggestive epidemiological evidence for a causal role of telomeres in aging diseases is challenging current knowledge and needs to be further investigated, preferably in longitudinal studies. The discussion around cause or consequence is valid not only for telomeres, but for all biomarkers of aging and is important for future perspectives of healthy aging.
2.3. Transcriptomic Predictors
To date, two blood-based sets of gene expression profiles have been developed that fulfill our criteria for a transcriptomic age predictor. The first profile is a five-transcript predictor presented by Holly and colleagues (Holly et al., 2013) who developed it by truncating their previous six-transcript model that could distinguish young individuals (< 65 years) from old (≥ 75 years) in the InCHIANTI cohort (Harries et al., 2011). The five-transcript predictor was tested in two additional cohorts (Exeter 10,000, n = 95) and the San Antonio Family Heart Study (SAFHS, n = 1240) together with the InCHIANTI data set (n = 698) (Holly et al., 2013). The authors demonstrated that lower levels of interleukin-6 (IL-6) and blood urea, as well as higher levels of serum albumin and muscle strength, were found in the biologically young group compared to the rest. However, no differences were observed for physical function, CRP, systolic blood pressure, and hematocrit.
The second transcriptomic predictor was based on the expression levels of 1497 transcripts in European ancestry populations (Peters et al., 2015). The model was trained in 7074 human blood samples from six independent cohorts. The analyses were adjusted for sex, cell counts, smoking and fasting status (where available), as well as for technical array variables. The predictor was replicated in 7909 blood samples from seven independent cohorts, and a high agreement (r = 0.972) was observed between the results of the discovery and replication sets. Correlations between transcriptomic age and chronological age within the cohorts ranged from to 0.348 to 0.744 and the average absolute differences between the predicted transcriptomic age and chronological age ranged from 4.84 to 11.21 years (mean = 7.8 years). However, there was only partial overlap in the direction of change in the 1497 transcripts among cerebellum, frontal cortex and distinct blood cell sub-types, as well as with blood samples from other ancestries. This is not surprising given that gene expression profiles tend to be tissue-specific. In the combined analysis of all cohorts, Peters and co-authors observed higher Δage, which reflects increased biological/transcriptomic aging, directly associated with higher systolic and diastolic blood pressure, total cholesterol, HDL cholesterol, fasting glucose levels and BMI (Peters et al., 2015). Current smokers also exhibited higher Δages even after adjusting for BMI. Interestingly, the authors also examined the correlations between their transcriptomic predictor and Horvath's and Hannum's epigenetic clocks in two of the cohorts. The correlations between the transcriptomic and the epigenetic predictors ranged from 0.10 to 0.33, and besides the waist-to-hip ratio they did not show similar associations with the examined aging phenotypes. Hence, it appears that the transcriptomic age and the epigenetic clock describe different aspects of biological aging. When simultaneously examining multiple cohorts that have their transcriptomic profiles produced using different array platforms, it is critical to control for technical variables and probe design to ascertain whether the signatures are truly platform-independent. Nevertheless, the transcriptomic age predictors still await broader validation in independent cohort studies.
2.4. Proteomic Predictors
Over the last two decades, several studies have shown effects of aging on protein glycosylation as measured from human serum or plasma (Pucic et al., 2011, Ruhaak et al., 2010, Parekh et al., 1988, Ruhaak et al., 2011, Knezevic et al., 2010). However, most studies were based on non-targeted approaches in single cohorts, making validation across studies impossible. Recently, Kristic´ and colleagues made an effort of combining four European cohorts to study IgG glycosylation in aging (Kristic et al., 2014). A prediction model for age based on three individual glycans, the GlycanAge, was built in one cohort, and replicated well in the others (among which TwinsUK was included). The GlycanAge index was associated with health variables such as fibrinogen, HbA1c, BMI, triglycerides and uric acid after correction for age and sex.
Likewise, individual studies for investigating the effect of age on the proteome have been conducted in human plasma and cerebrospinal fluid (Zhang et al., 2005, Ignjatovic et al., 2011, Lu et al., 2012, Baird et al., 2012). The only attempt thus far to develop an age predictor was done by Menni and co-workers who calculated a protein-derived age variable from four age-associated proteins found in plasma (PTN, CHRDL1, MMP12, and IGFP6) (Menni et al., 2015). The predictor (trained in TwinsUK data) was validated in independent cohorts, and one of the proteins, CHRDL1, was associated with low birth weight, the Framingham risk score and other cardiometabolic risk factors after adjustment for age. However, the protein-derived age variable itself was not tested for associations with health outcomes.
2.5. Metabolomics-based Predictors
Relatively few studies have analyzed associations with age on the metabolome (also referred to as the metabonome), and they were conducted using different measurement techniques (Ishikawa et al., 2014, Yu et al., 2012, Menni et al., 2013, Hertel et al., 2016, Collino et al., 2013, Lawton et al., 2008). Yu and colleagues used a targeted mass-spectrometry method identifying 131 metabolites in fasting serum, where 11 were independently associated with age in females, both in discovery (KORA F4) and replication (TwinsUK), after BMI adjustments (Yu et al., 2012). Later, the same groups combined analyses of non-targeted mass-spectrometry and age using the Metabolon platform (Menni et al., 2013). Here, TwinsUK was the discovery cohort where 22 independent age-associated metabolites, mostly lipids and amino acids, were found. One selected metabolite, C-glyTrp, was further replicated in KORA F4, and associated with age-related traits such as lung function and hip bone mineral density after adjustments for age.
In a study from 2016 by Hertel and colleagues, a proton nuclear magnetic resonance (H1 NMR) spectroscopy investigation in human urine samples quantified 59 metabolites (Hertel et al., 2016). Construction of a Metabolic Age Score included all metabolites as predictors and age as the outcome. The metabolic age score was validated and replicated in two independent cohorts, and found to associate with clinical outcomes independent of age, e.g., kidney malfunction, high HbA1c levels, and hyperglyceridemia. Importantly, survival analysis showed that individuals in the first tertile of the score (lower biological age) had higher all-cause survival rates, and that the prediction added value over commonly known risk factors.
2.6. Composite Biomarker Predictors
Other attempts to identify age-related biomarkers focus on combining multiple biomarkers into a biological age predictor. In a study by Levine from 2013, ten biomarkers significantly associated with chronological age (CRP, serum creatinine, glycated hemoglobin, systolic blood pressure, serum albumin, total cholesterol, cytomegalovirus optical density, serum alkaline phosphatase, forced expiratory volume, and serum urea nitrogen) were combined into a biological age predictor in the NHANES III study (n = 9389) (Levine, 2013). Most of the biomarkers were also significant in sex-stratified analyses and no sex differences for the age predictor were reported. Using Cox proportional hazards, the final ten-biomarker age predictor was associated with mortality independent of chronological age. The same predictor model was further validated in the Dunedin study, which is a younger birth cohort (n = 1037) followed longitudinally (Belsky et al., 2015). In cross-sectional analyses at age 38, participants with higher biological age scored worse on IQ-tests and physical function measures such as balance, strength and motor coordination. Similar results were found for longitudinal changes of biological age, as measured over 12 years, and health outcomes. A somewhat different approach was recently presented by Sebastiani et al., where 19 biomarkers correlated with age were used to cluster 4704 participants of the family-based LLFS cohort into 26 different clusters independent of age and sex. Validation was done in the FHS study where classification of the 26 clusters had a sensitivity ranging from 36% to 100%, which was better than random. Moreover, correlations of the biomarker signatures with longitudinal changes in physical function and cognition, as well as proportional hazards for incident diseases and mortality, were found significant (Sebastiani et al., 2017).
A follow-up study by Belsky and co-authors included measures on the epigenetic clock and telomere length in combination with the composite biomarker predictor from Levine in the Dunedin study (Belsky et al., 2016). The correlations between the composite predictor and Horvath and Hannum DNAmAge were weak (r = 0.08 and r = 0.15 respectively) but significant. However, no correlation with telomere length was observed. Health outcomes such as IQ and physical function measured in the Dunedin participants seem to be best predicted by the composite biomarker age, then by DNAmAge and not at all by telomere length. Overall, one type of biological age predictor correlates weakly with other types of predictors, hence indicating that effects are mostly independent of each other, or at least not measurable with these methods.
Finally, a study using TwinsUK data applied a multi-omics approach to investigate relationships between different biomarkers of aging (Zierer et al., 2016). Several biological age predictors have been investigated in those data, as discussed above, and here epigenetic, metabolomic, transcriptomic and glycomic measures were combined into graphical models. Unfortunately, instead of using pre-defined age predictors, multiple single markers were inferred in the models, making comparisons to earlier studies and interpretations difficult. Nevertheless, linking many different data types and disentangling the relationship between different biological age predictors may shed light on the aging process and provide further understanding of what contributes to healthy aging.
3. Biological Age Predictors in Animals
At the outset, we limited our review to studies in humans. Although the AFAR criteria for aging biomarkers include also working in animal model systems, this is not yet a reality. For the epigenetic clock, some evidence exists of its functionality in great apes (Horvath, 2013), but not in species with more divergent genomes from humans. For telomere length there have primarily been studies in rodents, but also in birds, wild animals and C. elegans to mention a few. However, in mice the telomere maintenance system works differently compared to in humans and they have longer telomeres not reaching the same critical lengths in spite of their short life span (Calado and Dumitriu, 2013). Transcriptomic studies have been performed extensively in mice and rat models, some also with the objective of finding genes associated with aging (Yang et al., 2016). However, as far as we are aware, there have not been any biological age predictors trained and tested in those data. Further, comparisons between humans and rodents are always problematic because of different arrays used and missing homologous gene sequences. Likewise, most omics-data analyses suffer from the same challenges. Thus, considering our selection criteria of independent validation and prediction of health outcomes, none of our proposed biological age predictors are valid in any type of animal model. Nevertheless, though not falling within our definition of biological aging predictors, it should be noted there is a wealth of evidence, for example, on the markers at the insulin/insulin-like growth factor axis that demonstrate utility as markers of longevity and healthy aging both in humans and across the animal kingdom.
4. Conclusions and Future Questions
In this review, we have summarized current knowledge on biological age predictors and discussed different data types used. There are several existing predictors, where the most plausible candidates are the epigenetic clock and telomere length. They have both been tested in different tissues and validated in many independent cohorts, as indicated by the number of studies in Table 1. However, they all work by providing additional evidence on individual aging independent of chronological age, and they successfully predict health outcomes such as physical function, cognition, morbidity and mortality. In an attempt to make an overview of the conclusions, we illustrated the number of studies versus the strength in mortality prediction by the biological age predictors where applicable (Fig. 2). Briefly, telomere length is extensively validated but has low predictive power. The composite biomarker is not validated enough but has the potential to be a stronger predictor than telomeres, as is the Metabolic Age Score. The epigenetic clock currently performs the best considering both aspects. Other biological age predictors may prove to be useful, but would require further independent validation. Yet others, such as miRNAs and ncRNAs, may emerge as a new class of aging markers once there is more research; the current knowledge on these markers rests largely on their regulatory role in development.
Fig. 2.
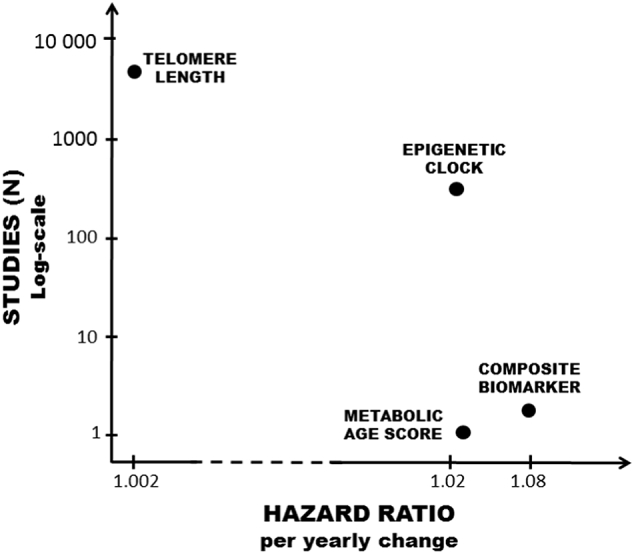
Number of studies versus mortality hazards for the biological age predictors. Overview of the four biological age predictors telomere length (Rode et al., 2015), epigenetic clock (Chen et al., 2016), Metabolic Age Score (Hertel et al., 2016), and composite biomarker (Levine, 2013) which have all been used in survival models. The hazard ratio per yearly change in biological age (de-)acceleration for each predictor is presented on the x-axis. The y-axis presents an approximation of the number of studies on a log-scale where the predictor has been used.
There is no doubt about the escalated interest in predicting biological age. Given the global aging phenomenon, this trend is not going to end anytime soon. It is imperative that we find a validated set of markers that can predict the health span rather than only focus on mortality and lifespan. This could include marker combinations, e.g. a set of physiologic, genomic and blood-based determinants, that predict the years a person would spend being free from frailty before death. Ideally, this marker combination would be a useful indicator both in mid- and late-life. There are, however, a number of challenges in identifying biomarkers in humans, beyond the technical issues noted above and heterogeneity due to cell count. These include our access to longitudinal data, the vast variability we see among humans, and potential for confounding.
Nevertheless, we thus far have little clue about the mechanisms by which biological age predictors work. There have been discussions around the underlying aspects of the epigenetic clock, whether they are describing cellular ticking or something else (see earlier discussion under heading 1). However, we do not yet know what is cause or consequence of the epigenetic clock. A recent study suggested that adiposity causes epigenetic changes and not the contrary (Wahl et al., 2017). On the other hand, when it comes to other biological age predictors, telomere length has been suggested to have a causal effect on health outcomes, and not just being a marker of such (see discussion under heading 2). Additional longitudinal data are necessary to further confirm the causal nature. Moreover, data also suggest that most of the biological age predictors we have discussed have little or no interaction with each other. Thus, effects are independent of each other and may therefore be describing different parts of the aging process. A combination of markers would increase the predictive power and should be further studied in larger samples. In summary, combinations of biological age predictors may be used to monitor the face of aging, with the overall goal of increasing the individual health span and decreasing health care burden.
Funding Sources
This work was supported by the Swedish Council for Working Life and Social Research (FAS/FORTE) (97:0147:1B, 2009-0795, 2013-2292), the Swedish Research Council (825-2007-7460, 825-2009-6141, 521-2013-8689, 2015-03255), JPND-Swedish Research Council 2015-06796, Karolinska Institutet Foundation (2016fobi47694), the Loo & Hans Osterman Foundation (2016oste46143, 2015oste44168), the Foundation for Geriatric Diseases (2014alde42284), the Magnus Bergwall Foundation (2015-00836), the Foundation for Gamla Tjänarinnor (2015-00162) and by Erik Rönnbergs donation for scientific studies in aging and age-related diseases.
Conflicts of Interest
The authors have no conflicts of interests to declare.
Author Contributions
Outline of the review: JJ, NLP, SH. Performed the search: JJ, SH. Wrote the manuscript: JJ, NLP, SH.
Acknowledgments
We would like to thank Alexander Ploner for advice on the figures.
Contributor Information
Juulia Jylhävä, Email: juulia.jylhava@ki.se.
Nancy L. Pedersen, Email: nancy.pedersen@ki.se.
Sara Hägg, Email: sara.hagg@ki.se.
References
- Baird G.S., Nelson S.K., Keeney T.R., Stewart A., Williams S., Kraemer S., Peskind E.R., Montine T.J. Age-dependent changes in the cerebrospinal fluid proteome by slow off-rate modified aptamer array. Am. J. Pathol. 2012;180:446–456. doi: 10.1016/j.ajpath.2011.10.024. [DOI] [PMC free article] [PubMed] [Google Scholar]
- Bakaysa S.L., Mucci L.A., Slagboom P.E., Boomsma D.I., Mcclearn G.E., Johansson B., Pedersen N.L. Telomere length predicts survival independent of genetic influences. Aging Cell. 2007;6:769–774. doi: 10.1111/j.1474-9726.2007.00340.x. [DOI] [PubMed] [Google Scholar]
- Baker G.T., 3rd, Sprott R.L. Biomarkers of aging. Exp. Gerontol. 1988;23:223–239. doi: 10.1016/0531-5565(88)90025-3. [DOI] [PubMed] [Google Scholar]
- Barrett E.L., Richardson D.S. Sex differences in telomeres and lifespan. Aging Cell. 2011;10:913–921. doi: 10.1111/j.1474-9726.2011.00741.x. [DOI] [PubMed] [Google Scholar]
- Belsky D.W., Caspi A., Houts R., Cohen H.J., Corcoran D.L., Danese A., Harrington H., Israel S., Levine M.E., Schaefer J.D., Sugden K., Williams B., Yashin A.I., Poulton R., Moffitt T.E. Quantification of biological aging in young adults. Proc. Natl. Acad. Sci. U. S. A. 2015;112:E4104–E4110. doi: 10.1073/pnas.1506264112. [DOI] [PMC free article] [PubMed] [Google Scholar]
- Belsky D.W., Moffitt T.E., Cohen A.A., Corcoran D.L., Levine M.E., Prinz J., Schaefer J., Sugden K., Williams B., Poulton R., Caspi A. Telomere, epigenetic clock, and biomarker-composite quantifications of biological aging: Do they measure the same thing? bioRxiv. 2016 doi: 10.1093/aje/kwx346. [DOI] [PMC free article] [PubMed] [Google Scholar]
- Blackburn E.H., Epel E.S., Lin J. Human telomere biology: a contributory and interactive factor in aging, disease risks, and protection. Science. 2015;350:1193–1198. doi: 10.1126/science.aab3389. [DOI] [PubMed] [Google Scholar]
- Blackburn E.H., Greider C.W., Szostak J.W. Telomeres and telomerase: the path from maize, tetrahymena and yeast to human cancer and aging. Nat. Med. 2006;12:1133–1138. doi: 10.1038/nm1006-1133. [DOI] [PubMed] [Google Scholar]
- Breitling L.P., Saum K.U., Perna L., Schottker B., Holleczek B., Brenner H. Frailty is associated with the epigenetic clock but not with telomere length in a German cohort. Clin. Epigenetics. 2016;8:21. doi: 10.1186/s13148-016-0186-5. [DOI] [PMC free article] [PubMed] [Google Scholar]
- Butler R.N., Sprott R., Warner H., Bland J., Feuers R., Forster M., Fillit H., Harman S.M., Hewitt M., Hyman M., Johnson K., Kligman E., Mcclearn G., Nelson J., Richardson A., Sonntag W., Weindruch R., Wolf N. Biomarkers of aging: from primitive organisms to humans. J. Gerontol. A Biol. Sci. Med. Sci. 2004;59:B560–B567. doi: 10.1093/gerona/59.6.b560. [DOI] [PubMed] [Google Scholar]
- Calado R.T., Dumitriu B. Telomere dynamics in mice and humans. Semin. Hematol. 2013;50:165–174. doi: 10.1053/j.seminhematol.2013.03.030. [DOI] [PMC free article] [PubMed] [Google Scholar]
- Chen B.H., Marioni R.E., Colicino E., Peters M.J., Ward-caviness C.K., Tsai P.C., Roetker N.S., Just A.C., Demerath E.W., Guan W., Bressler J., Fornage M., Studenski S., Vandiver A.R., Moore A.Z., Tanaka T., Kiel D.P., Liang L., Vokonas P., Schwartz J., Lunetta K.L., Murabito J.M., Bandinelli S., Hernandez D.G., Melzer D., Nalls M., Pilling l.C., Price T.R., Singleton A.B., Gieger C., Holle R., Kretschmer A., Kronenberg F., Kunze S., Linseisen J., Meisinger C., Rathmann W., Waldenberger M., Visscher P.M., Shah S., Wray N.R., Mcrae A.F., Franco O.H., Hofman A., Uitterlinden A.G., Absher D., Assimes T., Levine M.E., Lu A.T., Tsao P.S., Hou L., Manson J.E., Carty C.L., Lacroix A.Z., Reiner A.P., Spector T.D., Feinberg A.P., Levy D., Baccarelli A., Van Meurs J., Bell J.T., Peters A., Deary I.J., Pankow J.S., Ferrucci L., Horvath S. DNA methylation-based measures of biological age: meta-analysis predicting time to death. Aging (Albany NY) 2016;8:1844–1865. doi: 10.18632/aging.101020. [DOI] [PMC free article] [PubMed] [Google Scholar]
- Codd V., Nelson C.P., Albrecht E., Mangino M., Deelen J., Buxton J.L., Hottenga J.J., Fischer K., Esko T., Surakka I., Broer L., Nyholt D.R., Mateo Leach I., Salo P., Hagg S., Matthews M.K., Palmen J., Norata G.D., O'reilly P.F., Saleheen D., Amin N., Balmforth A.J., Beekman M., De Boer R.A., Bohringer S., Braund P.S., Burton P.R., Craen A.J., Denniff M., Dong Y., Douroudis K., Dubinina E., Eriksson J.G., Garlaschelli K., Guo D., Hartikainen A.L., Henders A.K., Houwing-Duistermaat J.J., Kananen L., Karssen L.C., Kettunen J., Klopp N., Lagou V., Van Leeuwen E.M., Madden P.A., Magi R., Magnusson P.K., Mannisto S., Mccarthy M.I., Medland S.E., Mihailov E., Montgomery G.W., Oostra B.A., Palotie A., Peters A., Pollard H., Pouta A., Prokopenko I., Ripatti S., Salomaa V., Suchiman H.E., Valdes A.M., Verweij N., Vinuela A., Wang X., Wichmann H.E., Widen E., Willemsen G., Wright M.J., Xia K., Xiao X., Van Veldhuisen D.J., Catapano A.L., Tobin M.D., Hall A.S., Blakemore A.I., Van Gilst W.H., Zhu H., Consortium C., Erdmann J., Reilly M.P., Kathiresan S., Schunkert H., Talmud P.J., Pedersen N.L., Perola M., Ouwehand W., Kaprio J., Martin N.G., Van Duijn C.M., Hovatta I., Gieger C., Metspalu A., Boomsma D.I., Jarvelin M.R., Slagboom P.E., Thompson J.R., Spector T.D., Van Der Harst P., Samani N.J. Identification of seven loci affecting mean telomere length and their association with disease. Nat. Genet. 2013;45:422–427. doi: 10.1038/ng.2528. [DOI] [PMC free article] [PubMed] [Google Scholar]
- Collino S., Montoliu I., Martin F.P., Scherer M., Mari D., Salvioli S., Bucci L., Ostan R., Monti D., Biagi E., Brigidi P., Franceschi C., Rezzi S. Metabolic signatures of extreme longevity in northern Italian centenarians reveal a complex remodeling of lipids, amino acids, and gut microbiota metabolism. PLoS One. 2013;8 doi: 10.1371/journal.pone.0056564. [DOI] [PMC free article] [PubMed] [Google Scholar]
- Deelen J., Beekman M., Codd V., Trompet S., Broer L., Hagg S., Fischer K., Thijssen P.E., Suchiman H.E., Postmus I., Uitterlinden A.G., Hofman A., De Craen A.J., Metspalu A., Pedersen N.L., Van Duijn C.M., Jukema J.W., Houwing-Duistermaat J.J., Samani N.J., Slagboom P.E. Leukocyte telomere length associates with prospective mortality independent of immune-related parameters and known genetic markers. Int. J. Epidemiol. 2014;43:878–886. doi: 10.1093/ije/dyt267. [DOI] [PMC free article] [PubMed] [Google Scholar]
- Engelfriet P.M., Jansen E.H., Picavet H.S., Dolle M.E. Biochemical markers of aging for longitudinal studies in humans. Epidemiol. Rev. 2013;35:132–151. doi: 10.1093/epirev/mxs011. [DOI] [PMC free article] [PubMed] [Google Scholar]
- Forero D.A., Gonzalez-Giraldo Y., Lopez-Quintero C., Castro-Vega L.J., Barreto G.E., Perry G. Meta-analysis of telomere length in Alzheimer's disease. J. Gerontol. A Biol. Sci. Med. Sci. 2016;71:1069–1073. doi: 10.1093/gerona/glw053. [DOI] [PMC free article] [PubMed] [Google Scholar]
- Forero D.A., Gonzalez-Giraldo Y., Lopez-Quintero C., Castro-Vega L.J., Barreto G.E., Perry G. Telomere length in Parkinson's disease: a meta-analysis. Exp. Gerontol. 2016;75:53–55. doi: 10.1016/j.exger.2016.01.002. [DOI] [PMC free article] [PubMed] [Google Scholar]
- Gardner M., Bann D., Wiley L., Cooper R., Hardy R., Nitsch D., Martin-Ruiz C., Shiels P., Sayer A.A., Barbieri M., Bekaert S., Bischoff C., Brooks-Wilson A., Chen W., Cooper C., Christensen K., DE Meyer T., Deary I., Der G., Diez Roux A., Fitzpatrick A., Hajat A., Halaschek-Wiener J., Harris S., Hunt S.C., Jagger C., Jeon H.S., Kaplan R., Kimura M., Lansdorp P., Li C., Maeda T., Mangino M., Nawrot T.S., Nilsson P., Nordfjall K., Paolisso G., Ren F., Riabowol K., Robertson T., Roos G., Staessen J.A., Spector T., Tang N., Unryn B., Van Der Harst P., Woo J., Xing C., Yadegarfar M.E., Park J.Y., Young N., Kuh D., Von Zglinicki T., Ben-Shlomo Y., Halcyon Study T. Gender and telomere length: systematic review and meta-analysis. Exp. Gerontol. 2014;51:15–27. doi: 10.1016/j.exger.2013.12.004. [DOI] [PMC free article] [PubMed] [Google Scholar]
- Gardner M.P., Martin-Ruiz C., Cooper R., Hardy R., Sayer A.A., Cooper C., Deary I.J., Gallacher J., Harris S.E., Shiels P.G., Starr J.M., Kuh D., Von Zglinicki T., Ben-Shlomo Y., Halcyon Study T. Telomere length and physical performance at older ages: an individual participant meta-analysis. PLoS One. 2013;8 doi: 10.1371/journal.pone.0069526. [DOI] [PMC free article] [PubMed] [Google Scholar]
- Hannum G., Guinney J., Zhao L., Zhang L., Hughes G., Sadda S., Klotzle B., Bibikova M., Fan J.B., Gao Y., Deconde R., Chen M., Rajapakse I., Friend S., Ideker T., Zhang K. Genome-wide methylation profiles reveal quantitative views of human aging rates. Mol. Cell. 2013;49:359–367. doi: 10.1016/j.molcel.2012.10.016. [DOI] [PMC free article] [PubMed] [Google Scholar]
- Harries L.W., Hernandez D., Henley W., Wood A.R., Holly A.C., Bradley-Smith R.M., Yaghootkar H., Dutta A., Murray A., Frayling T.M., Guralnik J.M., Bandinelli S., Singleton A., Ferrucci L., Melzer D. Human aging is characterized by focused changes in gene expression and deregulation of alternative splicing. Aging Cell. 2011;10:868–878. doi: 10.1111/j.1474-9726.2011.00726.x. [DOI] [PMC free article] [PubMed] [Google Scholar]
- Haycock P.C., Heydon E.E., Kaptoge S., Butterworth A.S., Thompson A., Willeit P. Leucocyte telomere length and risk of cardiovascular disease: systematic review and meta-analysis. BMJ. 2014;349:g4227. doi: 10.1136/bmj.g4227. [DOI] [PMC free article] [PubMed] [Google Scholar]
- Hertel J., Friedrich N., Wittfeld K., Pietzner M., Budde K., Van DER Auwera S., Lohmann T., Teumer A., Volzke H., Nauck M., Grabe H.J. Measuring biological age via Metabonomics: the metabolic age score. J. Proteome Res. 2016;15:400–410. doi: 10.1021/acs.jproteome.5b00561. [DOI] [PubMed] [Google Scholar]
- Holly A.C., Melzer D., Pilling L.C., Henley W., Hernandez D.G., Singleton A.B., Bandinelli S., Guralnik J.M., Ferrucci L., Harries L.W. Towards a gene expression biomarker set for human biological age. Aging Cell. 2013;12:324–326. doi: 10.1111/acel.12044. [DOI] [PMC free article] [PubMed] [Google Scholar]
- Horvath S. DNA methylation age of human tissues and cell types. Genome Biol. 2013;14:R115. doi: 10.1186/gb-2013-14-10-r115. [DOI] [PMC free article] [PubMed] [Google Scholar]
- Horvath S., Gurven M., Levine M.E., Trumble B.C., Kaplan H., Allayee H., Ritz B.R., Chen B., Lu A.T., Rickabaugh T.M., Jamieson B.D., Sun D., Li S., Chen W., Quintana-Murci L., Fagny M., Kobor M.S., Tsao P.S., Reiner A.P., Edlefsen K.L., Absher D., Assimes T.L. An epigenetic clock analysis of race/ethnicity, sex, and coronary heart disease. Genome Biol. 2016;17:171. doi: 10.1186/s13059-016-1030-0. [DOI] [PMC free article] [PubMed] [Google Scholar]
- Horvath S., Pirazzini C., Bacalini M.G., Gentilini D., Di Blasio A.M., Delledonne M., Mari D., Arosio B., Monti D., Passarino G., De Rango F., D'Aquila P., Giuliani C., Marasco E., Collino S., Descombes P., Garagnani P., Franceschi C. Decreased epigenetic age of PBMCs from Italian semi-supercentenarians and their offspring. Aging (Albany NY) 2015;7:1159–1170. doi: 10.18632/aging.100861. [DOI] [PMC free article] [PubMed] [Google Scholar]
- Horvath S., Ritz B.R. Increased epigenetic age and granulocyte counts in the blood of Parkinson's disease patients. Aging (Albany NY) 2015;7:1130–1142. doi: 10.18632/aging.100859. [DOI] [PMC free article] [PubMed] [Google Scholar]
- Ignjatovic V., Lai C., Summerhayes R., Mathesius U., Tawfilis S., Perugini M.A., Monagle P. Age-related differences in plasma proteins: how plasma proteins change from neonates to adults. PLoS One. 2011;6:e17213. doi: 10.1371/journal.pone.0017213. [DOI] [PMC free article] [PubMed] [Google Scholar]
- Ishikawa M., Maekawa K., Saito K., Senoo Y., Urata M., Murayama M., Tajima Y., Kumagai Y., Saito Y. Plasma and serum lipidomics of healthy white adults shows characteristic profiles by subjects' gender and age. PLoS One. 2014;9:e91806. doi: 10.1371/journal.pone.0091806. [DOI] [PMC free article] [PubMed] [Google Scholar]
- Johnson T.E. Recent results: biomarkers of aging. Exp. Gerontol. 2006;41:1243–1246. doi: 10.1016/j.exger.2006.09.006. [DOI] [PubMed] [Google Scholar]
- Knezevic A., Gornik O., Polasek O., Pucic M., Redzic I., Novokmet M., Rudd P.M., Wright A.F., Campbell H., Rudan I., Lauc G. Effects of aging, body mass index, plasma lipid profiles, and smoking on human plasma N-glycans. Glycobiology. 2010;20:959–969. doi: 10.1093/glycob/cwq051. [DOI] [PubMed] [Google Scholar]
- Kristic J., Vuckovic F., Menni C., Klaric L., Keser T., Beceheli I., Pucic-Bakovic M., Novokmet M., Mangino M., Thaqi K., Rudan P., Novokmet N., Sarac J., Missoni S., Kolcic I., Polasek O., Rudan I., Campbell H., Hayward C., Aulchenko Y., Valdes A., Wilson J.F., Gornik O., Primorac D., Zoldos V., Spector T., Lauc G. Glycans are a novel biomarker of chronological and biological ages. J. Gerontol. A Biol. Sci. Med. Sci. 2014;69:779–789. doi: 10.1093/gerona/glt190. [DOI] [PMC free article] [PubMed] [Google Scholar]
- Lapham K., Kvale M.N., Lin J., Connell S., Croen L.A., Dispensa B.P., Fang L., Hesselson S., Hoffmann T.J., Iribarren C., Jorgenson E., Kushi L.H., Ludwig D., Matsuguchi T., Mcguire W.B., Miles S., Quesenberry C.P., Rowell S., Sadler M., Sakoda L.C., Smethurst D., Somkin C.P., Van Den Eeden S.K., Walter L., Whitmer R.A., Kwok P.Y., Risch N., Schaefer C., Blackburn E.H. Automated assay of telomere length measurement and informatics for 100,000 subjects in the genetic epidemiology research on adult health and aging (GERA) cohort. Genetics. 2015;200:1061–1072. doi: 10.1534/genetics.115.178624. [DOI] [PMC free article] [PubMed] [Google Scholar]
- Lara J., Cooper R., Nissan J., Ginty A.T., Khaw K.T., Deary I.J., Lord J.M., Kuh D., Mathers J.C. A proposed panel of biomarkers of healthy ageing. BMC Med. 2015;13:222. doi: 10.1186/s12916-015-0470-9. [DOI] [PMC free article] [PubMed] [Google Scholar]
- Lawton K.A., Berger A., Mitchell M., Milgram K.E., Evans A.M., Guo L., Hanson R.W., Kalhan S.C., Ryals J.A., Milburn M.V. Analysis of the adult human plasma metabolome. Pharmacogenomics. 2008;9:383–397. doi: 10.2217/14622416.9.4.383. [DOI] [PubMed] [Google Scholar]
- Levine M.E. Modeling the rate of senescence: can estimated biological age predict mortality more accurately than chronological age? J. Gerontol. A Biol. Sci. Med. Sci. 2013;68:667–674. doi: 10.1093/gerona/gls233. [DOI] [PMC free article] [PubMed] [Google Scholar]
- Levine M.E., Hosgood H.D., Chen B., Absher D., Assimes T., Horvath S. DNA methylation age of blood predicts future onset of lung cancer in the women's health initiative. Aging (Albany NY) 2015;7:690–700. doi: 10.18632/aging.100809. [DOI] [PMC free article] [PubMed] [Google Scholar]
- Levine M.E., Lu A.T., Bennett D.A., Horvath S. Epigenetic age of the pre-frontal cortex is associated with neuritic plaques, amyloid load, and Alzheimer's disease related cognitive functioning. Aging (Albany NY) 2015;7:1198–1211. doi: 10.18632/aging.100864. [DOI] [PMC free article] [PubMed] [Google Scholar]
- Levine M.E., Lu A.T., Chen B.H., Hernandez D.G., Singleton A.B., Ferrucci L., Bandinelli S., Salfati E., Manson J.E., Quach A., Kusters C.D., Kuh D., Wong A., Teschendorff A.E., Widschwendter M., Ritz B.R., Absher D., Assimes T.L., Horvath S. Menopause accelerates biological aging. Proc. Natl. Acad. Sci. U. S. A. 2016;113:9327–9332. doi: 10.1073/pnas.1604558113. [DOI] [PMC free article] [PubMed] [Google Scholar]
- Lowe D., Horvath S., Raj K. Epigenetic clock analyses of cellular senescence and ageing. Oncotarget. 2016;7:8524–8531. doi: 10.18632/oncotarget.7383. [DOI] [PMC free article] [PubMed] [Google Scholar]
- Lowsky D.J., Olshansky S.J., Bhattacharya J., Goldman D.P. Heterogeneity in healthy aging. J. Gerontol. A Biol. Sci. Med. Sci. 2014;69:640–649. doi: 10.1093/gerona/glt162. [DOI] [PMC free article] [PubMed] [Google Scholar]
- Lu A.T., Hannon E., Levine M.E., Hao K., Crimmins E.M., Lunnon K., Kozlenkov A., Mill J., Dracheva S., Horvath S. Genetic variants near MLST8 and DHX57 affect the epigenetic age of the cerebellum. Nat. Commun. 2016;7:10561. doi: 10.1038/ncomms10561. [DOI] [PMC free article] [PubMed] [Google Scholar]
- Lu J., Huang Y., Wang Y., Li Y., Zhang Y., Wu J., Zhao F., Meng S., Yu X., Ma Q., Song M., Chang N., Bittles A.H., Wang W. Profiling plasma peptides for the identification of potential ageing biomarkers in Chinese Han adults. PLoS One. 2012;7:e39726. doi: 10.1371/journal.pone.0039726. [DOI] [PMC free article] [PubMed] [Google Scholar]
- Marioni R.E., Harris S.E., Shah S., Mcrae A.F., Von Zglinicki T., Martin-Ruiz C., Wray N.R., Visscher P.M., Deary I.J. The epigenetic clock and telomere length are independently associated with chronological age and mortality. Int. J. Epidemiol. 2016 doi: 10.1093/ije/dyw041. [DOI] [PMC free article] [PubMed] [Google Scholar]
- Marioni R.E., Shah S., Mcrae A.F., Chen B.H., Colicino E., Harris S.E., Gibson J., Henders A.K., Redmond P., Cox S.R., Pattie A., Corley J., Murphy L., Martin N.G., Montgomery G.W., Feinberg A.P., Fallin M.D., Multhaup M.L., JAFFE A.E., Joehanes R., Schwartz J., Just A.C., Lunetta K.L., Murabito J.M., Starr J.M., Horvath S., Baccarelli A.A., Levy D., Visscher P.M., Wray N.R., Deary I.J. DNA methylation age of blood predicts all-cause mortality in later life. Genome Biol. 2015;16:25. doi: 10.1186/s13059-015-0584-6. [DOI] [PMC free article] [PubMed] [Google Scholar]
- Marioni R.E., Shah S., Mcrae A.F., Ritchie S.J., Muniz-Terrera G., Harris S.E., Gibson J., Redmond P., COX S.R., Pattie A., Corley J., Taylor A., Murphy L., Starr J.M., Horvath S., Visscher P.M., Wray N.R., Deary I.J. The epigenetic clock is correlated with physical and cognitive fitness in the Lothian Birth Cohort 1936. Int. J. Epidemiol. 2015;44:1388–1396. doi: 10.1093/ije/dyu277. [DOI] [PMC free article] [PubMed] [Google Scholar]
- Mather K.A., Jorm A.F., Parslow R.A., Christensen H. Is telomere length a biomarker of aging? A review. J. Gerontol. A Biol. Sci. Med. Sci. 2011;66:202–213. doi: 10.1093/gerona/glq180. [DOI] [PubMed] [Google Scholar]
- Menni C., Kastenmuller G., Petersen A.K., Bell J.T., Psatha M., Tsai P.C., Gieger C., Schulz H., Erte I., John S., Brosnan M.J., Wilson S.G., Tsaprouni L., Lim E.M., Stuckey B., Deloukas P., Mohney R., Suhre K., Spector T.D., Valdes A.M. Metabolomic markers reveal novel pathways of ageing and early development in human populations. Int. J. Epidemiol. 2013;42:1111–1119. doi: 10.1093/ije/dyt094. [DOI] [PMC free article] [PubMed] [Google Scholar]
- Menni C., Kiddle S.J., Mangino M., Vinuela A., Psatha M., Steves C., Sattlecker M., Buil A., Newhouse S., Nelson S., Williams S., Voyle N., Soininen H., Kloszewska I., Mecocci P., Tsolaki M., Vellas B., Lovestone S., Spector T.D., Dobson R., Valdes A.M. Circulating proteomic signatures of chronological age. J. Gerontol. A Biol. Sci. Med. Sci. 2015;70:809–816. doi: 10.1093/gerona/glu121. [DOI] [PMC free article] [PubMed] [Google Scholar]
- Needham B.L., Rehkopf D., Adler N., Gregorich S., Lin J., Blackburn E.H., Epel E.S. Leukocyte telomere length and mortality in the National Health and Nutrition Examination Survey, 1999-2002. Epidemiology. 2015;26:528–535. doi: 10.1097/EDE.0000000000000299. [DOI] [PMC free article] [PubMed] [Google Scholar]
- Parekh R., Roitt I., Isenberg D., Dwek R., Rademacher T. Age-related galactosylation of the N-linked oligosaccharides of human serum IgG. J. Exp. Med. 1988;167:1731–1736. doi: 10.1084/jem.167.5.1731. [DOI] [PMC free article] [PubMed] [Google Scholar]
- Perna L., Zhang Y., Mons U., Holleczek B., Saum K.U., Brenner H. Epigenetic age acceleration predicts cancer, cardiovascular, and all-cause mortality in a German case cohort. Clin. Epigenetics. 2016;8:64. doi: 10.1186/s13148-016-0228-z. [DOI] [PMC free article] [PubMed] [Google Scholar]
- Peters M.J., Joehanes R., Pilling L.C., Schurmann C., Conneely K.N., Powell J., Reinmaa E., Sutphin G.L., Zhernakova A., Schramm K., Wilson Y.A., Kobes S., Tukiainen T., Consortium N.U., Ramos Y.F., Goring H.H., Fornage M., Liu Y., Gharib S.A., Stranger B.E., De Jager P.L., Aviv A., Levy D., Murabito J.M., Munson P.J., Huan T., Hofman A., Uitterlinden A.G., Rivadeneira F., Van Rooij J., Stolk L., Broer L., Verbiest M.M., Jhamai M., ARP P., Metspalu A., Tserel L., Milani L., Samani N.J., Peterson P., Kasela S., Codd V., Peters A., Ward-Caviness C.K., Herder C., Waldenberger M., Roden M., Singmann P., Zeilinger S., Illig T., Homuth G., Grabe H.J., Volzke H., Steil L., Kocher T., Murray A., Melzer D., Yaghootkar H., Bandinelli S., Moses E.K., Kent J.W., Curran J.E., Johnson M.P., Williams-Blangero S., Westra H.J., mcrae A.F., Smith J.A., Kardia S.L., Hovatta I., Perola M., Ripatti S., Salomaa V., Henders A.K., Martin N.G., Smith A.K., Mehta D., Binder E.B., Nylocks K.M., Kennedy E.M., Klengel T., Ding J., Suchy-Dicey A.M., Enquobahrie D.A., Brody J., Rotter J.I., Chen Y.D., Houwing-Duistermaat J., Kloppenburg M., Slagboom P.E., Helmer Q., Den Hollander W., Bean S., Raj T., Bakhshi N., Wang Q.P., Oyston L.J., Psaty B.M., Tracy R.P., Montgomery G.W., Turner S.T. The transcriptional landscape of age in human peripheral blood. Nat. Commun. 2015;6:8570. doi: 10.1038/ncomms9570. [DOI] [PMC free article] [PubMed] [Google Scholar]
- Pucic M., Knezevic A., Vidic J., Adamczyk B., Novokmet M., Polasek O., Gornik O., Supraha-Goreta S., Wormald M.R., Redzic I., Campbell H., Wright A., Hastie N.D., Wilson J.F., Rudan I., Wuhrer M., Rudd P.M., Josic D., Lauc G. High throughput isolation and glycosylation analysis of IgG-variability and heritability of the IgG glycome in three isolated human populations. Mol. Cell. Proteomics. 2011;10(M111):010090. doi: 10.1074/mcp.M111.010090. [DOI] [PMC free article] [PubMed] [Google Scholar]
- Quach A., Levine M.E., Tanaka T., Lu A.T., Chen B.H., Ferrucci L., Ritz B., Bandinelli S., Neuhouser M.L., Beasley J.M., Snetselaar L., Wallace R.B., Tsao P.S., Absher D., Assimes T.L., Stewart J.D., Li Y., Hou L., Baccarelli A.A., Whitsel E.A., Horvath S. Epigenetic clock analysis of diet, exercise, education, and lifestyle factors. Aging (Albany NY) 2017;9:419–446. doi: 10.18632/aging.101168. [DOI] [PMC free article] [PubMed] [Google Scholar]
- Rode L., Nordestgaard B.G., Bojesen S.E. Peripheral blood leukocyte telomere length and mortality among 64,637 individuals from the general population. J. Natl. Cancer Inst. 2015;107:djv074. doi: 10.1093/jnci/djv074. [DOI] [PubMed] [Google Scholar]
- Ruhaak L.R., Uh H.W., Beekman M., Hokke C.H., Westendorp R.G., Houwing-Duistermaat J., Wuhrer M., Deelder A.M., Slagboom P.E. Plasma protein N-glycan profiles are associated with calendar age, familial longevity and health. J. Proteome Res. 2011;10:1667–1674. doi: 10.1021/pr1009959. [DOI] [PubMed] [Google Scholar]
- Ruhaak L.R., Uh H.W., Beekman M., Koeleman C.A., Hokke C.H., Westendorp R.G., Wuhrer M., Houwing-Duistermaat J.J., Slagboom P.E., Deelder A.M. Decreased levels of bisecting GlcNAc glycoforms of IgG are associated with human longevity. PLoS One. 2010;5:e12566. doi: 10.1371/journal.pone.0012566. [DOI] [PMC free article] [PubMed] [Google Scholar]
- Sanders J.L., Newman A.B. Telomere length in epidemiology: a biomarker of aging, age-related disease, both, or neither? Epidemiol. Rev. 2013;35:112–131. doi: 10.1093/epirev/mxs008. [DOI] [PMC free article] [PubMed] [Google Scholar]
- Scheller Madrid A., Rode L., Nordestgaard B.G., Bojesen S.E. Short telomere length and ischemic heart disease: observational and genetic studies in 290 022 individuals. Clin. Chem. 2016;62:1140–1149. doi: 10.1373/clinchem.2016.258566. [DOI] [PubMed] [Google Scholar]
- Sebastiani P., Thyagarajan B., SUN F., Schupf N., newman A.B., Montano M., Perls T.T. Biomarker signatures of aging. Aging Cell. 16(2), 2017, 329–338 doi: 10.1111/acel.12557. [DOI] [PMC free article] [PubMed] [Google Scholar]
- Starnawska A., Tan Q., Lenart A., Mcgue M., Mors O., Borglum A.D., Christensen K., Nyegaard M., Christiansen L. Blood DNA methylation age is not associated with cognitive functioning in middle-aged monozygotic twins. Neurobiol. Aging. 2017;50:60–63. doi: 10.1016/j.neurobiolaging.2016.10.025. [DOI] [PubMed] [Google Scholar]
- Stone R.C., Horvath K., Kark J.D., Susser E., Tishkoff S.A., Aviv A. Telomere length and the cancer-atherosclerosis trade-off. PLoS Genet. 2016;12:e1006144. doi: 10.1371/journal.pgen.1006144. [DOI] [PMC free article] [PubMed] [Google Scholar]
- Wahl S., Drong A., Lehne B., Loh M., Scott W.R., Kunze S., Tsai P.C., Ried J.S., Zhang W., Yang Y., Tan S., Fiorito G., Franke L., Guarrera S., Kasela S., Kriebel J., Richmond R.C., Adamo M., Afzal U., Ala-Korpela M., Albetti B., Ammerpohl O., Apperley J.F., Beekman M., Bertazzi P.A., Black S.L., Blancher C., Bonder M.J., Brosch M., Carstensen-Kirberg M., De Craen A.J., De Lusignan S., Dehghan A., Elkalaawy M., Fischer K., Franco O.H., Gaunt T.R., Hampe J., Hashemi M., Isaacs A., Jenkinson A., Jha S., Kato N., Krogh V., Laffan M., Meisinger C., Meitinger T., Mok Z.Y., Motta V., Ng H.K., Nikolakopoulou Z., Nteliopoulos G., Panico S., Pervjakova N., Prokisch H., Rathmann W., Roden M., Rota F., Rozario M.A., Sandling J.K., Schafmayer C., Schramm K., Siebert R., Slagboom P.E., Soininen P., Stolk L., Strauch K., Tai E.S., Tarantini L., Thorand B., Tigchelaar E.F., Tumino R., Uitterlinden A.G., Van Duijn C., Van Meurs J.B., Vineis P., Wickremasinghe A.R., Wijmenga C., Yang T.P., Yuan W., Zhernakova A., Batterham R.L., Smith G.D., Deloukas P., Heijmans B.T., Herder C., Hofman A., Lindgren C.M., Milani L., Van Der Harst P., Peters A., Illig T., Relton C.L., Waldenberger M., Jarvelin M.R., Bollati V., Soong R., Spector T.D., Scott J., Mccarthy M.I. Epigenome-wide association study of body mass index, and the adverse outcomes of adiposity. Nature. 2017;541:81–86. doi: 10.1038/nature20784. [DOI] [PMC free article] [PubMed] [Google Scholar]
- Vidal-Bralo L., Lopez-Golan Y., Mera-Varela A., Rego-Perez I., Horvath S., zhang Y., Del Real A., Zhai G., Blanco F.J., Riancho J.A., Gomez-Reino J.J., Gonzalez A. Specific premature epigenetic aging of cartilage in osteoarthritis. Aging (Albany NY) 2016;8:2222–2231. doi: 10.18632/aging.101053. [DOI] [PMC free article] [PubMed] [Google Scholar]
- Yang Y., Teng Z., Meng S., Yu, W. Identification of potential key lncRNAs and genes associated with aging based on microarray data of adipocytes from mice. Biomed. Res. Int. 2016;2016:9181702. doi: 10.1155/2016/9181702. [DOI] [PMC free article] [PubMed] [Google Scholar]
- Yu Z., Zhai G., Singmann P., He Y., Xu T., Prehn C., Romisch-Margl W., Lattka E., Gieger C., Soranzo N., Heinrich J., Standl M., Thiering E., Mittelstrass K., Wichmann H.E., Peters A., Suhre K., LI Y., Adamski J., Spector T.D., Illig T., Wang-Sattler R. Human serum metabolic profiles are age dependent. Aging Cell. 2012;11:960–967. doi: 10.1111/j.1474-9726.2012.00865.x. [DOI] [PMC free article] [PubMed] [Google Scholar]
- Zhan Y., Song C., Karlsson R., Tillander A., Reynolds C.A., Pedersen N.L., Hägg S. Telomere length shortening and Alzheimer disease—a Mendelian randomization study. JAMA Neurol. 2015;72 doi: 10.1001/jamaneurol.2015.1513. [DOI] [PubMed] [Google Scholar]
- Zhang J., Goodlett D.R., Peskind E.R., Quinn J.F., Zhou Y., Wang Q., Pan C., Yi E., Eng J., Aebersold R.H., Montine T.J. Quantitative proteomic analysis of age-related changes in human cerebrospinal fluid. Neurobiol. Aging. 2005;26:207–227. doi: 10.1016/j.neurobiolaging.2004.03.012. [DOI] [PubMed] [Google Scholar]
- Zheng Y., Joyce B.T., Colicino E., Liu L., Zhang W., Dai Q., Shrubsole M.J., Kibbe W.A., GAO T., Zhang Z., Jafari N., Vokonas P., Schwartz J., Baccarelli A.A., Hou L. Blood epigenetic age may predict cancer incidence and mortality. EBioMedicine. 2016;5:68–73. doi: 10.1016/j.ebiom.2016.02.008. [DOI] [PMC free article] [PubMed] [Google Scholar]
- Zhu X., Han W., Xue W., Zou Y., Xie C., Du J., Jin G. The association between telomere length and cancer risk in population studies. Sci Rep. 2016;6:22243. doi: 10.1038/srep22243. [DOI] [PMC free article] [PubMed] [Google Scholar]
- Zierer J., Pallister T., Tsai P.C., Krumsiek J., Bell J.T., Lauc G., Spector T.D., Menni C., Kastenmuller G. Exploring the molecular basis of age-related disease comorbidities using a multi-omics graphical model. Sci. Rep. 2016;6:37646. doi: 10.1038/srep37646. [DOI] [PMC free article] [PubMed] [Google Scholar]