

Abstract
Race and ethnicity responses can change over time and across contexts – a component of population change not usually considered in studies that use race and ethnicity as variables. To facilitate incorporation of this aspect of population change, we show patterns and directions of individual-level race and Hispanic response change throughout the U.S. and among all federally recognized race/ethnic groups. We use internal Census Bureau data from the 2000 and 2010 censuses in which responses have been linked at the individual level (N = 162 million). About 9.8 million people (6.1 percent) in our data have a different race and/or Hispanic origin response in 2010 than they did in 2000. Race response change was especially common among those reported as American Indian, Alaska Native, Native Hawaiian, Other Pacific Islander, in a multiple-race response group, or Hispanic. People reported as non-Hispanic white, black, or Asian in 2000 usually had the same response in 2010 (3%, 6% and 9% of responses changed, respectively). Hispanic/non-Hispanic ethnicity responses were also usually consistent (13% and 1% changed). There were a variety of response change patterns, which we detail. In many race/Hispanic response groups, there is population churn in the form of large countervailing flows of response changes that are hidden in cross-sectional data. We find that response changes happen across ages, sexes, regions, and response modes, with interesting variation across race/ethnic categories. Researchers should think through and discuss the implications of race and Hispanic origin response change when designing analyses and interpreting results.
Keywords: Race, Hispanic origin, Response change, Census 2000, 2010 Census
INTRODUCTION
Race and ethnic groups1 are not inherent divisions of society. The definition of each group and concepts of the “typical” member vary over time and place, and are affected by political regimes, intergroup relations, and personal interactions (Barth 1969; Haney López 1996). Relatedly, people sometimes change their sense of which race(s) or ethnicity best describe them. Although many researchers understand that race and ethnicity are social constructions, acknowledgment that some individuals change their race and/or ethnic response is not usually meaningfully incorporated into analyses of the social world. Instead, analyses are designed and described as if each person is a permanent member of a race/ethnic group (e.g. Adamczyk et al. 2016; Damaske and Frech 2016; Elliott 2015; Krivo et al. 2015; Lopoo and London 2016; Mehta et al. 2013).
In this study, we use linked data from the 2000 and 2010 censuses (N = 162 million; not nationally representative) to provide a dramatic expansion of information about individual-level changes in race and Hispanic origin responses.2 To what extent do race and/or Hispanic origin responses change? We use descriptive statistics and data visualization to show the extent of individual-level response stability and change across the decade. Is change more common to/from some race/ethnic groups than others? We show the 20 most common detailed changes and three case studies showing transitions between common combinations of race/ethnic groups. Does the propensity to change responses vary by characteristics of the individual? We provide rates of individual-level race and/or Hispanic response change by age and sex for 12 race/Hispanic categories. And to what extent do race and Hispanic origin response changes affect researchers? We calculate response change rates for a variety of aggregated race and Hispanic origin categories.
We are not the first to study response change. Using the limited data available, other scholars have raised important questions and given helpful insights (e.g., DeFina and Hannon 2016; Guo et al. 2014; Harris and Sim 2002; Liebler and Ortyl 2014; Loveman and Muniz 2007; Saperstein and Gullickson 2013; Saperstein and Penner 2012, 2014). Previous empirical studies have been constrained in their ability to give information about all types of people in the United States. In quantitative studies, sample sizes have inhibited investigation of dynamics within smaller response groups (particularly American Indians, Pacific Islanders, and double minorities; e.g., DeFina and Hannon 2016; Saperstein and Penner 2012), cohort-specific studies have focused attention on a limited range of ages (e.g., Harris and Sim 2002; Saperstein and Penner 2014), analyses of cross-sectional data have revealed net changes but not flow or churn (e.g., Liebler and Ortyl 2014; Perez and Hirschman 2009), and publicly available linked census data is from a century ago (Loveman and Muniz 2007; Saperstein and Gullickson 2013). Qualitative studies necessarily focus on particular populations (e.g., Rockquemore 1998; Sturm 2011). We advance knowledge of response change using much larger and more diverse data than has been available to other researchers. We show detailed flow information and include all federally-defined race and Hispanic origin groups, and people of all ages, in the modern era.
Differences across response categories in the extent and types of response change may reflect key cross-category differences in how race and ethnicity are socially constructed. We give empirical evidence of age, sex, and group-specific patterns that have not yet been accounted for in sociological theories of race.
Response change can affect any analysis where race/ethnic groups are compared to one-another. We give three related examples. First, if a highly educated person changes her response from X to Y, then group Y’s mean education rises and group X’s falls; statistics show a change in the measured attributes of both groups, yet no individual gained (or lost) education. Second, group-specific cross-sectional data on a characteristic such as income reflects the income of people who have stable identification with the group as well as the income of those who are newly identified group members. Third, the extent to which two groups are (measured as) residentially segregated reflects not only the locations of people with stable responses but also processes related to response instability that increase or decrease the chances a person will give one of these responses. Our work highlights the extent to which the assumption of response stability is untenable, as well as areas where the assumption holds relatively well.
PRIOR RESEARCH
Extent of Response Change and Response Groups Most Affected
Overall rates of race/Hispanic response change
To evaluate decennial data quality, the Census Bureau conducts post-census reinterview studies (usually by phone) with a sample of people in households (Dusch and Meier 2012; Singer and Ennis 2003; U.S. Census Bureau 1993).3 Census reinterview studies found an overall rate of race response change of 4 percent in 1990 (U.S. Census Bureau 1993:Table 4.6), 8 percent in 2000 (Singer and Ennis 2003:Table E.24) and 6 percent in 2010 (Dusch and Meier 2012:Table 8). Using a study of adolescents in the 1990s (National Longitudinal Study of Adolescent Health (AddHealth), 1994–5), Harris and Sim (2002) showed that 12 percent reported a different race at home versus at school. In a panel of General Social Survey respondents surveyed in 2008, 2010, and 2012, 5 percent changed responses between white, black, and another race response (DeFina and Hannon 2016).
Hispanic response change has been less common. Hispanic (yes/no) responses changed for 1 percent of those interviewed in 1990 (U.S. Census Bureau 1993:Table D.1), 2 percent in 2000 (Singer and Ennis 2003:Table E.8), and 1 percent in 2010 (Dusch and Meier 2012:Table 8). A comparison of Census 2000 responses to Current Population Survey (CPS) responses in nearby months revealed that 3 percent of people were reported as Hispanic in one of these studies but not the other4 (del Pinal and Schmidley 2005:5; also see Alba and Islam 2009 and Eschbach and Gómez 1998).
Response stability
Prior research on smaller or demographically limited samples shows that the extent of response change varies substantially by race response group, with notable stability in the white, black, Asian, and Hispanic response categories (Bentley et al. 2003; Brown et al. 2006; del Pinal and Schmidley 2005; Doyle and Kao 2007; Singer and Ennis 2003). For example, 2 to 3 percent of people who reported white, black, or Asian in Census 2000 gave a different response in the Census Quality Survey (CQS; Bentley et al. 2003:28). Although these groups have high levels of response stability, some people who report these groups have mixed racial heritage (Bratter 2007; Liebler 2016) or mixed Hispanic and non-Hispanic heritage (Emeka and Agius Vallejo 2011; Miyawaki 2016). Because these are large groups, even if a small proportion of people changed responses, the number of changes would be substantial.
Race response instability
American Indian, Pacific Islander, and multiracial responses exhibit much greater instability. People of mixed heritage (a group which includes many with American Indian and/or Pacific Islander heritage), sometimes have a dynamic or border-straddling identity that is not easily brought into standard race categories (Rockquemore 1998; Root 1996); their outward self-presentation may be at odds with their family heritage and/or internal personal identities (Khanna and Johnson 2010), or be interpreted inconsistently by others (Porter et al. 2016). As feelings and experiences vary across time and context, people of mixed heritage may shift between marking both/all of their affiliated groups and marking only one.
In the CQS follow-up study, 22 to 28 percent of those reported as American Indian, Pacific Islander, or Some Other Race (SOR) in Census 2000 had a different response in the CQS (Bentley et al. 2003:30). Of people reported as non-Hispanic multiple-race in Census 2000, about 60 percent were reported as non-Hispanic single-race in the CQS (Bentley et al. 2003:Tables 10 and 11). Even higher race response change rates have been found among people reported as Hispanic. A different race response was reported in the 2000 CPS than in Census 2000 for 13 percent of those reported as Hispanic white in Census 2000, 45 percent of those reported as Hispanic black, and 78 percent of those reported as Hispanic American Indian (del Pinal and Schmidley 2005:Table 13). See Roth (2012) for related qualitative research.
Instability in American Indian responses
Despite specific tribal and federal legal definitions of who is considered American Indian (Robertson 2013; Snipp 2003; Thornton 1997), there has been a large net increase over the past half century in identification as American Indian on the census (Eschbach 1993, 1995; Eschbach et al. 1998; Harris 1994; Liebler and Ortyl 2014; Passel 1976, 1997; Passel and Berman 1986) and in daily life (Fitzgerald 2007; Nagel 1996; Sturm 2011). We include non-Hispanic American Indians in one of our case studies below. Rather than reporting net change as in prior research, we show both in-flows and out-flows to/from each race/Hispanic response group (also see Liebler et al. 2016).
Instability in Pacific Islander responses
Census Bureau Content Reinterview studies reveal “medium to high” levels of inconsistency in responses to the Pacific Islander category (Dusch and Meier 2012:Table 27; Singer and Ennis 2003). Of those in the CPS comparison, 28 percent of those reported as non-Hispanic Pacific Islander in Census 2000 had a different response in the CPS (del Pinal and Schmidley 2005:Table 11). With our very large data set, we are able to include Pacific Islanders in all parts of our analyses (including a case study), providing some of the first insights into response change within the Pacific Islander category.
Instability in multiracial responses
The social and legal history of the United States likely impacts which response change patterns are more common. The “black” category has been defined relatively strictly (Davis 2001; Haney López 1996) and may constrain people with black heritage to virtually always include a black response, even if they sometimes report additional races (Doyle and Kao 2007; Gullickson and Morning 2011; Guo et al. 2014; Harris and Sim 2002). Cross-sectional data show that multiple-race reports dominate among those who have mixed Asian or Pacific Islander heritage (Gullickson and Morning 2011; Hixson et al. 2012; Liebler 2016; Spickard 2001).
Instability in race responses when Hispanic origin is reported
Several factors might heighten race response instability among those who report Hispanic origins. First, the race question does not include a Hispanic response option, so people who view their race as Hispanic may be relatively uncommitted to a different race response (Compton et al. 2012; Rodríguez 2000). Second, people who identify with Latin American terms such as mulatto or mestizo (Golash-Boza and Darity 2008) may not see their identity captured in U.S. racial categories. Third, like all immigrants, foreign-born people who identify as Hispanic might change their identities and race/Hispanic responses as they become more integrated into U.S. society (Landale and Oropesa 2002; Mowen and Stansfield 2016; Roth 2012; Waters 1999). Fourth, questionnaire design changes (discussed below) may influence some to report one (or more) of the federally defined race groups (Humes et al. 2011; Stokes et al. 2011). We give empirical evidence of patterns in race response stability and change among those reported as Hispanic and those reported as non-Hispanic.
Response change from one single race to another
Some response changes are from one single-race response to another. The limited information available shows that adolescents of mixed heritage (e.g., Harris and Sim 2002) made this response change and thousands of people have changed to an American Indian response from another (unknown) single-race response (Eschbach et al. 1998; Harris 1994; Liebler and Ortyl 2014; Liebler et al. 2016; Passel 1976, 1997). Some single-race-to-single-race response changes are likely a reflection of identity awakenings (Fitzgerald 2007; Sturm 2011) while others might reflect a change in context, reference group orientation, socioeconomic status, or a “chameleon change” experience (Miville et al. 2005; also see Kana’iaupuni and Liebler 2005; Liebler 2010; Stokes-Brown 2012). Our information about population churning between single-race groups is an important contribution.
Characteristics of People with Unstable Race/Hispanic Responses
Our data are not well suited for parsing the reasons for race and Hispanic response change and stability. In support of future efforts, however, we present summary information about the respondent characteristics available in our data: sex, age, location, and enumeration mode. Each of these characteristics might be associated with unstable responses. There is some evidence that women are socialized to have more complex identities than men (see Root 1998) and (among college freshmen) women are more likely to report multiple-races than men (Davenport 2016), so women may be more likely to change their race/Hispanic responses. Younger people go through stages of personal identity development (Erickson 1980) and may change responses as a result. Also, older children may have parent-reported responses in 2000 but self-reported responses in 2010. The West region5 has higher levels of interracial marriage and multiple-race reporting than elsewhere in the U.S. (Jones and Bullock 2012; Wright et al. 2003), perhaps heightening response change in that region. Finally, the presence of an enumerator6 may influence which response is provided, potentially causing a different response in one year than another (Khanna 2004; Wilkinson 2011).
We note that there are many other reasons a person’s race and/or Hispanic origin response might change, including questionnaire design (Lavrakas et al. 2005; Snipp 2003; Stokes et al. 2011), situational identities (Harris and Sim 2002; Rodríguez 2000; Root 1996), difference in who fills out the form (Sweet 1994), change in self-understanding through change in circumstance or location (Eschbach 1993: Kana’iaupuni and Liebler 2005; Root 1998), and differences in post-enumeration procedures.
To What Extent Do These Changes Affect Researchers?
Researchers often rely on the assumption that a racial or ethnic group includes the same individuals at each time point, except for differences due to births, migration, and deaths. Most data resources do not include measures of race/ethnicity at multiple time points. We show rates of response change in various aggregations of race/ethnic categories to help researchers understand the extent to which response change might be affecting their data and results.
DATA
We used internal linked Census Bureau data from the 2000 and 2010 censuses. The Census Bureau’s Center for Administrative Records Research and Applications used probability record linkage techniques and name, sex, date of birth, and address to assign each person (as possible) in each data set an anonymized Protected Identification Key (PIK; see Wagner and Layne 2014). The PIKs were then used to link each person’s Census 2000 record to his or her 2010 Census record.
By definition, linked data includes only those who were present in both data sets. We cannot include Census 2000 respondents who died or left the country by 2010, new immigrants who arrived after 2000, children born after Census 2000, or people who were present but not enumerated in Census 2000 and/or the 2010 Census (Mule 2012; U.S. Census Bureau 2003). The process of linking the data excludes everyone who does not have a Social Security Number or an Individual Taxpayer Identification Number; see Wagner and Layne (2014) and Bond et al. (2013). People in Census 2000 who could not be linked to 2010 had an older age distribution and were disproportionately reported as non-Hispanic black or Hispanic. About 2 million people (199,917,723) were present, enumerated, and assigned a unique PIK in the full-count decennial censuses of 2000 and 2010. This is 81 percent of the people with unique PIKs in 2000.
Case selection
To minimize response changes due to differences in how the information was gathered, we excluded cases in which: the person lived in group quarters because this information is often drawn from local administrative records (Chun and Gan 2014; 6,845,302 people were excluded for this reason); information was collected from a neighbor or other proxy respondent (Porter et al. 2016; 4,868,556 people); or the race or Hispanic origin was imputed or edited by the Census Bureau (21,144,912 people). Remaining responses were very likely given by the individual or by someone else in the household (for more about who fills out census forms, see Sweet 1994).
To minimize the chances of a false match, we excluded cases if: the person’s age difference between the two censuses was less than 8 years or more than 12 years (5,410,733 people), all age information in a year was imputed (3,994,504 people), the person’s sex did not match between the two censuses (1,232,272 people), or sex information in a year was imputed (3,885,179 people). Despite these exclusions, it is likely that in some remaining cases PIKs were not assigned to the correct person. Based on Layne and colleagues (2014), we anticipate that 0.2 percent to 1.2 percent of the cases in our data are false matches. False matches disproportionately affect rates for rare events or, in this case, numerically small groups (Hemenway 1997). See Appendix Table A for our related calculations.
There were some changes to the race and Hispanic questions and instructions between 2000 and 2010 (see Figure 1). The changes, detailed by Humes and colleagues (2011:2), were intended to increase reporting within the five OMB race categories, decrease item non-response, and increase detailed race/ethnic reporting. For example, the 2010 instruction “For this census, Hispanic origins are not races,” was intended to encourage reporting in one of the five federally-defined race groups as opposed to providing a response outside of these groups (e.g., Mexican) that was then recorded as SOR. Experimental evidence suggests that the changes to the questions and instructions had the intended effects (Stokes et al. 2011). To minimize effects of questionnaire differences, we excluded people from households who returned an Alternative Questionnaire Experiment census form in 2010 (347,301 people; see Compton et al. (2012)). Other effects of questionnaire changes remain in the data.
Figure 1.
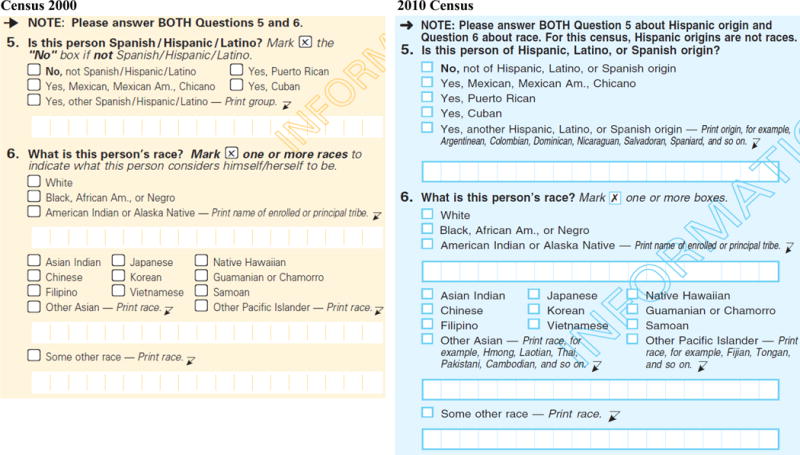
Race and Hispanic origin questions in Census 2000 and the 2010 Census
We also excluded cases in which the person was listed as SOR and at least one other race in 2000 (1,903,447 people). During the process of making the Census 2000 race write-in entries consistent between the enumerator-filled questionnaire and the mailout/mailback questionnaire, a processing error caused about 1 million cases to be permanently recoded as SOR multiracial (see U.S. Census Bureau 2007, Data Note 5). We excluded some cases for multiple reasons. We study the full set of people remaining after our exclusions – 161,700,185 people.
Coding issues
Write-in responses were categorized into federally-defined race groups using slightly different protocols in 2000 and 2010. We corrected for this by applying the 2010 coding scheme to write-in responses given in 2000. Also, coding procedures for write-in lines changed from 2000 to 2010 for those who wrote more than two race responses on one write-in line. This may have a small impact on our results.
Representativeness
Our data are not nationally representative and should not be interpreted as such. Because these are total U.S. population data (not sample data), there are no weights. We show in Table 1 the distribution of race and Hispanic responses in the 162 million cases in our analysis data and compare them to parallel numbers for the full 2000 and 2010 population data. For example, 64 percent of those reported as non-Hispanic white in 2000 are in our study data, but only 20 percent of those reported as SOR Hispanic in 2010 are included. Liebler and colleagues (2014) apply response change rates from the linked data to the full population in Census 2000 and estimate that 8.3 percent of the total population in 2000 was reported as a different race and/or ethnicity in 2010.
Table 1.
Census 2000 and 2010 Census official United States population totals in comparison to linked data used in this study
| 2000 | Official U.S. Total
|
Linked data in this study
|
% of US total in study data
|
|||
|---|---|---|---|---|---|---|
| Non-Hispanic
|
Hispanic
|
Non-Hispanic
|
Hispanic
|
Non-Hispanic
|
Hispanic
|
|
| White | 194,552,774 | 16,907,852 | 124,765,953 | 6,901,238 | 64% | 41% |
| Black | 33,947,837 | 710,353 | 15,454,761 | 238,070 | 46% | 34% |
| AIAN | 2,068,883 | 407,073 | 1,045,627 | 163,775 | 51% | 40% |
| Asian | 10,123,169 | 119,829 | 5,599,943 | 50,981 | 55% | 43% |
| NHPI | 353,509 | 45,326 | 152,640 | 12,245 | 43% | 27% |
| SOR | 467,770 | 14,891,303 | 207,906 | 5,011,234 | 44% | 34% |
| Two or More Races* | 4,602,146 | 2,224,082 | 1,917,960 | 177,852 | 42% | 8%* |
| Total | 281,421,906 | 161,700,185 | 57.5% | |||
| 2010 | Official U.S. Total
|
Linked data in this study
|
% of US total in study data
|
|||
| Non-Hispanic
|
Hispanic
|
Non-Hispanic
|
Hispanic
|
Non-Hispanic
|
Hispanic
|
|
| White | 196,817,552 | 26,735,713 | 124,156,954 | 8,141,069 | 63% | 30% |
| Black | 37,685,848 | 1,243,471 | 15,284,628 | 279,972 | 41% | 23% |
| AIAN | 2,247,098 | 685,150 | 1,042,724 | 168,481 | 46% | 25% |
| Asian | 14,465,124 | 209,128 | 5,575,803 | 52,024 | 39% | 25% |
| NHPI | 481,576 | 58,437 | 154,925 | 11,184 | 32% | 19% |
| SOR | 604,265 | 18,503,103 | 149,739 | 3,614,224 | 25% | 20% |
| Two or More Races | 5,966,481 | 3,042,592 | 2,376,310 | 692,148 | 40% | 23% |
| Total | 308,745,538 | 161,700,185 | 52.4% | |||
Note: AIAN = American Indian/Alaska Native; NHPI = Native Hawaiian and other Pacific Islander; SOR = Some Other Race.
Due to a processing error potentially affecting our results, we do not study people in 2000 who were coded as more than one race including Some Other Race.
Sources: Official total for Census 2000: Table 10 of C2KBR01-1 by Greico and Cassidy; official total for Census 2010: Table 2 of C2010BR-02 by Humes, Jones, and Ramirez.
Suitability
These data are uniquely well-suited to study cross-time changes in individuals’ race and Hispanic responses. We have millions of responses that describe the same individual at two points in time so we can observe response changes directly as opposed to using inference (e.g., cohort component analysis). Our data cover more than half of all people in the U.S. at the time, with a density that allows disaggregation into the many federally-defined race/Hispanic origin categories, as opposed to a study of only the largest groups. And these are the most recent U.S. decennial census data – data often used to study programs, policies, and American life – so response changes in these data are worth understanding in and of themselves.
RESULTS
Extent of Response Change and Response Groups Most Affected
Overall rates of race/Hispanic response change
To what extent, and in which race/ethnic groups, did individuals’ race and/or Hispanic responses change? Of the 161,700,185 people in our data, 6.1 percent (9,782,918 people) had a different race and/or Hispanic response in 2010 than they did in 2000. In Figure 2 we give a visual cross-tabulation or “heat map” of all response changes in our data.7 Each cell is darkened in accordance with the number of people with that combination of responses (stable responses are on the diagonals of each quadrant).8
Figure 2. Frequency of race and Hispanic origin response change between 2000 and 2010.

Notes: Census 2000 and 2010 Census linked data; N=162 million people. Response stability is indicated by ≡. Each cell that is shaded with values in the key above shows the number of people with that race/Hispanic response change. Quadrants 1 and 4 show race response change frequencies for people whose Hispanic/non-Hispanic response was stable. Quadrants 2 and 3 show those whose Hispanic/non-Hispanic response changed. Rows and columns are in census order (see Table 2 for partial list and U.S. Census Bureau 2007, pages 6–1 to 6–3, for full list). Only cases in the linked data are shown. People reported as Some Other Race in combination with another race in 2000 are not studied here because a processing error affected their responses. These 62 empty rows are not shown.
Response changes spanned the full variety of race and Hispanic origin groups; there are shaded boxes throughout the figure and many denote a large number of people. For example, thousands of people who were reported as single-race non-Hispanic Asian in 2000 (row 4) were reported in 2010 as: a different non-Hispanic single race (columns 1,2,3,5, and 6 of the top left quadrant), as non-Hispanic and multiple races (the remaining columns in the top left quadrant), or as Hispanic Asian (column 4 in the top right quadrant). Many people’s responses changed from one single race to another single race (first six rows/columns of each quadrant). Also, ethnicity responses changed for thousands of people; the top right and bottom left quadrants are both well-populated with shaded boxes.
For more detail about the inflows and outflows into each single-race and two-race response group, and into and out of the Hispanic ethnicity group, we look to Table 2. Each row in the table includes all people who had a particular race/Hispanic response combination in 2000, 2010, or both. The charts in Table 2 can be seen as Venn diagrams of overlapping rectangles describing columns C, D, and E. For example, the center section shows the proportion of people who had that particular race/Hispanic response in both years (column D/column C + D + E). See Appendix Table A for estimates of the effect of false matches on these numbers. In most groups, the size of the population who left (column C) is similar to the size of the population who joined (column E). In other words, response churning is mostly hidden in cross-sectional comparisons of the 2000 to 2010 data.
Table 2. Race response fluidity between Census 2000 and the 2010 Census, by Hispanic origin.

|

|
Abbreviations: AIAN = American Indian/Alaska Native; NHPI = Native Hawaiian and other Pacific Islander; SOR = Some Other Race.
Notes: Case counts include only people in the linked data. Rows are in census order (U.S. Census Bureau 2007:6–1 to 6–3). Not shown: 135,431 people in the linked data who reported non-Hispanic multiracial including SOR in 2010 and 474,836 people who reported Hispanic multiracial including SOR in 2010. % left = C/(C+D+E); % stayed = D/(C+D+E); % joined = E/(C+D+E). The percent who stayed in the category (shown numerically) represents the percent of people who reported a race and Hispanic origin combination in both 2000 and 2010, of the people who reported that combination in either 2000 or 2010.
The large center bars for the single-race non-Hispanic white, black, and Asian response groups in Table 2 show that they were largely stable groups – 3, 6 and 9 percent of these responses changed, respectively. The non-Hispanic and Hispanic response groups (regardless of race responses) also had substantially stable sets of incumbents – 1 and 13 percent of these responses changed. These same groups were usually found to be relatively stable in the short term census follow up studies (Bentley et al. 2003; del Pinal and Schmidley 2005; Singer and Ennis 2003), among adolescents and young adults (Brown et al. 2006; Doyle and Kao 2007; Saperstein and Penner 2014), and in assumptions by neighbors (Porter et al. 2016). This may be evidence that the socially constructed boundaries of the non-Hispanic white, black, and Asian groups – and the Hispanic/non-Hispanic boundary – are relatively well-established.
In all of the other race/ethnic groups in Table 2, the number of people who left or joined is large relative to the number of people who stayed in the group – we find very substantial population churning among those reported as American Indian, Pacific Islander, and/or multiracial, and in terms of race responses among those reported as Hispanic. The double-minority response groups (rarely included in other studies) have the highest levels of response change. We conclude that to understand response stability and change, researchers need to study the full diversity of heritages, not just the larger groups.
Three case studies of response churning
When people had a different race/Hispanic response in 2010 than 2000, which specific groups did they leave/join? We answer this with three case studies, chosen because they encompass the most common response changes (discussed below) and they include race groups that have extensive response change but small sample sizes in other studies: American Indians and Pacific Islanders. Our case studies are the first to show detailed response changes among double-minorities or people of all ages in the modern era.
In our first case study, shown in Table 3, we focus on Hispanic, white, and/or SOR responses in 2000 and/or 2010. Note that the rows/columns with detailed race/ethnicity show 16 of the 8064 cells depicted in Figure 2. Hispanic race responses have most often been white or SOR; for more about race responses of people reporting Hispanic origins, see Golash-Boza and Darity (2008), Logan (2003), Miyawaki (2016), and Tafoya (2004).
Table 3. White, Some Other Race, and/or Hispanic response stability and change.
| Race/Hispanic response in 2000 Census linked data
|
Race/Hispanic response in 2010 Census linked data
|
|||||
|---|---|---|---|---|---|---|
|
Non-Hispanic
|
Hispanic
|
Any Other Response |
Total | |||
| White | SOR | White | SOR | |||
| Non-Hispanic | ||||||
| White | 122,765,113 | 39,285 | 710,019 | 74,222 | 1,177,314 | 124,765,953 |
| Some Other Race (SOR) | 50,005 | 31,127 | 4,112 | 3,368 | 119,294 | 207,906 |
| Hispanic | ||||||
| White | 417,855 | 6,396 | 4,911,175 | 1,243,630 | 322,182 | 6,901,238 |
| Some Other Race (SOR) | 75,105 | 8,373 | 2,380,183 | 2,175,513 | 372,060 | 5,011,234 |
| Any Other Response | 848,876 | 64,558 | 135,580 | 117,491 | 23,647,349 | 24,813,854 |
| Total | 124,156,954 | 149,739 | 8,141,069 | 3,614,224 | 25,638,199 | 161,700,185 |
Notes: Case counts include only people in the linked data.
The cells on the diagonal show that non-Hispanic white responses are quite stable while non-Hispanic SOR responses are not. There are two situations in Table 3 that do not follow the pattern of (generally) offsetting flows seen elsewhere in this table and in Table 2. First, more people changed responses from Hispanic SOR to Hispanic white (2,380,183) than the reverse (1,243,630). This imbalance is consistent with the 2010 questionnaire text intended to encourage a federally-recognized race response (“For this census, Hispanic origins are not races.” See Stokes et al. 2011). Second, more people changed responses from non-Hispanic white to Hispanic white (710,019) than the reverse (417,855), perhaps because the inclusive word “origin” was added to the Hispanic origin question instructions (see Stokes et al. 2011).
In our second case study, we highlight response changes among people who were reported as non-Hispanic black, American Indian, and/or white in 2000 and/or 2010; see Table 4. These are the most long-standing U.S. populations, with centuries of interracial unions and many people of a variety of mixed descents (Brooks 2002; Katz 1986; Nash 1974; Perdue 2003).
Table 4. Non-Hispanic white, black, and/or American Indian response stability and change.
| Race/ethnic response in 2000 Census linked data
|
Race/ethnic response in 2010 Census linked data
|
|||||||
|---|---|---|---|---|---|---|---|---|
|
Non-Hispanic
|
||||||||
| White | Black | AIAN | W & B | W & AIAN |
B & AIAN |
Any Other Response |
Total | |
| Non-Hispanic | ||||||||
| White | 122,765,113 | 102,464 | 173,415 | 67,879 | 404,209 | 1,144 | 1,251,729 | 124,765,953 |
| Black | 112,882 | 14,881,514 | 22,793 | 130,788 | 1,910 | 71,382 | 233,492 | 15,454,761 |
| AIAN | 158,178 | 16,307 | 723,326 | 790 | 99,910 | 4,948 | 42,168 | 1,045,627 |
| W & B | 35,837 | 90,086 | 454 | 249,359 | 488 | 851 | 39,881 | 416,956 |
| W & AIAN | 339,481 | 1,074 | 87,809 | 642 | 134,523 | 213 | 11,938 | 575,680 |
| B & AIAN | 785 | 50,000 | 3,713 | 1,226 | 252 | 16,433 | 6,813 | 79,222 |
| Any Other Response | 744,678 | 143,183 | 31,214 | 47,764 | 9,158 | 3,950 | 18,382,039 | 19,361,986 |
| Total | 124,156,954 | 15,284,628 | 1,042,724 | 498,448 | 650,450 | 98,921 | 19,968,060 | 161,700,185 |
Notes: Case counts include only people in the linked data. W = white; B = black; AIAN = American Indian and Alaska Native.
Table 4 shows substantial single-race-to-single-race response change between white and American Indian as was suspected but not proven in prior research (Eschbach et al. 1998; Liebler and Ortyl 2014) See Liebler et al. (2016) for further analysis. There was some response churning between single-race white and single-race black responses (as found in historical data by Saperstein and Gullickson (2013) and Loveman and Muniz (2007)).
Many people in Table 4 were reported as one race in one census and an additional race in the other census. Among those with white-black responses in 2000 (416,956), there were 90,086 reported as single-race black in 2010 and 35,837 reported as single-race white. This distribution of single-race responses shows relatively more white responses than found among adolescents who reported white-black multiracial in the 1990s (Doyle and Kao 2007; Harris and Sim 2002). White-American Indian and black-American Indian multiracial responses have a strong tendency toward white or black single-race responses when the responses change.
In our third case study (shown in Table 5), we highlight non-Hispanic Asian, Pacific Islander, and/or white responses. These three groups have a long, intertwined history, especially in what is now the western U.S. (Williams-León and Nakashima 2001). Those reported as Pacific Islander have high rates of response change (as seen in Table 2) yet the small total group size has excluded them from virtually all previous studies. Our research provides unique information about response changes affecting the Pacific Islander response group.
Table 5. Non-Hispanic white, Asian, and/or Pacific Islander response stability and change.
| Race/ethnic response in 2000 Census linked data
|
Race/ethnic response in 2010 Census linked data
|
|||||||
|---|---|---|---|---|---|---|---|---|
|
Non-Hispanic
|
||||||||
| White | Asian | NHPI | W & A | W & NHPI |
A & NHPI |
Any Other Response |
Total | |
| Non-Hispanic | ||||||||
| White | 122,765,113 | 52,303 | 10,352 | 186,208 | 24,133 | 1,769 | 1,726,075 | 124,765,953 |
| Asian | 36,727 | 5,335,234 | 5,459 | 93,064 | 334 | 17,593 | 111,532 | 5,599,943 |
| NHPI | 6,115 | 4,598 | 100,199 | 965 | 11,461 | 10,270 | 19,032 | 152,640 |
| W & A | 102,888 | 86,500 | 1,147 | 280,072 | 836 | 1,602 | 26,792 | 499,837 |
| W & NHPI | 15,416 | 361 | 11,815 | 713 | 21,342 | 624 | 6,029 | 56,300 |
| A & NHPI | 1,154 | 20,425 | 10,031 | 1,506 | 544 | 24,676 | 8,478 | 66,814 |
| Any Other Response | 1,229,541 | 76,382 | 15,922 | 28,914 | 5,267 | 8,139 | 29,194,533 | 30,558,698 |
| Total | 124,156,954 | 5,575,803 | 154,925 | 591,442 | 63,917 | 64,673 | 31,092,471 | 161,700,185 |
Notes: Case counts include only people in the linked data. W = white; A = Asian; NHPI = Native Hawaiian and other Pacific Islander.
Of 152,640 people reported as non-Hispanic single-race Pacific Islander in 2000, about twice as many were reported as white-Pacific Islander or Asian-Pacific Islander in 2010 than were reported as non-Hispanic single-race white or Asian. This tendency to keep the Pacific Islander designation but add or remove an additional response impacts the effect of various category aggregations (shown in Figure 5, below). In our data, people whose responses changed between non-Hispanic white-Asian and a single race were usually reported as non-Hispanic white. Adolescents in the Add Health data, in contrast, more often collapsed a white-Asian response to single-race Asian (Doyle and Kao 2007; Harris and Sim 2002).
Figure 5. Response change within common race/Hispanic aggregations.

Notes: Only people in the linked data are shown; see Appendix Table D for case counts. Percentages are calculated as in Table 2. The percent who stayed in the category is shown for reference. AIAN = American Indian/Alaska Native; NHPI = Native Hawaiian and other Pacific Islander; SOR = Some Other Race.
The three case studies reveal some general patterns. First, race and/or Hispanic response changes were in many different directions: between different single races, adding and dropping races, and changing whether Hispanic origins are reported. Second, in our data with people of all ages, some single-race responses were more common than others when a response changed from one race to two or vice versa; the largest of the groups was favored, except among white-black responses. Third, we continue to see similarly-sized, countervailing flows between specific race/Hispanic origin response categories. This churning is hidden in cross-sectional data.
Top 20 response changes
Next we show the 20 most common race response changes in our data (Figure 3 and Appendix Table B). The two most common response changes were seen in Table 3: changing from a Hispanic SOR response to a Hispanic white response, or the reverse (see Stokes et al. 2011). These two most common changes make up 37 percent of race/Hispanic response changes in our data.9
Figure 3. Top 20 race/Hispanic response changes and the relative distribution within response change groups.

Notes: Rows are in order of descending number of response changes. Case counts include only people in the linked data. See Appendix B for case counts underlying the bars. SOR = Some Other Race; AIAN = American Indian/Alaska Native; children = age 0–17 in 2000; West = lived in the west region in 2000; mail mode = responded to the census through the mail in both years. Responses are non-Hispanic unless noted.
There are at least three other notable patterns among the most commong response moves. First, many of the common response moves involved a modification to the response, not a complete change; this is the case in 14 of the top 20 most common moves (ranks 3–7, 9, 11, 12, 14, and 16–20). This suggests that most response changes were not errors or false links. See Rockquemore (1998) and Root (1996) for qualitative research about fluid multiracial identities.
Second, many common response changes involved a change between a non-Hispanic single-race white response (the majority group) and a minority group response – often a two-race response that included white (ranks 3–7, and 14). Some of these response moves were anticipated by previous research on adolescents (Harris and Sim 2002; Doyle and Kao 2007).
Third, a number of people change from one single-race response to another – most commonly from a majority group response to/from a non-Hispanic American Indian response (ranks 8 and 10) or a non-Hispanic black response (ranks 13 and 15). In our data, more of these moves involve leaving the majority group. That these people were ever reported as non-Hispanic white raises the possibility that their response (and perhaps their identity) might be “optional” and without social costs, as has been shown for ancestry responses among people who identify as non-Hispanic white (Gans 1979; Waters 1990). Optional identities have been thought to be a special case of white privilege and not available to those whose physical appearance generates socially-enforced race labels imposed by others. Thus, these single-race to single-race response change patterns are a new and relatively unexpected finding.
Characteristics of People Whose Race and/or Hispanic Responses Change
Relative representation in the top 20
There is limited information gathered in full-count censuses. For each of the top 20 response changes, we show proportions who (in 2000) were children, women, living in the West, and used the mail mode in both years (also see Appendix Table B). The top two rows in Figure 3 show the averages for all people in our data and all those whose response changed.10 People whose responses changed were more commonly children, living in the West, and/or using other response modes besides mail in at least one census (e.g., non-response follow-up by an enumerator). Women were not overrepresented among response changers. Our data are unique in their broad scope so we are able to see that there were also millions of adults, people in other regions, and/or people who responded to the censuses by mail among those whose race and/or Hispanic response changed across the decade in our data.
There are important variations in patterns, by specific response change. Children predominated among those whose reports changed from black to white-black, or vice versa (ranks 12 and 18), while adults predominated among those reported as combinations of white and American Indian (ranks 5, 6, 8, 10, 16, and 19).
Those sometimes reported as Asian (ranks 17 and 20) or Hispanic SOR (ranks 1, 2, and 11) were more often in the West, while those sometimes reported as black (ranks 12, 13, 15, and 18) were mostly in non-West regions. Those whose responses changed between Hispanic white and non-Hispanic white (ranks 3 and 4) were less often in the West.
The experience of interacting with an enumerator can influence a person’s response (e.g., Wilkinson 2011), and people whose responses in both years were through the mail do not have this potential source of response change. Among those in Figure 3, using the mail mode in both censuses was most common among people who were sometimes reported as white-Asian (ranks 7, 14, 17, and 20). Involvement of an enumerator at least once was most common among people reported as Hispanic SOR in 2010 but not 2000 (rank 2) and those with single-race to single-race response changes (ranks 8, 10, 13, and 15).
Does Race/Hispanic Response Churning Affect Social Science Researchers?
Extent of response change, by age and sex
To assist others in understanding how response changes may be affecting their data, we use Figure 4 to display the rates of race and/or Hispanic response change among people in our linked data, by age group, sex, and within 12 relatively large race/ethnic categories (5 age groups × 2 sexes × 12 race/ethnic categories = 120 subpopulations; all variables are as of 2000); associated numbers are in Appendix Table C. Each horizontal bar represents one of the subpopulations, sums to 100 percent, and shows the percent who had: (a) the same response in both censuses, (b) a different race response, (c) a different Hispanic response, or (d) different race and Hispanic responses in 2010 than 2000.
Figure 4. Race/Hispanic response change among people in the linked data, by sex, age, and race/ethnicity response in 2000.

Notes: Charts include only people in the linked data. See Appendix Table C for underlying numbers. AIAN = American Indian/Alaska Native.
The rate of response change among those reported as single-race non-Hispanic white, black, or Asian was low across all age and sex groups with a tendency for more response change among children. There were higher levels of response change but fairly little variation by age or by sex among people reported (in 2000) as non-Hispanic American Indian, Pacific Islander, white-American Indian, another non-Hispanic response, or a Hispanic race response that was neither white nor SOR. Theories about reasons for response change for these groups should not rest heavily on age or gender dynamics.
Other groups in Figure 4 show a more clear age and/or sex gradient in race response changes. Young people had a lower rate of race response change than older people among those reported in 2000 as non-Hispanic white-black, non-Hispanic white-Asian, or Hispanic SOR. Increases in white-black and white-Asian interracial unions have perhaps allowed the younger generation to be relatively comfortable with (and stable in) a multiracial identity (see Korgen 1998). Older people reported as Hispanic white in 2000 had more stable race/Hispanic responses than did younger people in the same response category; perhaps the reasons for choosing a white race response are clearer to older people who identify as Hispanic (see Dowling 2014 and Vargas 2015).
Extent of response change when categories are combined for analysis
Some analyses strategies have an implicit assumption that responses do not change. These include, for example, traditional race-/ethnicity-specific life tables or residential segregation measures that assume responses are unaffected by neighborhood composition. Researchers using these methods might wish to reduce cross-category response change by aggregating categories. We use Figure 5 (and Appendix Table D) to illustrate the extent of response churning across various aggregations of response categories.
Various aggregations of white responses show about the same (high) level of stability in which individuals are in the response category, whether including or excluding white Hispanic responses and/or multiple-race part-white responses. Different aggregations of black responses and (to a lesser extent) Asian responses also contain about the same proportion of stable race/Hispanic responses.
The four strategies for coding Hispanic responses give different levels of response stability. A coding strategy that divides Hispanic responses into groups based on the race response in 2000 would have a substantial proportion of different people in 2010. Because relatively few people add or drop the Hispanic designation but relatively many with Hispanic responses had a different race response from one census to the other (Table 2), a recode of all Hispanic responses into a single group (ignoring the race responses) would include most of the same individuals in 2000 as in 2010.
There is no such simple coding solution for increasing the consistency of which people are in the American Indian, Pacific Islander, or multiple race groups. About 53 percent of those reported as non-Hispanic single-race American Indian in 2000 were reported as the same race/Hispanic origin in 2010. Because a relatively high proportion of people in our data who were reported as American Indian in one census have an entirely non-American Indian response in the other, making the coding scheme very inclusive does not reduce population churning – in fact, stable responses decline to only 40 percent of all responses. Broadly aggregating Pacific Islander responses increases the stability of the studied group (to 57 percent stable responses) because people reported as Pacific Islander in one census are more often adding or dropping other race responses.
SUMMARY AND CONCLUSIONS
We investigated person-level changes in race and/or Hispanic origin responses using remarkable data: information about 162 million people whose responses in Census 2000 were linked to their responses in the 2010 Census. We were not the first to notice that people’s race and Hispanic origin responses can and do change, but our data allowed us to expand substantially on prior knowledge by studying the modern era and including all federally-defined race and Hispanic origin groups throughout the nation, including those of all ages.
To what extent do individuals’ race and/or Hispanic origin responses change?
We found that 6.1 percent of people in our data had a different race and/or Hispanic origin response in 2010 than in 2000.11 Race and/or Hispanic origin responses changed in a wide variety of ways in patterns anticipated by previous research on adolescents, people living a century ago, particular race/ethnic subgroups, and in short-term census follow up studies. Responses changed in some ways anticipated by substantial previous research (e.g., adding or taking away a race response) and other ways that have not been well-studied (e.g., from one single race to another and high rates of change if reported as a double minority). Inflows to each race/Hispanic group were in most cases similar in size to the outflows; cross-sectional views of these data show a small net change. The most imbalanced response change flows may be uneven due to questionnaire design changes. Theoretical explanations for response change should take into account response churning – countervailing flows of response changes – as opposed to focusing on only one direction of response change.
Is change more common to/from some race/ethnic groups than others?
The extent of response change varies by race/ethnic group. Those reported as single-race non-Hispanic white, black, or Asian showed response stability between 2000 and 2010, with only 3 to 9 percent of people in these groups changing responses. Hispanic/non-Hispanic responses (disregarding the race response) were also particularly stable (13 percent and 1 percent response change, respectively). However, we found extensive population churning among those reported as American Indian, Pacific Islander, or multiple-races (response groups usually excluded from other studies). Most people reported as Hispanic in our data had a different race response in 2010 than 2000 (more than 50 percent race response change in all Hispanic race groups).
Does the propensity to change responses vary by characteristics of the individual?
Response changes happen throughout our society – among males and females, children and adults, in all regions, and across response modes. At the same time, response changes were relatively common among children, those living in the West in 2000, and/or those who used a non-mail response mode in one or both years. We found variation in these patterns across the 20 most common response changes. For example, children were overrepresented among those changing responses between non-Hispanic white-black and single-race black, while adults were overrepresented among those with combinations of non-Hispanic white and/or American Indian responses.
Do these changes affect researchers?
Analysts who use race and/or Hispanic origin data need to take into account the possibility of response changes, especially when working with data on smaller race groups and/or race responses among people reported as Hispanic. To assist, we showed response change rates for 120 age-, sex-, race- and Hispanic origin-subgroups. And we calculated the extent to which response change rates are sensitive to various aggregations of the 126 possible combinations of race and Hispanic origin categories. Coding decisions can notably increase or reduce response change rates in the Hispanic, American Indian, and Pacific Islander groups. If Hispanic were a response option in a combined race/Hispanic census question (Compton et al. 2012), our results suggest that it may reduce race response instability within the Hispanic group (by eliminating the request for a race response). The white, black, and Asian response groups show about the same levels of response change across age and sex groups and across different aggregation schemes.
Like all research, our work has limitations. Although we apply strict case selection rules, a small proportion of response changes are likely due to different individuals filling out the form, faulty data links, or post-enumeration processing issues. It is also possible that some people provided erroneous information, either by mistake or on purpose. We also are limited in the conclusions we can draw from these data; we have only two data points, we do not know who filled out the form, and census responses are not equivalent to identities. Our data over-represent people reported as non-Hispanic white (the most stable response group) and under-represent other response groups.
For almost all race response groups, response instability is an important factor to consider in analyses. When deciding on the number and types of questions to ask about race and ethnicity, study designers gathering data need to recognize that these are concepts with complexity (Page 2015) and they will not be able to be well-captured in a single, simple, one-time question. Multiple questions (about different aspects of the concepts) and repeated measures are likely to be increasingly necessary as the U.S. becomes even more diverse in terms of race/ethnic groups, immigrant generations, countries of immigration, and descendants of interracial unions.
When a survey has multiple questions about race and ethnicity, (e.g., race, ethnicity, ancestry, tribe, parent’s birthplace, or skin tone; see Roth 2016), researchers can combine and compare answers, find previously-hidden subpopulations, and apply the measure(s) most appropriate to the topic of study. For example, although their race responses often change, people reported as Hispanic white have a different socioeconomic and geographic profile than people reported as Hispanic SOR (Logan 2003).
Repeated measures – at each wave in panel data – allow practical and theoretical understanding of how the respondent’s current race/ethnicity, past race/ethnicity, and response stability are related to other factors such as their health, residential location, or educational attainment. Response change means that race-/ethnic-group-specific population sizes and characteristics can change for other reasons besides birth, death, migration, and individuals’ achievements such as a completed degree. When using cross-sectional data, researchers should caution readers that the given race/ethnic response is effective for that point in time (and that measurement strategy), and may or may not have been the same in the past, in the future, or when assessed with different measures. Although this is not a current practice with race and ethnicity data, this same caveat holds for most other measured characteristics, such as education, location, and marital status.
At a conceptual level, our results highlight an oft-stated declaration – race and ethnicity are complex, multifaceted constructs. People are constantly experiencing and negotiating their racial and ethnic identities in interactions with people and institutions, and in personal, local, national, and historical context. Some racial and ethnic identities cannot be effectively translated to a census or survey questionnaire fixed-category format. Given the many forces urging instability in responses, the fact that we did find response stability (93.9 percent of race/ethnic responses did not change) is a testament to the power of social norms and racial ideology in directing these responses.
Appendix
Appendix Table A.
Estimated race/Hispanic origin distribution of false matches
| Non-Hispanic | N in 2000 in data
|
proportion of 2000 pop in data
|
Est. # with false match (est 1% false match rate)
|
Of false matches, est. # matched to this group
|
Est. # erroneously coded as left/joined due to false match
|
For reference: Columns (C), (D), and (E) from Table 2 |
||
|---|---|---|---|---|---|---|---|---|
| Left category
|
Stayed in category
|
Joined category
|
||||||
| (A)
|
(B)
|
(C)= (A) × 1%
|
(D)= (B) × (C)
|
(E) = (C) − (D)
|
||||
| White alone | 124,765,953 | 0.772 | 1,247,660 | 962,679 | 284,980 | 2,000,840 | 122,765,113 | 1,391,841 |
| Black alone | 15,454,761 | 0.096 | 154,548 | 14,771 | 139,776 | 573,247 | 14,881,514 | 403,114 |
| AIAN alone | 1,045,627 | 0.006 | 10,456 | 68 | 10,389 | 322,301 | 723,326 | 319,398 |
| Asian alone | 5,599,943 | 0.035 | 55,999 | 1,939 | 54,060 | 264,709 | 5,335,234 | 240,569 |
| NHPI alone | 152,640 | 0.001 | 1,526 | 1 | 1,525 | 52,441 | 100,199 | 54,726 |
| SOR alone | 207,906 | 0.001 | 2,079 | 3 | 2,076 | 176,779 | 31,127 | 118,612 |
| White & Black | 416,956 | 0.003 | 4,170 | 11 | 4,159 | 167,597 | 249,359 | 249,089 |
| White & AIAN | 575,680 | 0.004 | 5,757 | 20 | 5,736 | 441,157 | 134,523 | 515,927 |
| White & Asian | 499,837 | 0.003 | 4,998 | 15 | 4,983 | 219,765 | 280,072 | 311,370 |
| White & NHPI | 56,300 | 0.000 | 563 | 0 | 563 | 34,958 | 21,342 | 42,575 |
| Black & AIAN | 79,222 | 0.000 | 792 | 0 | 792 | 62,789 | 16,433 | 82,488 |
| Black & Asian | 50,482 | 0.000 | 505 | 0 | 505 | 26,179 | 24,303 | 34,010 |
| Black & NHPI | 10,640 | 0.000 | 106 | 0 | 106 | 8,426 | 2,214 | 10,315 |
| AIAN & Asian | 21,344 | 0.000 | 213 | 0 | 213 | 18,868 | 2,476 | 13,492 |
| AIAN & NHPI | 2,393 | 0.000 | 24 | 0 | 24 | 1,948 | 445 | 2,221 |
| Asian & NHPI | 66,814 | 0.000 | 668 | 0 | 668 | 42,138 | 24,676 | 39,997 |
| 3 or more races | 138,292 | 0.001 | 1,383 | 1 | 1,382 | 88,261 | 50,031 | 150,702 |
| Hispanic | ||||||||
| White alone | 6,901,238 | 0.043 | 69,012 | 2,945 | 66,067 | 1,990,063 | 4,911,175 | 3,229,894 |
| Black alone | 238,070 | 0.001 | 2,381 | 4 | 2,377 | 140,753 | 97,317 | 182,655 |
| AIAN alone | 163,775 | 0.001 | 1,638 | 2 | 1,636 | 131,244 | 32,531 | 135,950 |
| Asian alone | 50,981 | 0.000 | 510 | 0 | 510 | 34,939 | 16,042 | 35,982 |
| NHPI alone | 12,245 | 0.000 | 122 | 0 | 122 | 10,014 | 2,231 | 8,953 |
| SOR alone | 5,011,234 | 0.031 | 50,112 | 1,553 | 48,559 | 2,835,721 | 2,175,513 | 1,438,711 |
| White & Black | 36,990 | 0.000 | 370 | 0 | 370 | 28,401 | 8,589 | 42,387 |
| White & AIAN | 59,341 | 0.000 | 593 | 0 | 593 | 49,418 | 9,923 | 61,623 |
| White & Asian | 31,756 | 0.000 | 318 | 0 | 317 | 20,819 | 10,937 | 25,917 |
| White & NHPI | 5,701 | 0.000 | 57 | 0 | 57 | 4,437 | 1,264 | 4,559 |
| Black & AIAN | 6,447 | 0.000 | 64 | 0 | 64 | 5,318 | 1,129 | 7,130 |
| Black & Asian | 2,966 | 0.000 | 30 | 0 | 30 | 2,199 | 767 | 2,620 |
| Black & NHPI | 823 | 0.000 | 8 | 0 | 8 | 734 | 89 | 849 |
| AIAN & Asian | 3,962 | 0.000 | 40 | 0 | 40 | 3,419 | 543 | 2,685 |
| AIAN & NHPI | 641 | 0.000 | 6 | 0 | 6 | 586 | 55 | 718 |
| Asian & NHPI | 4,908 | 0.000 | 49 | 0 | 49 | 3,647 | 1,261 | 3,387 |
| 3 or more races | 24,317 | 0.000 | 243 | 0 | 243 | 18,803 | 5,514 | 54,430 |
Total in 2000–> 161,700,185
Est. total cases with false match –> 1,617,002
Note: AIAN = American Indian/Alaska Native; NHPI = Native Hawaiian and other Pacific Islander; SOR = Some Other Race.
Appendix Table B.
Top 20 race/Hispanic response changes and characteristics of people within response change groups
| Total number in the linked data | Total N
|
Children
|
Women
|
In the West
|
Mail mode
|
||
|---|---|---|---|---|---|---|---|
| 161,700,185 | 41,541,446 | 84,953,197 | 34,105,404 | 90,255,482 | |||
| Total number, all changers | 9,782,918 | 3,980,365 | 5,086,352 | 3,860,816 | 4,116,311 | ||
|
| |||||||
| Rank | 2000 response | 2010 response | # Changing | Children | Women | In the West | Mail mode |
|
|
|
|
|
|
|
|
|
| 1 | Hispanic SOR | Hispanic White | 2,380,183 | 837,978 | 1,244,185 | 1,119,377 | 1,140,998 |
| 2 | Hispanic White | Hispanic SOR | 1,243,630 | 521,385 | 630,744 | 610,804 | 372,985 |
| 3 | White | Hispanic White | 710,019 | 367,441 | 372,630 | 236,918 | 362,400 |
| 4 | Hispanic White | White | 417,855 | 187,422 | 217,432 | 152,688 | 191,104 |
| 5 | White | White & AIAN | 404,209 | 129,190 | 207,714 | 109,315 | 135,908 |
| 6 | White & AIAN | White | 339,481 | 94,686 | 176,138 | 99,602 | 143,539 |
| 7 | White | White & Asian | 186,208 | 90,242 | 89,294 | 74,667 | 105,448 |
| 8 | White | AIAN | 173,415 | 58,060 | 86,451 | 40,138 | 58,939 |
| 9 | Hispanic White | Hisp. White & SOR | 163,826 | 68,937 | 84,469 | 71,798 | 73,700 |
| 10 | AIAN | White | 158,178 | 46,433 | 78,804 | 43,054 | 54,796 |
| 11 | Hispanic SOR | Hisp. White & SOR | 132,032 | 47,585 | 67,565 | 67,170 | 62,284 |
| 12 | Black | White & Black | 130,788 | 82,700 | 69,791 | 28,934 | 50,348 |
| 13 | Black | White | 112,882 | 32,745 | 57,727 | 15,859 | 29,514 |
| 14 | White & Asian | White | 102,888 | 45,575 | 49,308 | 39,922 | 49,722 |
| 15 | White | Black | 102,464 | 37,082 | 52,015 | 17,454 | 25,009 |
| 16 | AIAN | White & AIAN | 99,910 | 36,349 | 54,106 | 36,049 | 32,662 |
| 17 | Asian | White & Asian | 93,064 | 38,321 | 50,285 | 43,817 | 50,601 |
| 18 | White & Black | Black | 90,086 | 63,797 | 44,826 | 20,729 | 42,654 |
| 19 | White & AIAN | AIAN | 87,809 | 32,566 | 45,653 | 28,242 | 33,570 |
| 20 | White & Asian | Asian | 86,500 | 34,311 | 44,859 | 37,472 | 48,007 |
| All other race/Hispanic response changers | 2,567,491 | 1,127,560 | 1,362,356 | 966,807 | 1,052,123 | ||
Notes: Case counts include only people in the linked data. SOR = Some Other Race; AIAN = American Indian/Alaska Native; children = age 0–17 in 2000; West = lived in the west region in 2000; mail mode = responded to the census through the mail in both years. Responses are non-Hispanic unless noted.
Appendix Table C.
Percent with each type of response change/stability, by age, sex, and race/Hispanic response in 2000
| Ages 0–9 in 2000
|
Ages 10–17 in 2000
|
Ages 18–29 in 2000
|
Ages 30–44 in 2000
|
Ages 45 and older in 2000
|
||||||||||||||||
|---|---|---|---|---|---|---|---|---|---|---|---|---|---|---|---|---|---|---|---|---|
| % Same |
% Δ Race |
% Δ Hisp |
% Δ Both |
% Same |
% Δ Race |
% Δ Hisp |
% Δ Both |
% Same |
% Δ Race |
% Δ Hisp |
% Δ Both |
% Same |
% Δ Race |
% Δ Hisp |
% Δ Both |
% Same |
% Δ Race |
% Δ Hisp |
% Δ Both |
|
| MALES: | ||||||||||||||||||||
| Non-Hispanic response in 2000 | ||||||||||||||||||||
| White | 96.7 | 1.6 | 1.4 | 0.4 | 97.4 | 1.3 | 1.0 | 0.3 | 98.2 | 1.1 | 0.6 | 0.1 | 98.7 | 0.9 | 0.4 | 0.1 | 99.2 | 0.5 | 0.2 | 0.0 |
| Black | 94.7 | 4.1 | 0.7 | 0.4 | 95.1 | 3.8 | 0.7 | 0.4 | 95.4 | 3.8 | 0.5 | 0.3 | 96.9 | 2.7 | 0.3 | 0.1 | 97.7 | 2.0 | 0.2 | 0.1 |
| AIAN | 70.0 | 25.9 | 2.1 | 2.0 | 66.5 | 30.2 | 1.7 | 1.7 | 65.9 | 31.3 | 1.3 | 1.5 | 69.0 | 28.9 | 1.0 | 1.1 | 69.2 | 29.2 | 0.9 | 0.8 |
| Asian | 93.0 | 6.3 | 0.3 | 0.3 | 93.6 | 5.8 | 0.3 | 0.3 | 94.3 | 5.3 | 0.3 | 0.2 | 96.0 | 3.6 | 0.2 | 0.1 | 96.8 | 2.9 | 0.2 | 0.1 |
| NHPI | 62.2 | 32.2 | 1.5 | 4.0 | 63.1 | 33.1 | 1.1 | 2.7 | 61.2 | 35.6 | 0.9 | 2.4 | 69.4 | 28.2 | 0.8 | 1.6 | 70.4 | 27.7 | 0.7 | 1.2 |
| W & Black | 64.6 | 33.7 | 0.7 | 1.0 | 56.5 | 41.8 | 0.6 | 1.1 | 53.1 | 45.2 | 0.6 | 1.1 | 38.6 | 60.0 | 0.4 | 1.0 | 20.2 | 78.8 | 0.2 | 0.8 |
| W & AIAN | 27.8 | 69.8 | 0.7 | 1.6 | 18.8 | 79.7 | 0.4 | 1.1 | 17.7 | 81.1 | 0.3 | 0.9 | 21.7 | 77.5 | 0.2 | 0.6 | 23.1 | 76.4 | 0.1 | 0.4 |
| W & Asian | 65.9 | 32.5 | 0.8 | 0.8 | 56.3 | 42.2 | 0.7 | 0.8 | 53.9 | 44.8 | 0.5 | 0.8 | 45.7 | 53.3 | 0.4 | 0.6 | 30.7 | 68.1 | 0.4 | 0.7 |
| all others | 31.0 | 64.6 | 1.4 | 3.0 | 25.6 | 70.4 | 1.2 | 2.8 | 24.6 | 72.2 | 1.0 | 2.2 | 24.8 | 72.5 | 0.9 | 1.8 | 24.4 | 73.5 | 0.6 | 1.5 |
| Hispanic response in 2000 | ||||||||||||||||||||
| White | 64.0 | 27.2 | 8.2 | 0.6 | 62.4 | 28.7 | 8.3 | 0.5 | 65.6 | 27.3 | 6.6 | 0.5 | 72.5 | 22.6 | 4.6 | 0.3 | 82.1 | 13.7 | 4.0 | 0.2 |
| SOR | 44.4 | 52.9 | 0.3 | 2.5 | 46.5 | 51.0 | 0.2 | 2.2 | 43.6 | 54.4 | 0.1 | 1.9 | 44.6 | 54.0 | 0.1 | 1.3 | 38.9 | 59.9 | 0.1 | 1.2 |
| all others | 31.6 | 46.8 | 12.8 | 8.8 | 26.0 | 50.2 | 12.9 | 10.8 | 23.7 | 54.9 | 12.4 | 9.1 | 26.8 | 55.7 11.0 | 6.5 | 31.0 | 50.5 | 12.5 | 6.0 | |
| FEMALES: | ||||||||||||||||||||
| Non-Hispanic response in 2000 | ||||||||||||||||||||
| White | 96.5 | 1.6 | 1.4 | 0.4 | 97.3 | 1.3 | 1.1 | 0.3 | 98.1 | 1.1 | 0.7 | 0.2 | 98.7 | 0.8 | 0.4 | 0.1 | 99.3 | 0.5 | 0.2 | 0.0 |
| Black | 94.7 | 4.1 | 0.8 | 0.4 | 95.2 | 3.6 | 0.8 | 0.4 | 96.1 | 3.1 | 0.5 | 0.2 | 97.0 | 2.5 | 0.3 | 0.1 | 97.7 | 1.9 | 0.2 | 0.1 |
| AIAN | 69.7 | 26.1 | 2.1 | 2.1 | 66.1 | 30.2 | 1.9 | 1.8 | 69.2 | 28.0 | 1.4 | 1.4 | 71.7 | 26.3 | 1.1 | 0.9 | 71.1 | 27.4 | 0.8 | 0.7 |
| Asian | 93.0 | 6.3 | 0.3 | 0.4 | 93.0 | 6.3 | 0.4 | 0.3 | 94.3 | 5.2 | 0.3 | 0.2 | 96.1 | 3.4 | 0.3 | 0.1 | 96.9 | 2.7 | 0.3 | 0.1 |
| NHPI | 62.1 | 32.8 | 1.3 | 3.8 | 61.6 | 34.2 | 1.2 | 3.0 | 63.2 | 33.5 | 0.9 | 2.5 | 68.7 | 28.8 | 0.8 | 1.7 | 68.6 | 29.4 | 0.7 | 1.3 |
| W & Black | 66.1 | 32.1 | 0.8 | 1.0 | 61.7 | 36.0 | 0.9 | 1.4 | 57.9 | 40.2 | 0.6 | 1.2 | 42.2 | 56.2 | 0.5 | 1.1 | 21.7 | 77.0 | 0.3 | 1.0 |
| W & AIAN | 28.0 | 69.7 | 0.7 | 1.5 | 19.0 | 79.3 | 0.5 | 1.3 | 22.5 | 76.0 | 0.5 | 1.1 | 25.2 | 74.0 | 0.3 | 0.6 | 25.7 | 73.7 | 0.2 | 0.4 |
| W & Asian | 66.5 | 31.8 | 0.9 | 0.8 | 60.1 | 38.2 | 0.8 | 0.9 | 59.5 | 39.0 | 0.7 | 0.8 | 48.6 | 50.2 | 0.5 | 0.6 | 32.4 | 66.5 | 0.5 | 0.7 |
| all others | 31.0 | 64.6 | 1.5 | 3.0 | 26.2 | 69.6 | 1.2 | 3.0 | 27.8 | 68.8 | 1.1 | 2.3 | 27.7 | 69.6 | 0.9 | 1.8 | 25.9 | 72.2 | 0.6 | 1.3 |
| Hispanic response in 2000 | ||||||||||||||||||||
| White | 63.9 | 27.7 | 7.9 | 0.6 | 63.0 | 28.7 | 7.8 | 0.5 | 68.2 | 24.9 | 6.5 | 0.4 | 73.9 | 20.8 | 5.0 | 0.3 | 82.5 | 12.9 | 4.4 | 0.2 |
| SOR | 44.9 | 52.5 | 0.3 | 2.4 | 46.6 | 51.2 | 0.2 | 2.1 | 42.8 | 55.2 | 0.1 | 1.9 | 43.6 | 54.6 | 0.1 | 1.7 | 37.1 | 61.4 | 0.1 | 1.4 |
| all others | 31.8 | 47.4 | 12.4 | 8.4 | 27.2 | 49.8 | 13.2 | 9.8 | 29.3 | 49.9 | 12.8 | 8.0 | 29.8 | 50.6 | 12.9 | 6.8 | 31.5 | 48.0 | 14.1 | 6.4 |
Notes: Percentages include only people in the linked data. % Same = Race and Hispanic reports were the same in 2000 and 2010. % Δ Race = Race report differed between 2000 and 2010. % Δ Hisp = Hispanic report differed between 2000 and 2010. % Δ Both = Both race report and Hispanic report differed between 2000 and 2010. W = white; AIAN = American Indian/Alaska Native; NHPI = Native Hawaiian and other Pacific Islander; SOR = Some Other Race.
Appendix Table D.
Response change within common race/Hispanic aggregations
| (A) Number in 2000 |
(B) Left category |
(C) Stayed in category |
(D) Joined category |
(E) Number in 2010 |
|
|---|---|---|---|---|---|
| Alternative aggregations of White responses | |||||
| White alone, non-Hispanic | 124,765,953 | 2,000,840 | 122,765,113 | 1,391,841 | 124,156,954 |
| White alone or in comb., non-Hispanic | 126,447,824 | 1,635,457 | 124,812,367 | 1,384,149 | 126,196,516 |
| White alone, Hispanic or not | 131,667,191 | 2,863,029 | 128,804,162 | 3,493,861 | 132,298,023 |
| White alone or in comb., Hisp. or not | 133,506,014 | 2,235,805 | 131,270,209 | 3,635,860 | 134,906,069 |
| Alternative aggregations of Black responses | |||||
| Black alone, non-Hispanic | 15,454,761 | 573,247 | 14,881,514 | 403,114 | 15,284,628 |
| Black alone or in comb., non-Hispanic | 16,086,372 | 377,399 | 15,708,973 | 385,664 | 16,094,637 |
| Black alone, Hispanic or not | 15,692,831 | 593,704 | 15,099,127 | 465,473 | 15,564,600 |
| Black alone or in comb., Hisp. or not | 16,384,542 | 363,255 | 16,021,287 | 486,112 | 16,507,399 |
| Alternative aggregations of Asian responses | |||||
| Asian alone, non-Hispanic | 5,599,943 | 264,709 | 5,335,234 | 240,569 | 5,575,803 |
| Asian alone or in comb., non-Hispanic | 6,320,851 | 277,503 | 6,043,348 | 412,371 | 6,455,719 |
| Asian alone, Hispanic or not | 5,650,924 | 270,975 | 5,379,949 | 247,878 | 5,627,827 |
| Asian alone or in comb., Hispanic or not | 6,429,714 | 274,242 | 6,155,472 | 447,484 | 6,602,956 |
| Alternative aggregations of Hispanic responses | |||||
| Hispanic White alone | 6,901,238 | 1,990,063 | 4,911,175 | 3,229,894 | 8,141,069 |
| Hispanic SOR alone | 5,011,234 | 2,835,721 | 2,175,513 | 1,438,711 | 3,614,224 |
| Hispanic White or SOR or White-SOR | 11,912,472 | 906,113 | 11,006,359 | 1,097,717 | 12,104,076 |
| Hispanic of any race(s) | 12,589,061 | 680,096 | 11,908,965 | 1,085,049 | 12,994,014 |
| Alternative aggregations of American Indian or Alaska Native responses | |||||
| AIAN alone, non-Hispanic | 1,045,627 | 322,301 | 723,326 | 319,398 | 1,042,724 |
| AIAN alone or in comb., non-Hispanic | 1,800,942 | 680,804 | 1,120,138 | 807,872 | 1,928,010 |
| AIAN alone, Hispanic or not | 1,209,402 | 428,000 | 781,402 | 429,803 | 1,211,205 |
| AIAN alone or in comb., Hisp. or not | 2,050,652 | 819,995 | 1,230,657 | 1,009,166 | 2,239,823 |
| Alternative aggregations of Native Hawaiian and other Pacific Islander responses | |||||
| NHPI alone, non-Hispanic | 152,640 | 52,441 | 100,199 | 54,726 | 154,925 |
| NHPI alone or in comb., non-Hispanic | 346,590 | 85,548 | 261,042 | 111,709 | 372,751 |
| NHPI alone, Hispanic or not | 164,885 | 59,882 | 105,003 | 61,106 | 166,109 |
| NHPI alone or in comb., Hisp. or not | 380,422 | 90,957 | 289,465 | 130,676 | 420,141 |
| Categorization of multiple race responses | |||||
| Two or More Races, Hispanic or not | 2,095,812 | 1,090,939 | 1,004,873 | 2,063,585 | 3,068,458 |
Notes: Case counts include only people in the linked data. “in comb.” = in combination with another race or races. AIAN = American Indian/Alaska Native; NHPI = Native Hawaiian and other Pacific Islander; SOR = Some Other Race.
Footnotes
We use the terms “race,” “ethnicity,” and “Hispanic origin” in congruence with the federal statistical guidelines used to collect the data (Office of Management and Budget (OMB) 1997). Federally-defined race categories are: white, black or African American (“black” here), American Indian or Alaska Native (“American Indian” here), Asian, and Native Hawaiian or Other Pacific Islander (“Pacific Islander” here) (OMB 1997). The Census Bureau also uses a residual category called Some Other Race (“SOR” here). There are two federally-defined ethnicity categories: Hispanic and non-Hispanic. The ethnicity question is separate from the race question; see Figure 1.
We study all response changes in the same way but we acknowledge that each change has its own meaning and reasons. For example, adding or dropping a second race response could reflect a different identity phenomenon than switching responses from one single race to another.
Population churning (countervailing flows into and out of a response category) is (at most) minimally discussed in these reports.
This comparison is limited by differences in response mode (mail versus phone) and question format (multiple race responses invited versus one response invited).
The West region includes: Alaska, Arizona, California, Colorado, Hawaii, Idaho, Montana, Nevada, New Mexico, Oregon, Utah, Washington, and Wyoming.
Enumerators are involved when the household does not return the mailed census form, the address is in an area that consists of mostly seasonal homes, and in some extremely rural areas such as western American Indian reservations, Alaska Native areas, and rural Maine (Fallica et al. 2012; Walker et al. 2012).
The 63 race response categories (six race groups alone and in each combination) are not labeled in Figure 2 but are in the same order as Table 2 and in Census 2000 Summary File 1 (see U.S. Census Bureau 2007:6–1 to 6–3).
Recall that our case selection criteria exclude people whose 2000 data list them as multiple-race including SOR (62 race/Hispanic response categories); those 62 empty rows are not shown.
Two other common patterns (ranked 9th and 11th) also show race response changes by people who were consistently identified as Hispanic.
The vertical line in each column of Figure 3 marks the average among response changers, as shown in the second row above the table.
When group-specific response change rates are applied to the full Census 2000 population, the estimated rate of response change increases to 8.3 percent (Liebler et al. 2014).
Contributor Information
Carolyn A. Liebler, Email: Liebler@umn.edu.
Sonya R. Porter, Email: Sonya.Rastogi.Porter@census.gov.
References
- Adamczyk Amy, Boyd Katharine A, Hayes Brittany E. Place Matters: Contextualizing the Roles of Religion and Race for Understanding Americans’ Attitudes about Homosexuality. Social Science Research. 2016;57(2016):1–16. doi: 10.1016/j.ssresearch.2016.02.001. [DOI] [PubMed] [Google Scholar]
- Alba Richard, Islam Tarquil. The Case of the Disappearing Mexican Americans: An Ethnic-Identity Mystery. Population Research and Policy Review. 2009;28:109–121. [Google Scholar]
- Barth Fredrik. Ethnic Groups and Boundaries. Boston: Little, Brown, and Co; 1969. [Google Scholar]
- Bentley Michael, Mattingly Tracy, Hough Christine, Bennett Claudette. Census 2000 Evaluation B.3. Washington, DC: U.S. Census Bureau; 2003. Census Quality Survey to Evaluate Responses to the Census 2000 Question on Race: An Introduction to the Data. [Google Scholar]
- Bond Brittany, Brown J David, Luque Adela, O’Hara Amy. Proceedings of the 2013 Federal Committee on Statistical Methodology (FCSM) Research Conference. Washington, DC: 2013. The Nature of the Bias When Studying Only Linkable Person Records: Evidence from the American Community Survey. [Google Scholar]
- Bratter Jenifer. Will ‘Multiracial’ Survive to the Next Generation?: The Racial Classification of Children of Multiracial Parents. Social Forces. 2007;86(2):821–849. [Google Scholar]
- Brooks James F., editor. Confounding the Color Line: The Indian-Black Experience in North America. Lincoln: University of Nebraska Press; 2002. [Google Scholar]
- Brown J Scott, Hitlin Steven, Elder Glen H., Jr The Greater Complexity of Lived Race: An Extension of Harris and Sim. Social Science Quarterly. 2006;87(2):412–431. [Google Scholar]
- Chun Asaph Young, Gan Jessica. Joint Statistical Meetings Proceedings, Survey Research Methods Session. Alexandria, VA: American Statistical Association; 2014. Analysis of the Source of Group Quarters Enumeration Data in the 2010 Census. [Google Scholar]
- Compton Elizabeth, Bentley Michael, Ennis Sharon, Rastogi Sonya. 2010 Census Race and Hispanic Origin Alternative Questionnaire Experiment. Washington, DC: U.S. Census Bureau; 2012. (DSSD 2010 CPEX Memorandum Series #B-05-R, 2010 Census Planning Memoranda Series #211 U.S). [Google Scholar]
- DeFina Robert, Hannon Lance. Social Status Attainment and Racial Category Selection in the Contemporary United States. Research in Social Stratification and Mobility. 2016;44:91–97. [Google Scholar]
- Damaske Sarah, Frech Adrianne. Women’s Work Pathways Across the Life Course. Demography. 2016;53:365–391. doi: 10.1007/s13524-016-0464-z. [DOI] [PMC free article] [PubMed] [Google Scholar]
- Davenport Lauren D. The Role of Gender, Class, and Religion in Biracial Americans’ Racial Labeling Decisions. American Sociological Review. 2016;81(1):57–84. [Google Scholar]
- Davis F James. Who is Black? One Nation’s Definition. 10th Anniversary. University Park: Pennsylvania State University Press; 2001. [Google Scholar]
- del Pinal Jorge, Schmidley Dianne. Matched Race and Hispanic Origin Responses from Census 2000 and Current Population Survey February to May 2000. Washington, DC: U.S. Census Bureau; 2005. (Population Division Working Paper No. 79). [Google Scholar]
- Dowling Julie A. Mexican Americans and the Question of Race. Austin: University of Texas Press; 2014. [Google Scholar]
- Doyle Jamie M, Kao Grace. Are Racial Identities of Multiracials Stable? Changing Self-Identification among Single and Multiple Race Individuals. Social Psychology Quarterly. 2007;70(4):405–423. doi: 10.1177/019027250707000409. [DOI] [PMC free article] [PubMed] [Google Scholar]
- Dusch Gianna, Meier Fred. 2010 Census Program for Evaluations and Experiments. Washington, DC: U.S. Census Bureau; 2012. 2010 Census Content Reinterview Survey Evaluation Report. [Google Scholar]
- Elliott James R. Natural Hazards and Residential Mobility: General Patterns and Racially Unequal Outcomes in the United States. Social Forces. 2015;93(4):1723–1747. [Google Scholar]
- Emeka Amon, Vallejo Jody Agius. Non-Hispanics with Latin American Ancestry: Assimilation, Race, and Identity among Latin American Descendants in the US. Social Science Research. 2011;40:1547–1563. [Google Scholar]
- Erickson Erik. Identity and the Life Cycle. New York: Norton; 1980. [Google Scholar]
- Eschbach Karl. Changing Identification among American Indians and Alaska Natives. Demography. 1993;30(4):635–652. [PubMed] [Google Scholar]
- Eschbach Karl. The Enduring and Vanishing American Indian: American Indian Population Growth and Intermarriage in 1990. Ethnic and Racial Studies. 1995;18:89–108. [Google Scholar]
- Eschbach Karl, Gómez Christina. Choosing Hispanic Identity: Ethnic Identity Switching among Respondents to High School and Beyond. Social Science Quarterly. 1998;79(1):74–90. [Google Scholar]
- Eschbach Karl, Supple Khalil, Snipp C Matthew. Changes in Racial Identification and the Educational Attainment of American Indians, 1970–1990. Demography. 1998;35(1):35–43. [PubMed] [Google Scholar]
- Fallica Heather, Heimel Sarah, Jackson Geoff, Zhang Bei. 2010 Census Program for Evaluations and Experiments. Washington, DC: U.S. Census Bureau; 2012. 2010 Census Update Enumerate Operations Assessment: Update Enumerate Production, Update Enumerate Quality Control, Remote Update Enumerate, and Remote Alaska. [Google Scholar]
- Fitzgerald Kathleen J. Beyond White Ethnicity: Developing a Sociological Understanding of Native American Identity Reclamation. New York: Lexington Books; 2007. [Google Scholar]
- Gans Herbert. Symbolic Ethnicity: The Future of Ethnic Groups and Cultures in America. Ethnic and Racial Studies. 1979;2(1):1–20. [Google Scholar]
- Golash-Boza Tanya, Darity William., Jr Latino Racial Choices: The Effects of Skin Color and Discrimination on Latinos’ and Latinas’ Racial Self-identifications. Ethnic and Racial Studies. 2008;31(5):899–934. [Google Scholar]
- Grieco Elizabeth M, Cassidy Rachel C. Overview of Race and Hispanic origin. Washington, DC: U.S. Census Bureau; 2001. (Census 2000 Brief C2KBR/01-1). [Google Scholar]
- Gullickson Aaron, Morning Ann. Choosing Race: Multiracial Ancestry and Identification. Social Science Research. 2011;40:498–512. [Google Scholar]
- Guo Guang, Fu Yilan, Lee Hedwig, Cai Tianji, Harris Kathleen Mullan, Li Yi. Genetic Bio-Ancestry and Social Construction of Racial Classification in Social Surveys in the Contemporary United States. Demography. 2014;51(1):141–172. doi: 10.1007/s13524-013-0242-0. [DOI] [PMC free article] [PubMed] [Google Scholar]
- Haney López Ian F. White by Law: The Legal Construction of Race. New York: New York University Press; 1996. [Google Scholar]
- Harris David. The 1990 Census Count of American Indians: What Do the Numbers Really Mean? Social Science Quarterly. 1994;75(2):580–593. [Google Scholar]
- Harris David, Sim Jeremiah Joseph. Who is Multiracial? Assessing the Complexity of Lived Race. American Sociological Review. 2002;67(4):614–627. [Google Scholar]
- Hemenway David. The Myth of Millions of Annual Self-Defense Gun Uses: A Case Study of Survey Overestimates of Rare Events. Chance. 1997;10(3):6–10. [Google Scholar]
- Hixson Lindsay, Hepler Bradford B, Kim Myoung Ouk. The Native Hawaiian and Other Pacific Islander Population: 2010 Census 2010 Brief C2010BR-12. Washington, DC: U.S. Census Bureau; 2012. [Google Scholar]
- Humes Karen, Jones Nicholas, Ramirez Roberto. Overview of Race and Hispanic Origin: 2010. Washington, DC: U.S. Census Bureau; 2011. (2010 Census Brief C2010BR-02). [Google Scholar]
- Jones Nicholas A, Bullock Jungmiwha. Census 2010 Brief C2010BR-13. Washington, DC: U.S. Census Bureau; 2012. The Two or More Races Population: 2010. [Google Scholar]
- Kana’iaupuni Shawn, Liebler Carolyn A. Pondering Poi Dog: The Importance of Place to the Racial Identification of Mixed-race Native Hawaiians. Ethnic and Racial Studies. 2005;28:687–721. [Google Scholar]
- Katz William Loren. Black Indians: A Hidden Heritage. New York: Ethrac Publications; 1986. [Google Scholar]
- Khanna Nikki. The Role of Reflected Appraisals in Racial Identity: The Case of Multiracial Asians. Social Psychology Quarterly. 2004;67(2):115–131. [Google Scholar]
- Khanna Nikki, Johnson Cathryn. Passing as Black: Racial Identity Work among Biracial Americans. Social Psychology Quarterly. 2010;73:380–397. [Google Scholar]
- Korgen Kathleen. From Black to Biracial: Transforming Racial Identity among Biracial Americans. New York: Praeger; 1998. [Google Scholar]
- Krivo Lauren J, Byron Reginald A, Calder Catherine A, Peterson Ruth D, Browning Christopher R, Kwan Mei-Po, Lee Jae Yong. Patterns of Local Segregation: Do they Matter for Neighborhood Crime? Social Science Research. 2015;54:303–318. doi: 10.1016/j.ssresearch.2015.08.005. [DOI] [PubMed] [Google Scholar]
- Landale Nancy S, Oropesa RS. White, Black, or Puerto Rican? Racial Self-Identification among Mainland and Island Puerto Ricans. Social Forces. 2002;81(1):231–254. [Google Scholar]
- Lavrakas Paul J, Courser Matthew W, Diaz-Castillo Lillian. What a Difference a Word Can Make: New Research on the Differences between Hispanic ‘Origin’ and Hispanic ‘Identity’ and their Implications. Paper presented at the 2005 AAPOR meetings; Miami Beach, Florida. 2005. [Google Scholar]
- Layne Mary, Wagner Deborah, Rothhaas Cynthia. Center for Administrative Records Research and Applications. Washington, DC: U.S. Census Bureau; 2014. Estimating Record Linkage False Match Rate for the Person Identification Validation System. (CARRA Working Paper Series (CARRA-02-14)). [Google Scholar]
- Liebler Carolyn A. Ties on the Fringes of Identity. Social Science Research. 2004;33(4):702–723. [Google Scholar]
- Liebler Carolyn A. Homelands and Indigenous Identities in a Multiracial Era. Social Science Research. 2010;39:596–609. [Google Scholar]
- Liebler Carolyn A, Bhaskar Renuka, Porter Sonya R. Dynamics of Race: Joining, Leaving, and Staying in the American Indian/Alaska Native Race Category between 2000 and 2010. Demography. 2016;53(2):507–540. doi: 10.1007/s13524-016-0461-2. [DOI] [PMC free article] [PubMed] [Google Scholar]
- Liebler Carolyn A, Rastogi Sonya, Fernandez Leticia E, Noon James M, Ennis Sharon R. America’s Churning Races: Race and Ethnic Response Changes between Census 2000 and the 2010 Census. (Working Paper 2014-09).Center for Administrative Records Research and Applications (Census Bureau) 2014 [Google Scholar]
- Liebler Carolyn A. On the Boundaries of Race: Identification of Mixed-Heritage Children in the U.S., 1960 to 2010. Sociology of Race and Ethnicity. 2016 doi: 10.1177/2332649216632546. [DOI] [Google Scholar]
- Liebler Carolyn A, Ortyl Timothy. More than a Million new American Indians in 2000: Who are they? Demography. 2014;51(3):1101–1130. doi: 10.1007/s13524-014-0288-7. [DOI] [PMC free article] [PubMed] [Google Scholar]
- Logan John. Lewis Mumford Center for Comparative Urban and Regional Research. The University at Albany, State University of New York; 2003. How Race Counts for Hispanic Americans. [Google Scholar]
- Lopoo Leonard M, London Andrew S. Household Crowding During Childhood and Long-Term Education Outcomes. Demography. 2016;53:699–721. doi: 10.1007/s13524-016-0467-9. [DOI] [PubMed] [Google Scholar]
- Loveman Mara, Muniz Jeronimo O. How Puerto Rico Became White: Boundary Dynamics and Intercensus Racial Reclassification. American Sociological Review. 2007;72:915–939. [Google Scholar]
- Mehta Neil K, Lee Hedwig, Ylitalo Kelly R. Child Health in the United States: Recent Trends in Racial/Ethnic Disparities. Social Science and Medicine. 2013;95:6–15. doi: 10.1016/j.socscimed.2012.09.011. [DOI] [PMC free article] [PubMed] [Google Scholar]
- Miville Marie L, Constantine Madonna G, Baysden Matthew F, So-Lloyd Gloria. Chameleon Changes: An Exploration of Racial Identity Themes of Multiracial People. Journal of Counseling Psychology. 2005;52(4):507–516. [Google Scholar]
- Miyawaki Michael Hajime. Part-Latinos and Racial Reporting in the Census: An Issue of Question Format? Sociology of Race and Ethnicity. 2016;2(3):289–306. [Google Scholar]
- Mowen Thomas J, Stansfield Richard. Probing Change in Racial Self-identification: A Focus on Children of Immigrants. Sociology of Race and Ethnicity. 2016;2(3):323–337. [Google Scholar]
- Mule Thomas. Census Coverage Measurement Estimation Report: Summary of Estimates of Coverage of Persons in the United States. Washington, DC: U.S. Census Bureau; 2012. [Google Scholar]
- Nagel Joane. American Indian Ethnic Renewal: Red Power and the Resurgence of Identity and Culture. New York: Oxford University Press; 1996. [Google Scholar]
- Nash Gary B. “The Mixing of People” Ch. 12. In: Nash Gary B., editor. Red, White and Black: The Peoples of Early America. Englewood Cliffs, NJ: Prentice Hall; 1974. [Google Scholar]
- Office of Management and Budget. Revisions to the Standards for the Classification of Federal Data on Race and Ethnicity. Federal Register. 1997;62(210):58782–58790. [Google Scholar]
- Page Scott E. What Sociologists Should Know About Complexity. Annual Review of Sociology. 2015;41:21–41. [Google Scholar]
- Passel Jeffrey. Provisional Evaluation of the 1970 Census Count of American Indians. Demography. 1976;13(3):397–409. [PubMed] [Google Scholar]
- Passel Jeffrey. The Growing American Indian Population, 1960–1990 Beyond Demography. Population Research and Policy Review. 1997;16(1–2):11–31. [Google Scholar]
- Passel Jeffrey, Berman Patricia. Quality of 1980 Census data for American Indians. Social Biology. 1986;33:163–182. doi: 10.1080/19485565.1986.9988637. [DOI] [PubMed] [Google Scholar]
- Perdue Theda. “Mixed Blood” Indians: Racial Construction in the Early South. Athens: The University of Georgia Press; 2003. [Google Scholar]
- Perez Anthony Daniel, Hirschman Charles. Estimating Net Interracial Mobility in the U.S. A Residual Methods Approach. Sociological Methodology. 2009;39(1):31–71. doi: 10.1111/j.1467-9531.2009.01220.x. [DOI] [PMC free article] [PubMed] [Google Scholar]
- Porter Sonya R, Liebler Carolyn A, Noon James. An Outside View: What Observers Say About Others’ Races and Hispanic Origins. American Behavioral Scientist. 2016;60(4):465–497. [Google Scholar]
- Robertson Dwanna L. A Necessary Evil: Framing an American Indian Legal Identity. American Indian Culture and Research Journal. 2013;37(4):115–140. [Google Scholar]
- Rockquemore Kerry A. Between Black and White: Exploring the ‘Biracial Experience’. Race and Society. 1998;1(2):197–212. [Google Scholar]
- Rodríguez Clara E. Changing Race: Latinos, the Census, and the History of Ethnicity in the United States. New York: New York University Press; 2000. [Google Scholar]
- Root Maria P P., editor. The Multiracial Experience: Racial Borders as the New Frontier. Thousand Oaks, CA: Sage Publications; 1996. [Google Scholar]
- Root Maria. Experiences and Processes Affecting Racial Identity Development: Preliminary Results from the Biracial Sibling Project. Cultural Diversity and Mental Health. 1998;4(3):237–47. [PubMed] [Google Scholar]
- Roth Wendy. Race Migrations: Latinos and the Cultural Transformation of Race. Palo Alto, CA: Stanford University Press; 2012. [Google Scholar]
- Roth Wendy. The Multiple Dimensions of Race. Ethnic and Racial Studies. 2016;39(8):1310–1338. [Google Scholar]
- Saperstein Aliya, Gullickson Aaron. A ‘Mulatto Escape Hatch’ in the United States? Examining Evidence of Racial and Social Mobility during the Jim Crow Era. Demography. 2013;50(5):1921–1942. doi: 10.1007/s13524-013-0210-8. [DOI] [PubMed] [Google Scholar]
- Saperstein Aliya, Penner Andrew. Racial Fluidity and Inequality in the United States. American Journal of Sociology. 2012;118(3):676–727. [Google Scholar]
- Saperstein Aliya, Penner Andrew. Beyond the Looking Glass: Exploring Fluidity in Racial Self-Identification and Interviewer Classification. Sociological Perspectives. 2014;57(2):186–207. [Google Scholar]
- Saperstein Aliya, Penner Andrew M, Light Ryan. Racial Formation in Perspective: Connecting Individuals, Institutions, and Power Relations. Annual Review of Sociology. 2013;39:359–378. [Google Scholar]
- Singer Phyllis, Ennis Sharon R. Census 2000 Evaluation B.5. Washington, DC: U.S. Census Bureau; 2003. Census 2000 Content Reinterview Survey: Accuracy of Data for Selected Population and Housing Characteristics as Measured by Reinterview. [Google Scholar]
- Snipp C Matthew. Racial Measurement in the American Census: Past Practices and Implications for the Future. Annual Review of Sociology. 2003;29:563–588. [Google Scholar]
- Spickard Paul R. Who is an Asian? Who is a Pacific Islander? Monoracialism, Multiracial People, and Asian American Communities. In: Williams-León Teresa, Nakashima Cynthia L., editors. The Sum of Our Parts: Mixed-Heritage Asian Americans. Philadelphia: Temple University Press; 2001. pp. 13–24. [Google Scholar]
- Stokes Samantha, Reiser Courtney, Compton Elizabeth, Bentley Michael, Rothaas Cynthia. 2010 Census Program for Evaluations and Experiments. Washington, DC: U.S. Census Bureau; 2011. 2010 Census Alternative Questionnaire Experiment (AQE): Census 2000 Form Replication Panel. [Google Scholar]
- Stokes-Brown Atiya Kai. America’s Shifting Color Line? Reexamining Determinants of Latino Racial Self-Identification. Social Science Quarterly. 2012;93(2):309–332. [Google Scholar]
- Sturm Circe. Becoming Indian: The Struggle over Cherokee Identity in the Twenty-first Century. Santa Fe, NM: School for Advanced Research Press; 2011. [Google Scholar]
- Sweet Elizabeth. Who Fills Out the Census Questionnaire Study. Washington, DC: U.S. Census Bureau; 1994. (1990 DSSD REX Memorandum Series #PP-9). [Google Scholar]
- Tafoya Sonya. Shades of Belonging: Latinos and Racial Identity. Washington, DC: Pew Hispanic Center; 2004. [Google Scholar]
- Thornton Russell. Tribal Membership Requirements and the Demography of ‘Old’ and ‘New’ Native Americans. Population Research and Policy Review. 1997;16(1–2):33–42. [Google Scholar]
- U.S. Census Bureau. 1990 Census of Population and Housing Evaluation and Research Reports. Washington, DC: U.S. Census Bureau; 1993. Content Reinterview Survey: Accuracy of Data for Selected Population and Housing Characteristics as Measured by Reinterview. [Google Scholar]
- U.S. Census Bureau. Technical assessment of ACE Revision II. Washington, DC: U.S. Census Bureau; 2003. [Google Scholar]
- U.S. Census Bureau. Summary File 1: 2000 Census of Population and Housing Technical Documentation. Washington, DC: U.S. Census Bureau; 2007. [Google Scholar]
- Vargas Nicholas. Latina/o Whitening? Which Latina/os Self-Classify as White and Report Being Perceived as White by Other Americans? Du Bois Review. 2015;12(1):119–136. [Google Scholar]
- Wagner Deborah, Layne Mary. Center for Administrative Records Research and Applications. Washington, DC: U.S. Census Bureau; 2014. The Person Identification Validation System (PVS): Applying the Center for Administrative Records Research and Applications’ (CARRA) Record Linkage Software. (CARRA Working Paper Series (CARRA 01 14)). [Google Scholar]
- Walker Shelley, Winder Susanna, Jackson Geoff, Heimel Sarah. 2010 Census Program for Evaluations and Experiments. Washington, DC: U.S. Census Bureau; 2012. 2010 Census Nonresponse Followup Operations Assessment. [Google Scholar]
- Waters Mary C. Ethnic Options: Choosing Identities in America. Berkeley: University of California Press; 1990. [Google Scholar]
- Waters Mary C. Black Identities: West Indian Immigrant Dreams and American Realities. Cambridge: Harvard University Press; 1999. [Google Scholar]
- Wilkinson Sue. Constructing Ethnicity Statistics in Talk-in-interaction: Producing the ‘White European’. Discourse Society. 2011;22(3):343–361. [Google Scholar]
- Williams-León Teresa, Nakashima Cynthia L., editors. The Sum of Our Parts: Mixed-heritage Asian Americans. Philadelphia: Temple University Press; 2001. [Google Scholar]
- Wright Richard, Houston Serin, Ellis Mark, Holloway Steven, Hudson Margaret. Crossing Racial Lines: Geographies of Mixed-Race Partnering and Multiraciality in the United States. Progress in Human Geography. 2003;27(4):457–474. [Google Scholar]