

Abstract
Background
Diffusion kurtosis imaging (DKI) allows for assessment of diffusion influenced by microcellular structures. We analyzed DKI in suspected low-grade gliomas prior to histopathological diagnosis. The aim was to investigate if diffusion parameters in the perilesional normal-appearing white matter (NAWM) differed from contralesional white matter, and to investigate differences between glioma malignancy grades II and III and glioma subtypes (astrocytomas and oligodendrogliomas).
Patients and methods
Forty-eight patients with suspected low-grade glioma were prospectively recruited to this institutional review board-approved study and investigated with preoperative DKI at 3T after written informed consent. Patients with histologically proven glioma grades II or III were further analyzed (n=35). Regions of interest (ROIs) were delineated on T2FLAIR images and co-registered to diffusion MRI parameter maps. Mean DKI data were compared between perilesional and contralesional NAWM (student’s t-test for dependent samples, Wilcoxon matched pairs test). Histogram DKI data were compared between glioma types and glioma grades (multiple comparisons of mean ranks for all groups). The discriminating potential for DKI in assessing glioma type and grade was assessed with receiver operating characteristics (ROC) curves.
Results
There were significant differences in all mean DKI variables between perilesional and contralesional NAWM (p=<0.000), except for axial kurtosis (p=0.099). Forty-four histogram variables differed significantly between glioma grades II (n=23) and III (n=12) (p=0.003−0.048) and 10 variables differed significantly between ACs (n=18) and ODs (n=17) (p=0.011−0.050). ROC curves of the best discriminating variables had an area under the curve (AUC) of 0.657−0.815.
Conclusions
Mean DKI variables in perilesional NAWM differ significantly from contralesional NAWM, suggesting altered microstructure by tumor infiltration not depicted on morphological MRI. Histogram analysis of DKI data identifies differences between glioma grades and subtypes.
Key words: diffusion kurtosis imaging (DKI), glioma, perilesional, tumor infiltration, grade, subtype
Introduction
Gliomas are neoplasms arising from neuroglial or precursor cells. Neuropathological classification is based on dominant cell type, malignancy grade atypia (I–IV), cell density, mitosis, endothelial proliferation, necrosis and genetic tumor properties.1,2 Astrocytomas (ACs) and oligodendrogliomas (ODs) are the most prevalent histological glioma subtypes. Neuropathologically glioma grade II differs from grade III primarily based on cell density and proliferation and may present with similar imaging patterns on morphological Magnetic resonance imaging (MRI), showing high signal intensity on T2-weighted images. Grade II and III gliomas typically do not display necrosis or ring-like contrast enhancement as do gliomas grade IV.3-5
Imaging is an important tool in the preoperative evaluation of suspected low-grade gliomas as well as monitoring of treatment response and follow-up. MRI, that is non-invasive except for administration of contrast agent, is used to assess tumor extension but also to evaluate tumor heterogeneity and to identify higher-grade areas within low-grade tumors, preoperatively or as a sign of progression. Low-grade gliomas are associated with a more indolent clinical course compared to high-grade gliomas. The clinical course varies within the group of low-grade gliomas where ODs have a slower growth than ACs.6,7 Accurate preoperative radiological diagnosis is of special interest when tumors are located in or adjacent to eloquent areas because the time to surgery and neuropathological diagnosis might be prolonged in such cases. MRI also plays an important role in the follow-up of gliomas that are primarily not suitable for gross tumor resection.8
Gliomas have an infiltrating growth pattern in the white matter9,10, exemplified by their ability to grow in cranial nerves.11 Tumor infiltration is commonly assessed by morphological T2-weighted images where the high tumor signal defines the outer borders of the tumor.12 This concept of evaluating glioma growth through morphological MRI has been challenged by studies showing infiltrative growth in gliomas not perceived on T2-weighted images.13,14 Studies have shown tumor growth up to several centimeters outside the morphological T2-boundary on MRI.14-16 Jenkinson et al., found that ODs with intact 1p19q were more likely to show an infiltrating growth pattern despite having more sharp edges towards the surrounding brain on T2-weighted MRI.13 Perilesional microscopic tumor infiltration that is not visualized on morphological MRI may give rise to local tumor recurrence also in patients operated with radiologically radical tumor resection. Therefore, a better method for preoperative glioma border evaluation than T2-weighted signal changes is warranted.
Water diffusivity, the random motion of water molecules, in particular non-Gaussian, reflects tissue microstructure, in for example cellularity and edema.17 Diffusion kurtosis imaging (DKI) is an extension of diffusion tensor imaging (DTI) and provides quantitative information about how tissue water diffusion deviates from a normally distributed diffusion.18,19 DKI quantifies excess kurtosis, but also directional diffusivities from DTI and as such gives a more comprehensive analysis of tissue diffusion properties.20 Recently, histological evaluation and quantitative microscopy was used to show that high kurtosis in tumors is associated to both intra-voxel heterogeneity in cell density and high cell eccentricity.21
A limited number of studies have investigated DKI in gliomas (grade I–IV).17,22-25 Previous DKI studies have focused on the evaluation of differences in mean DKI parameters between low-grade gliomas (grade I–II) and high-grade gliomas (grade III–IV)22-25, while comparisons between specific grades or glioma subtypes have been limited. Glioma grade has also been evaluated by perfusion MRI with only a few studies showing differences between glioma grade II and grade III, and that by applying a histogram based approach.26-28
The aim of this prospective study is to investigate if diffusion parameters in the perilesional normal-appearing white matter (NAWM) differ from contralesional NAWM, and to investigate the role of DKI histogram analysis in discrimination between glioma malignancy grades (grade II vs. grade III) and glioma subtypes (AC vs. OD) in a cohort of patients with suspected low-grade gliomas.
Patients and methods
Forty-eight patients (> 18 years) with clinical and radiological suspected low-grade gliomas were prospectively recruited during 2010–2014. A patient suspected of having a low-grade glioma had an intra-axial brain lesion with high signal intensity on T2-weighted images with none or minimal contrast enhancement on morphological MRI. Ring-like contrast enhancement or areas of necrosis were exclusion criteria. The study was approved by the local ethics committee (regional ethical review board in Uppsala (Dnr 2010/015)) and was therefore performed in accordance with the ethical standards laid down in the 1964 Declaration of Helsinki and its later amendments. All patients (n = 48) gave written informed consent before taking part in the study.
Imaging was performed preoperatively on a 3 T MRI scanner with a 32-channel head coil (Achieva, Philips Healthcare, Best, the Netherlands) with morphological and diffusion sequences (Figure 1).
Figure 1.

MRI in a patient with an oligodendroglioma grade II in the right frontal lobe, non-smoothed images. (A) T2FLAIR, (B) Axial Kurtosis, (C) Axial Diffusivity, (D) Radial Kurtosis, (E) Radial Diffusivity, (F) Mean Diffusivity, (G) Fractional Anisotropy, color coded, (H) Mean Kurtosis. Mean, axial and radial diffusivity 10-3 mm2/sec, fractional anisotropy, mean, axial and radial kurtosis and fractional anisotropy are dimensionless.
Morphological MRI included axial T2FLAIR (TR/TE 11,000/125ms; 90 degree flip angle; 512 x 512 matrix; 0.45 x 0.45 x 6.00 mm3 voxel size) and T1-weighted spin echo sequences (TR/TE 600/10ms; 70 degree flip angle; 512 x 512 matrix; 0.45 x 0.45 x 5.00 mm3 voxel size) before and after gadobutrol contrast agent administration (Gadovist®, Bayer Schering Pharma, Berlin-Wedding, Germany). Morphological MRI sequences not assessed in this study were sagittal and axial T2-weighted turbo spin echo, coronal T2FLAIR, and sagittal T1-weighted 3D turbo field echo after contrast agent injection.
DKI was acquired with a SE-EPI sequence, and the following scan parameters were used: TR/TE 5,400 ms/76 ms; 27 slices with a thickness of 2 mm; SENSE = 2; 128 x 128 matrix; FoV 256 x 256 mm2; 15 diffusion encoding directions, with b = 0, 500, 1,000, 2,500, and 2,750 s/mm2, for a total scan time of 6 minutes. Selection of b-values was based on the protocol optimized by Poot et al.29 Post-processing was performed using in-house developed software, implemented in Matlab (The Mathworks, Natick, MA, USA). Motion and eddy current distortions were corrected by an extrapolation-based procedure that has superior performance for high b-value dMRI compared to the conventional method of registering to the volume acquired with b = 030, available at https://github.com/markus-nilsson/md-dmri. In this process, images were smoothed using 3D Gaussian kernel with a FWHM of 2 mm. This smoothing was performed to reduce the number of model misfits. The spatial smoothing was kept to a minimum by the conservative choice of kernel width. DTI parameter maps of mean diffusivity (MD) and fractional anisotropy (FA) were calculated based on volumes acquired with b ≤ 1,000 s/mm2. The mean of the kurtosis tensor (MK) was calculated as described by Latt et al.31, and Hansen et al.32
Axial T2FLAIR images were co-registered to Mean Diffusivity maps with the SPM8 toolbox (www.fil.ion.ucl.ac.uk/spm) using normalized mutual information with 7th-order B-spline interpolation. Co-registered images were visually assessed for correct re-alignment to source images. Manual Regions of interest (ROIs) placement was performed blinded to histopathological diagnosis on non-smoothed T2FLAIR images using in-house developed software. Increased signal intensity on T2FLAIR was regarded as tumor.33 To avoid artifacts, the most superior and the most inferior slice were excluded from analysis; also chemical shift artifacts were excluded. Perilesional volume ROIs were delineated in NAWM one voxel outside the suspected tumor area on T2FLAIR on three consecutive slices, avoiding bulk tumor and gray matter (74 ± 43 voxels (mean ± SD)). NAWM ROIs were delineated in the contralateral hemisphere white matter, lateral to the lateral ventricle (corona radiata) on four consecutive slices (131 ± 37 voxels (mean ± SD)). Three tumor volume ROIs (total tumor, central tumor, and peripheral tumor) were delineated on T2FLAIR as depicted in Figure 2 A–D. Total tumor ROIs were delineated 1 voxel inside the outer border of the increased signal on T2FLAIR images (3,087 ± 2,102 voxels (mean ± SD)) on all slices with tumor. Peripheral tumor ROIs (1,153 ± 595 voxels (mean ± SD)) were delineated one voxel inside the increased signal on T2FLAIR, one voxel wide on all slices with tumor. Central tumor ROIs were delineated with a margin of two voxels to the border of the FLAIR signal changes (1,491 ± 1,384 voxels (mean ± SD)). ROIs were then transferred to the co-registered diffusion maps and diffusion parameters (axial, radial and mean kurtosis; axial, radial and mean diffusivity; and FA) were extracted.
Figure 2.
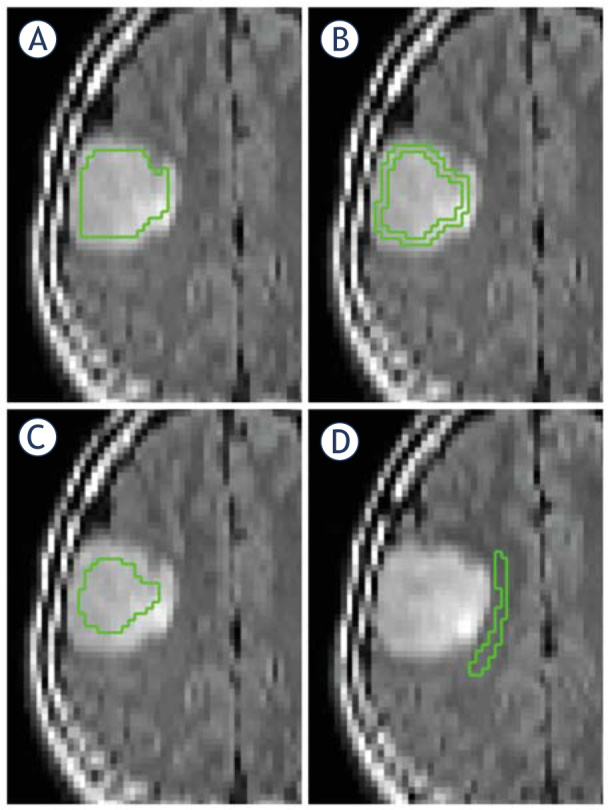
ROIs in a patient with an oligodendroglioma grade II. (A) Total tumor ROI. (B) Peripheral tumor ROI. (C) Central tumor ROI. (D) Perilesional ROI. All ROIs were drawn on non-smoothed images to increase the precision. ROI = region of interest
Statistical analysis
Data distribution was analyzed using the normal probability plot and Shapiro-Wilks W test. Nonnormally distributed data were analyzed with non-parametric tests and normally distributed data were analyzed with parametric tests. Statistical analysis was performed with Statistica 12 (Statsoft, Tulsa, OK, USA) software. A p value < 0.05 after correction for multiple comparisons was regarded as statistically significant. To test for differences between mean DKI histogram variables in perilesional compared to NAWM, the Student’s t test for dependent samples was used for normally distributed data and Wilcoxon matched pairs test for non-normally distributed data. Descriptive data of mean DKI variables for tumor grades and subtypes were calculated with mean and SD. Histograms with mean, standard deviation, skewness, kurtosis, peak height, peak position, 10th, 50th and 90th percentiles were calculated for all DKI variables in all ROIs. To adjust for interindividual differences between patients, ratios were calculated between tumor ROIs, perilesional ROIs and contralateral NAWM ROIs. To test for differences in relative DKI histogram variables between glioma grades II and III and between glioma subtypes ACs and ODs, a non-parametric test for multiple comparisons of mean ranks for all groups was performed with correction for multiple comparisons with Dunn’s test in each histogram group (mean, standard deviation, skewness, kurtosis, peak height, peak position, 10th, 50th and 90th percentiles). From the multiple comparisons analysis, receiver-operating characteristics (ROC) curves were calculated for variables with the lowest p-values. The area under the curve (AUC) and the diagnostic performance were calculated from ROC.
Results
Forty-eight patients were included in the study. Thirty-five patients had a postoperative neuropathological diagnosis of AC or OD grades II or III and data from these 35 patients are presented. Diagnosis was obtained by neuronavigation-guided needle biopsy (n = 4), open biopsy (n = 5), or resection sample (n = 26). The neuropathological diagnoses followed the 2007 WHO classification of brain tumors34, based on dominant cell type (AC or OD), cell density and proliferation (grade II vs. grade III). Included patients had a neuropathological diagnosis of AC II (n = 10), AC III (n = 8), OD II (n = 13) and OD III (n = 4). Mean age at diagnostic imaging was 48 ± 15 years (mean ± SD).
Significant differences in mean DKI variables were observed between perilesional white matter and contralateral NAWM (p = < 0.0000–0.0002) for all variables but axial kurtosis (p = 0.0994), with lower mean and radial kurtosis in perilesional white matter (Table 1). Fractional anisotropy and axial diffusivity were lower in the perilesional NAWM compared to contralesional white matter, while the mean diffusivity and radial diffusivity were higher in the perilesional NAWM.
Table 1.
Results from analysis of perilesional and contralesional normal-appearing white matter
| Diffusion histogram parameter | Perilesional NAWM | Contralesional NAWM | p |
|---|---|---|---|
| Mean (SD) (n = 35) | Mean (SD) (n = 35) | ||
| Axial diffusivity | 1.26 (0.14) | 1.38 (0.13) | 0.000182 |
| Radial diffusivity | 0.67 (0.10) | 0.53 (0.06) | 0.000001 |
| Fractional anisotropy | 0.40 (0.11) | 0.55 (0.09) | < 0.000000 |
| Axial kurtosis | 0.76 (0.07) | 0.73 (0.08) | 0.099422 |
| Radial kurtosis | 1.29 (0.24) | 1.63 (0.16) | < 0.000000 |
| Mean diffusivity | 0.87 (0.07) | 0.82 (0.04) | 0.000009 |
| Mean kurtosis | 0.95 (0.09) | 1.06 (0.05) | < 0.000000 |
Student’s t-test for dependent samples (normally distributed data) and Wilcoxon matched pairs test (non-normally distributed data). NAWM = Normal appearing white matter. Mean, axial and radial diffusivity 10-3 mm2/sec, fractional anisotropy, mean, axial and radial kurtosis and fractional anisotropy are dimensionless.
Mean DKI parameters from whole tumor (total tumor ROIs) are presented in table 2. Mean DKI variables did not differ significantly between glioma grades II (n = 23) and III (n = 12) or between ACs (n = 18) and ODs (n = 17) (p = 0.10–0.96).
Table 2.
Mean diffusion kurtosis imaging variables in tumor regions of interest (ROI) (mean (SD))
| Glioma subgroups | Grade II | Grade III | p | Astrocytoma | Oligodendroglioma | p |
|---|---|---|---|---|---|---|
| n = 23 | n = 12 | n = 18 | n = 17 | |||
| Axial diffusivity (mean (SD)) | 1.72 (0.19) | 1.81 (0.35) | 0.19 | 1.76 (0.28) | 1.74 (0.24) | 0.78 |
| Radial diffusivity (mean (SD)) | 1.44 (0.20) | 1.50 (0.34) | 0.52 | 1.47 (0.31) | 1.46 (0.17) | 0.71 |
| Fractional anisotropy (mean (SD)) | 0.12 (0.03) | 0.13 (0.04) | 0.22 | 0.13 (0.04) | 0.12 (0.03) | 0.10 |
| Axial kurtosis (mean (SD)) | 0.47 (0.08) | 0.48 (0.06) | 0.47 | 0.46 (0.06) | 0.49 (0.08) | 0.68 |
| Radial kurtosis (mean (SD)) | 0.53 (0.09) | 0.53 (0.08) | 0.77 | 0.52 (0.09) | 0.54 (0.09) | 0.54 |
| Mean diffusivity (mean (SD)) | 1.54 (0.19) | 1.60 (0.34) | 0.71 | 1.56 (0.30) | 1.55 (0.19) | 0.96 |
| Mean kurtosis (mean (SD)) | 0.50 (0.08) | 0.50 (0.07) | 0.50 | 0.49 (0.07) | 0.51 (0.09) | 0.66 |
All values are expressed as ratios normalized against contralateral normal appearing white matter. Mean, axial and radial diffusivity 10-3 mm2/sec, fractional anisotropy, mean, axial and radial kurtosis and fractional anisotropy are dimensionless.
The DKI histogram analysis identified 44 (out of 252) histogram variables (supplementary Table 1A) that significantly differed between glioma grades II and III (p = 0.0025–0.0476). Ten variables were statistically different between ACs and ODs (supplementary Table 1B) (p = 0.0110–0.0496). All results were adjusted for multiple comparisons.
The best discriminating DKI histogram variables between glioma grades II and III and between ACs grade II and III were derived from radial kurtosis in the peripheral tumor ROI (Table 3). The best discriminating variable between ODs grades II and III was derived from fractional anisotropy in the peripheral tumor ROI (Table 3). The best discriminating variables between ACs and ODs were derived from MD in central and perilesional ROIs (Table 3).
Table 3.
Results from multiple comparison test and receiver operating characteristics curves in groups and subgroups of gliomas
| p | AUC | |
|---|---|---|
| Discrimination between glioma grades II (n = 23) and III (n = 12) | ||
| The kurtosis of radial kurtosis in peripheral tumor ROI | 0.0025 | 0.8152 |
| Discrimination between astrocytoma grades II (n = 10) and III (n = 8) | ||
| The skewness of radial kurtosis in peripheral tumor ROI | 0.0034 | 0.8116 |
| Discrimination between oligodendroglioma grades II (n = 13) and III (n = 4) | ||
| The peak height of fractional anisotropy in peripheral tumor ROI | 0.0066 | 0.7391 |
| Discrimination between glioma types astrocytomas (n = 18) and oligodendrogliomas (n = 17) | ||
| The skewness of mean diffusivity in central tumor ROI | 0.0191 | 0.7320 |
| Discrimination between glioma types astrocytomas grade II (n = 10) and oligodendrogliomas grade II (n = 13) | ||
| The peak height of mean diffusivity in central tumor ROI | 0.0110 | 0.6601 |
| Discrimination between glioma types astrocytomas grade III (n = 8) and oligodendrogliomas grade III (n = 4) | ||
| The kurtosis of mean diffusivity in perilesion ROI | 0.0174 | 0.6569 |
Multiple comparison of mean ranks between groups of glioma grades and types of gliomas with Dunn’s correction for multiple comparisons. AUC = area under the curve. ROI = region of interest. All values are expressed as ratios normalized against contralateral normal appearing white matter.
Results from ROC calculations of the best discriminating DKI variable are presented in Table 3 with ROC figures presented in Figure 3. A full analysis of the discriminating properties of these variables is presented in supplementary Table 2.
Figure 3.
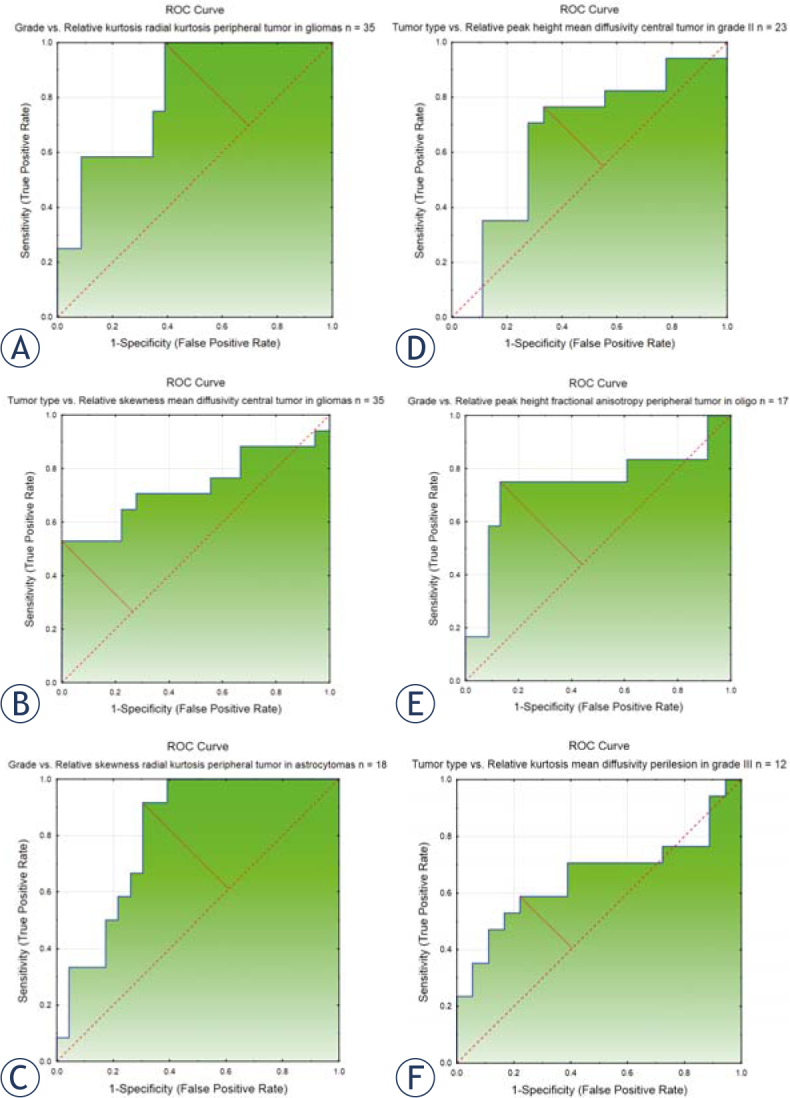
ROC curves presenting the best discriminating relative DKI histogram variables between glioma grades (II and III) and subtypes (astrocytomas and oligodendrogliomas). (A) Discrimination between glioma grades II and III with the kurtosis of radial kurtosis in peripheral tumor ROI, AUC = 0.815. (B) Discrimination between glioma subtypes astrocytoma and oligodendroglioma with the skewness of mean diffusivity in central tumor ROI, AUC = 0.732. (C) Discrimination between glioma grades II and III in astrocytomas with the skewness of radial kurtosis in peripheral tumor ROI, AUC = 0.812. (D) Discrimination between glioma subtypes astrocytoma and oligodendroglioma in gliomas grade II with the peak height of mean diffusivity in central tumor ROI, AUC = 0.660. (E) Discrimination between glioma grades II and III in oligodendrogliomas, with the peak height of fractional anisotropy in peripheral tumor ROI, AUC = 0.739. (F) Discrimination between glioma subtypes astrocytoma and oligodendroglioma in gliomas grade III with the kurtosis of mean diffusivity in perilesional ROI, AUC = 0.657.
AUC = area under the curve; ROC = receiver operating characteristic; ROI = region of interest
Discussion
We investigated preoperative DKI in patients with suspected low-grade gliomas to analyze differences in DKI parameters between perilesional and contralesional NAWM and between malignancy grades and histological subtypes.
DKI parameters in perilesional NAWM differed significantly from contralesional NAWM. A higher mean diffusivity and lower fractional anisotropy is a characteristic diffusional pattern for white matter tumor infiltration.35 A lower kurtosis in the perilesional white matter supports the rearrangement of white matter microstructure associated with tumor infiltration. Lower axial diffusivity reflects a less organized structure in gliomas compared to normal white matter structure, and a higher radial diffusivity reflects the non-demyelinating nature of tumor infiltration.36
The perilesional NAWM was defined as the area outside of the high signal intensity tumor on T2-weighted images. The high T2-signal correlates to the area of the tumor but is an inefficient method to describe less dense cell concentration present in the periphery of diffusely infiltrating gliomas.9,12,14,16 Since pure vasogenic edema is rare in suspected low-grade gliomas we believe that the risk of misclassifying tumor infiltration edema for pure vasogenic edema in this cohort is small.12
Our findings that DKI parameters in the perilesional NAWM differ from contralateral NAWM can be interpreted as the presence of peritumoral infiltration.14 This advantage of DKI over morphological T2-weighted d images allows for a more exact appreciation of the tumor invasion into the brain parenchyma prior to the planning of surgery and/or radiation therapy.12 There is accumulating evidence that the extent of tumor resection in low-grade gliomas correlates with improved survival.37 The presence of perilesional infiltration supports the concept of supratotal tumor resection.38 DKI parameters from the preoperative MRI would thus potentially be helpful in the pre-surgical/radiation planning.
We identified 44 histogram variables with significant differences between glioma grades II and III (supplementary Table 1A). Variables with the lowest p-value and highest AUC from ROC-analysis were all derived from the peripheral tumor ROIs and two out of the three best discriminating variables were derived from histogram parameters of radial kurtosis (Table 3). The differences in radial kurtosis between glioma grades II and III may be related to structural re-arrangements in microarchitecture when grade II tumors progress into malignant gliomas. Our results are in agreement with those by Raab et al.17, who found no difference in mean FA between ACs grade II and III. Our results are also in line with a report by Murakami et al.39, who reported no significant differences in minimum, average or maximum ADC (MD) between ACs grades II and III.39 Our data differs from the recent paper by Jiang et al.24, who found significant differences in mean kurtosis between glioma grades II and III using a semiautomatic process. This discrepancy could be attributed to the fact that the patient cohort in our study only include suspected low-grade gliomas, possibly selecting cases of grade III gliomas more similar in radio-logic appearance and biology than a non-selected group of gliomas including all four glioma grades (WHO grade I–IV). In our study cohort, none of the included patients showed ring like contrast enhancement with central necrosis on conventional MRI, and therefore we were unlikely to include any cases of gliomas grade IV neuropathologically misdiagnosed as grade III.
The partition of ROIs into peripheral and central zones is based on the concept of glioma growth. Gliomas show infiltrating growth outside the outer tumor boundaries appreciated on T2-weighted MRI but tend to recur centrally after radiation therapy, where the cell density is highest.10 Infiltration length outside the T2-hyperintensity has been estimated mathematically and confirmed through biopsy series10 and by en-bloc resections outside the radiological tumor borders.14 Our data confirm both the concept of differences in biological structure in the central and peripheral tumor portion of gliomas, but also the presence of biological microstructural changes outside the boundaries appreciated on morphological T2-weighted images.
Ten histogram variables differed significantly between ACs with ODs (supplementary Table 1B). The best discriminating variable was derived from the MD, which showed different skewness, peak height and kurtosis between astrocytic and oligodendroglial tumors. MD measures the average diffusion between several directions without directional information. While ACs and ODs share a common histogenetic origin they differ in their histological appearances. ACs are recognized through their neoplastic astrocytes with slightly elongated nuclei on a background of multiple fibrillary dendrites expressing glial fibrillary acidic protein (GFAP) while ODs display higher cell density with monomorphic cells with uniformly round nuclei and perinuclear halos.34,40 These differences in extracellular space composition may explain differences in MD between ACs and ODs.
MD histograms have previously been used to discriminate ACs from ODs. In 2007, Tozer et al.41, differentiated glioma subtypes in a cohort of 27 gliomas grade II by ADC histogram analysis. They performed the MRI post-biopsy, and in agreement with our study, mean ADCs could not alone separate the different subtypes. In 2009 Bian et al.42, and Khayal et al.43, reported on a group of gliomas grade II analyzing ADC histograms in nonenhancing tumor regions and found significant differences between ODs and ACs for histogram variables. Our results that the peak height of MD in central tumor ROI differ between ACs and ODs grade II are in agreement with Khayal et al.43 who found significant differences in the 75th percentile of ADC between ACs and ODs grade II. Also in agreement with our study, Lam et al.44, when assessing 17 glioma patients reported no difference in mean ADCs between ODs and non-OD. If glial subtypes could be assessed without the need for surgery, patients deemed inoperable due to tumor location could have a higher probability of receiving adequate treatment, since ODs have shown better prognosis and clinical effect when receiving chemotherapeutics.45
One limitation to our study is the manual definition of tumor and perilesional ROIs. We minimized the risk of bias in ROI-delineation by choosing a method that could easily be standardized between patients. Therefore we analyzed the whole tumor area seen as high signal intensity on T2FLAIR. Our methodology strives to assess the major diffusional properties of gliomas and minimize the risk of selection bias that may be introduced when small ROIs are selected. In addition, analyzing small ROIs may result in large inter-observer variations. Further, a manually defined ROI reflects a clinical setting. Another limitation to our study might be attributed to the limited number of included patients. Despite this, our cohort of gliomas grades II and III is equal to or larger than in previously published DKI studies.17,22
In summary, we investigated histogram DKI analysis in a prospectively gathered cohort of patients with suspected low-grade gliomas. We conclude that DKI variables in perilesional NAWM differ significantly from contralesional NAWM, suggesting an altered microstructure not depicted on morphological MRI. Further, histogram analysis of DKI data identifies differences between glioma grades II and III and between astrocytomas and oligodendrogliomas not apparent through comparisons of mean DKI parameters. Future glioma studies should analyze the extent of tumor cell infiltration outside the high signal intensity on T2FLAIR and correlate DKI-data with co-localized neuropathological data.
Acknowledgement
Uppsala county council has provided financial support for the study. Grant from Swedish cancer society.
Footnotes
Disclosure: No potential conflicts of interest were disclosed.
References
- 1.Ostrom QT, Gittleman H, Farah P, Ondracek A, Chen Y, Wolinsky Y. et al. CBTRUS statistical report: Primary brain and central nervous system tumors diagnosed in the United States in 2006-2010. Neuro Oncol. 2013;Suppl 2:1–56. doi: 10.1093/neuonc/not151. [DOI] [PMC free article] [PubMed] [Google Scholar]
- 2.Louis DN, Perry A, Reifenberger G, von Deimling A, Figarella-Branger D, Cavenee WK. et al. The 2016 World Health Organization classification of tumors of the central nervous system: a summary. Acta Neuropathol. 2016;131:803–20. doi: 10.1007/s00401-016-1545-1. [DOI] [PubMed] [Google Scholar]
- 3.Fan GG, Deng QL, Wu ZH, Guo QY. Usefulness of diffusion/perfusion-weighted MRI in patients with non-enhancing supratentorial brain gliomas: a valuable tool to predict tumour grading? Br J Radiol. 2006;79:652–8. doi: 10.1259/bjr/25349497. [DOI] [PubMed] [Google Scholar]
- 4.Schafer ML, Maurer MH, Synowitz M, Wustefeld J, Marnitz T, Streitparth F. et al. Low-grade (WHO II) and anaplastic (WHO III) gliomas: differences in morphology and MRI signal intensities. Eur Radiol. 2013;23:2846–53. doi: 10.1007/s00330-013-2886-y. [DOI] [PubMed] [Google Scholar]
- 5.Law M, Yang S, Wang H, Babb JS, Johnson G, Cha S. et al. Glioma grading: sensitivity, specificity, and predictive values of perfusion MR imaging and proton MR spectroscopic imaging compared with conventional MR imaging. AJNR Am J Neuroradiol. 2003;24:1989–98. [PMC free article] [PubMed] [Google Scholar]
- 6.Okamoto Y, Di Patre PL, Burkhard C, Horstmann S, Jourde B, Fahey M. et al. Population-based study on incidence, survival rates, and genetic alterations of low-grade diffuse astrocytomas and oligodendrogliomas. Acta Neuropathol. 2004;108:49–56. doi: 10.1007/s00401-004-0861-z. [DOI] [PubMed] [Google Scholar]
- 7.Gupta M, Djalilvand A, Brat DJ. Clarifying the diffuse gliomas: an update on the morphologic features and markers that discriminate oligodendroglioma from astrocytoma. Am J Clin Pathol. 2005;124:755–68. doi: 10.1309/6JNX-4PA6-0TQ5-U5VG. [DOI] [PubMed] [Google Scholar]
- 8.Ius T, Angelini E, Thiebaut de Schotten M, Mandonnet E, Duffau H. Evidence for potentials and limitations of brain plasticity using an atlas of functional resectability of WHO grade II gliomas: towards a “minimal common brain”. Neuroimage. 2011;56:992–1000. doi: 10.1016/j.neuroimage.2011.03.022. [DOI] [PubMed] [Google Scholar]
- 9.Smits A, Zetterling M, Lundin M, Melin B, Fahlstrom M, Grabowska A. et al. Neurological impairment linked with cortico-subcortical infiltration of diffuse low-grade gliomas at initial diagnosis supports early brain plasticity. Front Neurol. 2015;6:137. doi: 10.3389/fneur.2015.00137. [DOI] [PMC free article] [PubMed] [Google Scholar]
- 10.Unkelbach J, Menze BH, Konukoglu E, Dittmann F, Ayache N, Shih HA. Radiotherapy planning for glioblastoma based on a tumor growth model: implications for spatial dose redistribution. Phys Med Biol. 2014;59:771–89. doi: 10.1088/0031-9155/59/3/771. [DOI] [PubMed] [Google Scholar]
- 11.Mabray MC, Glastonbury CM, Mamlouk MD, Punch GE, Solomon DA, Cha S. Direct cranial nerve involvement by gliomas: case series and review of the literature. AJNR Am J Neuroradiol. 2015;36:1349–54. doi: 10.3174/ajnr.A4287. [DOI] [PMC free article] [PubMed] [Google Scholar]
- 12.Kelly PJ, Daumas-Duport C, Scheithauer BW, Kall BA, Kispert DB. Stereotactic histologic correlations of computed tomography- and magnetic resonance imaging-defined abnormalities in patients with glial neoplasms. Mayo Clin Proc. 1987;62:450–9. doi: 10.1016/s0025-6196(12)65470-6. [DOI] [PubMed] [Google Scholar]
- 13.Jenkinson MD, du Plessis DG, Smith TS, Joyce KA, Warnke PC, Walker C. Histological growth patterns and genotype in oligodendroglial tumours: correlation with MRI features. Brain. 2006;129:1884–91. doi: 10.1093/brain/awl108. [DOI] [PubMed] [Google Scholar]
- 14.Zetterling M, Roodakker KR, Berntsson SG, Edqvist PH, Latini F, Landtblom AM. et al. Extension of diffuse low-grade gliomas beyond radiological borders as shown by the coregistration of histopathological and magnetic resonance imaging data. J Neurosurg. 2016;125:1155–66. doi: 10.3171/2015.10.JNS15583. [DOI] [PubMed] [Google Scholar]
- 15.Pallud J, Varlet P, Devaux B, Geha S, Badoual M, Deroulers C. et al. Diffuse low-grade oligodendrogliomas extend beyond MRI-defined abnormalities. Neurology. 2010;74:1724–31. doi: 10.1212/WNL.0b013e3181e04264. [DOI] [PubMed] [Google Scholar]
- 16.Price SJ, Jena R, Burnet NG, Hutchinson PJ, Dean AF, Pena A. et al. Improved delineation of glioma margins and regions of infiltration with the use of diffusion tensor imaging: an image-guided biopsy study. AJNR Am J Neuroradiol. 2006;27:1969–74. [PMC free article] [PubMed] [Google Scholar]
- 17.Raab P, Hattingen E, Franz K, Zanella FE, Lanfermann H. Cerebral gliomas: diffusional kurtosis imaging analysis of microstructural differences. Radiology. 2010;254:876–81. doi: 10.1148/radiol.09090819. [DOI] [PubMed] [Google Scholar]
- 18.Basser PJ, Mattiello J, LeBihan D. MR diffusion tensor spectroscopy and imaging. Biophys J. 1994;66:259–67. doi: 10.1016/S0006-3495(94)80775-1. [DOI] [PMC free article] [PubMed] [Google Scholar]
- 19.Jensen JH, Helpern JA, Ramani A, Lu H, Kaczynski K. Diffusional kurtosis imaging: the quantification of non-gaussian water diffusion by means of magnetic resonance imaging. Magn Reson Med. 2005;53:1432–40. doi: 10.1002/mrm.20508. [DOI] [PubMed] [Google Scholar]
- 20.Cheung MM, Hui ES, Chan KC, Helpern JA, Qi L, Wu EX. Does diffusion kurtosis imaging lead to better neural tissue characterization? A rodent brain maturation study. Neuroimage. 2009;45:386–92. doi: 10.1016/j.neuroimage.2008.12.018. [DOI] [PubMed] [Google Scholar]
- 21.Szczepankiewicz F, van Westen D, Englund E, Westin CF, Stahlberg F, Latt J. et al. The link between diffusion MRI and tumor heterogeneity: Mapping cell eccentricity and density by diffusional variance decomposition (DIVIDE) Neuroimage. 2016;142:522–3. doi: 10.1016/j.neuroimage.2016.07.038. [DOI] [PMC free article] [PubMed] [Google Scholar]
- 22.Van Cauter S, Veraart J, Sijbers J, Peeters RR, Himmelreich U, De Keyzer F. et al. Gliomas: diffusion kurtosis MR imaging in grading. Radiology. 2012;263:492–501. doi: 10.1148/radiol.12110927. [DOI] [PubMed] [Google Scholar]
- 23.Van Cauter S, De Keyzer F, Sima DM, Sava AC, D’Arco F, Veraart J. et al. Integrating diffusion kurtosis imaging, dynamic susceptibility-weighted contrast-enhanced MRI, and short echo time chemical shift imaging for grading gliomas. Neuro Oncol. 2014;16:1010–21. doi: 10.1093/neuonc/not304. [DOI] [PMC free article] [PubMed] [Google Scholar]
- 24.Jiang R, Jiang J, Zhao L, Zhang J, Zhang S, Yao Y. et al. Diffusion kurtosis imaging can efficiently assess the glioma grade and cellular proliferation. Oncotarget. 2015;6:42380–93. doi: 10.18632/oncotarget.5675. [DOI] [PMC free article] [PubMed] [Google Scholar]
- 25.Tietze A, Hansen MB, Ostergaard L, Jespersen SN, Sangill R, Lund TE. et al. Mean diffusional kurtosis in patients with glioma: initial results with a fast imaging method in a clinical setting. AJNR Am J Neuroradiol. 2015;36:1472–8. doi: 10.3174/ajnr.A4311. [DOI] [PMC free article] [PubMed] [Google Scholar]
- 26.Arevalo-Perez J, Peck KK, Young RJ, Holodny AI, Karimi S, Lyo JK. Dynamic Contrast-enhanced perfusion mri and diffusion-weighted imaging in grading of gliomas. J Neuroimaging. 2015;25:792–8. doi: 10.1111/jon.12239. [DOI] [PMC free article] [PubMed] [Google Scholar]
- 27.Falk A, Fahlstrom M, Rostrup E, Berntsson S, Zetterling M, Morell A. et al. Discrimination between glioma grades II and III in suspected low-grade gliomas using dynamic contrast-enhanced and dynamic susceptibility contrast perfusion MR imaging: a histogram analysis approach. Neuroradiol. 2014;56:1031–8. doi: 10.1007/s00234-014-1426-z. [DOI] [PubMed] [Google Scholar]
- 28.Emblem KE, Due-Tonnessen P, Hald JK, Bjornerud A, Pinho MC, Scheie D. et al. Machine learning in preoperative glioma MRI: survival associations by perfusion-based support vector machine outperforms traditional MRI. J Magn Reson Imaging. 2014;40:47–54. doi: 10.1002/jmri.24390. [DOI] [PubMed] [Google Scholar]
- 29.Poot DH, den Dekker AJ, Achten E, Verhoye M, Sijbers J. Optimal experimental design for diffusion kurtosis imaging. IEEE Trans Med Imaging. 2010;29:819–29. doi: 10.1109/TMI.2009.2037915. [DOI] [PubMed] [Google Scholar]
- 30.Klein S, Staring M, Murphy K, Viergever MA, Pluim JP. Elastix: a toolbox for intensity-based medical image registration. IEEE Trans Med Imaging. 2010;29:196–205. doi: 10.1109/TMI.2009.2035616. [DOI] [PubMed] [Google Scholar]
- 31.Lätt J NM, Brockstedt S, Wirestam R, Ståhlberg F. Bias free estimates of the diffusional kurtosis in two minutes: Avoid solving the kurtosis tensor. ISMRM: International society for magnetic resonance in medicine. 2010 [Google Scholar]
- 32.Hansen B, Lund TE, Sangill R, Jespersen SN. Experimentally and computationally fast method for estimation of a mean kurtosis. Magn Reson Med. 2013;69:1754–60. doi: 10.1002/mrm.24743. [DOI] [PubMed] [Google Scholar]
- 33.Gerin C, Pallud J, Deroulers C, Varlet P, Oppenheim C, Roux FX. et al. Quantitative characterization of the imaging limits of diffuse low-grade oligodendrogliomas. Neuro Oncol. 2013;15:1379–88. doi: 10.1093/neuonc/not072. [DOI] [PMC free article] [PubMed] [Google Scholar]
- 34.Louis DN, Ohgaki H, Wiestler OD, Cavenee WK, Burger PC, Jouvet A. et al. The 2007 WHO classification of tumours of the central nervous system. Acta Neuropathol. 2007;114:97–109. doi: 10.1007/s00401-007-0243-4. [DOI] [PMC free article] [PubMed] [Google Scholar]
- 35.Wang S, Zhou J. Diffusion tensor magnetic resonance imaging of rat glioma models: a correlation study of MR imaging and histology. J Comput Assist Tomogr. 2012;36:739–44. doi: 10.1097/RCT.0b013e3182685436. [DOI] [PMC free article] [PubMed] [Google Scholar]
- 36.Karlsgodt KH, Rosser T, Lutkenhoff ES, Cannon TD, Silva A, Bearden CE. Alterations in white matter microstructure in neurofibromatosis-1. PloS One. 2012;7:e47854. doi: 10.1371/journal.pone.0047854. [DOI] [PMC free article] [PubMed] [Google Scholar]
- 37.Jakola AS, Myrmel KS, Kloster R, Torp SH, Lindal S, Unsgard G. et al. Comparison of a strategy favoring early surgical resection vs a strategy favoring watchful waiting in low-grade gliomas. JAMA. 2012;308:1881–8. doi: 10.1001/jama.2012.12807. [DOI] [PubMed] [Google Scholar]
- 38.Yordanova YN, Moritz-Gasser S, Duffau H. Awake surgery for WHO Grade II gliomas within “noneloquent” areas in the left dominant hemisphere: toward a “supratotal” resection. Clinical article. J Neurosurg. 2011;115:232–9. doi: 10.3171/2011.3.JNS101333. [DOI] [PubMed] [Google Scholar]
- 39.Murakami R, Hirai T, Sugahara T, Fukuoka H, Toya R, Nishimura S. et al. Grading astrocytic tumors by using apparent diffusion coefficient parameters: superiority of a one- versus two-parameter pilot method. Radiology. 2009;251:838–45. doi: 10.1148/radiol.2513080899. [DOI] [PubMed] [Google Scholar]
- 40.Kinjo S, Hirato J, Nakazato Y. Low grade diffuse gliomas: shared cellular composition and morphometric differences. Neuropathology. 2008;28:455–65. doi: 10.1111/j.1440-1789.2008.00897.x. [DOI] [PubMed] [Google Scholar]
- 41.Tozer DJ, Jager HR, Danchaivijitr N, Benton CE, Tofts PS, Rees JH. et al. Apparent diffusion coefficient histograms may predict low-grade glioma subtype. NMR Biomed. 2007;20:49–57. doi: 10.1002/nbm.1091. [DOI] [PubMed] [Google Scholar]
- 42.Bian W, Khayal IS, Lupo JM, McGue C, Vandenberg S, Lamborn KR. et al. Multiparametric characterization of grade 2 glioma subtypes using magnetic resonance spectroscopic, perfusion, and diffusion imaging. Transl Oncol. 2009;2:271–80. doi: 10.1593/tlo.09178. [DOI] [PMC free article] [PubMed] [Google Scholar]
- 43.Khayal IS, McKnight TR, McGue C, Vandenberg S, Lamborn KR, Chang SM. et al. Apparent diffusion coefficient and fractional anisotropy of newly diagnosed grade II gliomas. NMR Biomed. 2009;22:449–55. doi: 10.1002/nbm.1357. [DOI] [PMC free article] [PubMed] [Google Scholar]
- 44.Lam WW, Poon WS, Metreweli C.. Diffusion MR imaging in glioma: does it have any role in the pre-operation determination of grading of glioma? Clin Radiol. 2002;57:219–25. doi: 10.1053/crad.2001.0741. [DOI] [PubMed] [Google Scholar]
- 45.Ramirez C, Bowman C, Maurage CA, Dubois F, Blond S, Porchet N. et al. Loss of 1p, 19q, and 10q heterozygosity prospectively predicts prognosis of oligodendroglial tumors--towards individualized tumor treatment? Neuro Oncol. 2010;12:490–9. doi: 10.1093/neuonc/nop071. [DOI] [PMC free article] [PubMed] [Google Scholar]