Significance
Transposons are usually functional only in their natural hosts, indicating the involvement of host factors during transposition. In contrast, piggyBac (PB)-based transposon systems are active in cells from yeast to human. We found that the evolutionarily conserved DNA–PK complex binds to the transposase of PB. DNA–PK promotes the formation of the transposition intermediate paired-end complex (PEC) and facilitates PB transposition. PB vectors with closer transposon ends help PEC formation and significantly promote PB transposition even in cells without functional DNA–PK. These results not only suggest a mechanistic explanation of the broad host spectrum of PB but also provide a simple practical approach to designing efficient transposon vectors.
Keywords: piggyBac, DNA–PK, paired-end complex formation, transposition efficiency, CE transposon vectors
Abstract
The involvement of host factors is critical to our understanding of underlying mechanisms of transposition and the applications of transposon-based technologies. Modified piggyBac (PB) is one of the most potent transposon systems in mammals. However, varying transposition efficiencies of PB among different cell lines have restricted its application. We discovered that the DNA–PK complex facilitates PB transposition by binding to PB transposase (PBase) and promoting paired-end complex formation. Mass spectrometry analysis and coimmunoprecipitation revealed physical interaction between PBase and the DNA–PK components Ku70, Ku80, and DNA-PKcs. Overexpression or knockdown of DNA–PK components enhances or suppresses PB transposition in tissue culture cells, respectively. Furthermore, germ-line transposition efficiency of PB is significantly reduced in Ku80 heterozygous mutant mice, confirming the role of DNA–PK in facilitating PB transposition in vivo. Fused dimer PBase can efficiently promote transposition. FRET experiments with tagged dimer PBase molecules indicated that DNA–PK promotes the paired-end complex formation of the PB transposon. These data provide a mechanistic explanation for the role of DNA–PK in facilitating PB transposition and suggest a transposition-promoting manipulation by enhancing the interaction of the PB ends. Consistent with this, deletions shortening the distance between the two PB ends, such as PB vectors with closer ends (PB-CE vectors), have a profound effect on transposition efficiency. Taken together, our study indicates that in addition to regulating DNA repair fidelity during transposition, DNA–PK also affects transposition efficiency by promoting paired-end complex formation. The approach of CE vectors provides a simple practical solution for designing efficient transposon vectors.
Transposition allows DNA transposons to serve as powerful genetic manipulation tools. During transposition, DNA transposons follow a “cut-and-paste” manner. A paired-end complex (PEC) is first formed by aligning both ends of the transposon, which is then excised and inserted into new loci (1, 2). Although the transposon-encoded transposase is suggested to be sufficient for PEC formation, it is unlikely to be the only protein involved in transposition. In fact, many DNA transposons are nonfunctional outside their natural hosts, suggesting the effects of host factors (3).
piggyBac (PB) is a DNA transposon originally identified from the cabbage looper moth (4). Modified PB is highly active in mouse and human cells (5). Because of its potent transposition efficiency and ability to carry large insertions, PB provides unique opportunities for mutagenesis and transgenesis in mammalian systems (6–10). Although the PB transposon has a wide host range, including mammals, its transposition efficiency varies in cultured cells from different mammalian species (7, 9). Thus, host factors may still be involved in the process and influence the efficiency of PB transposition. Understanding the role of host factors is critical to expanding not only our knowledge of the transposition mechanism of PB but also the application of transposon-based technologies.
Results
PB Transposase Binds to Components of the DNA–PK Complex.
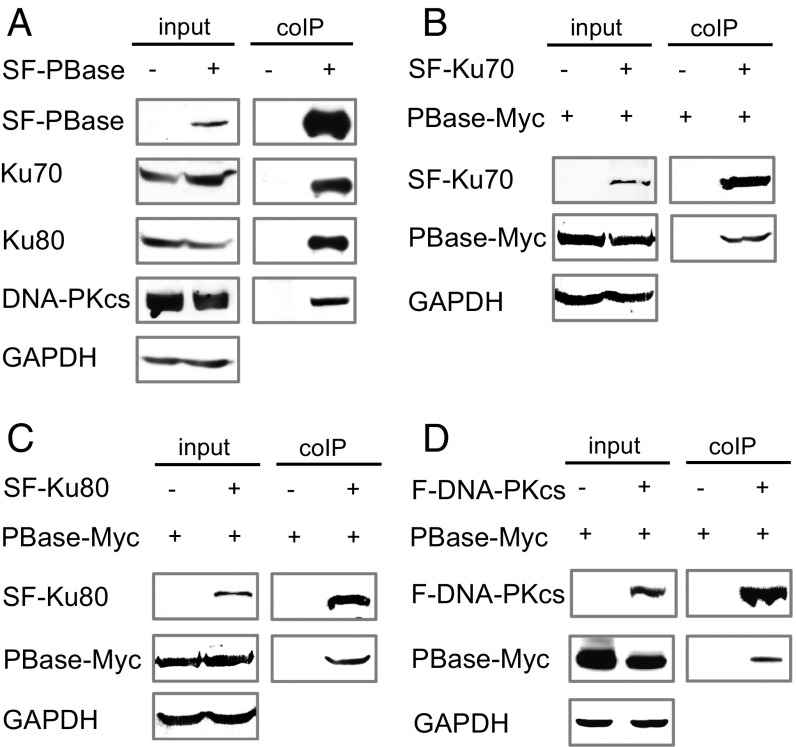
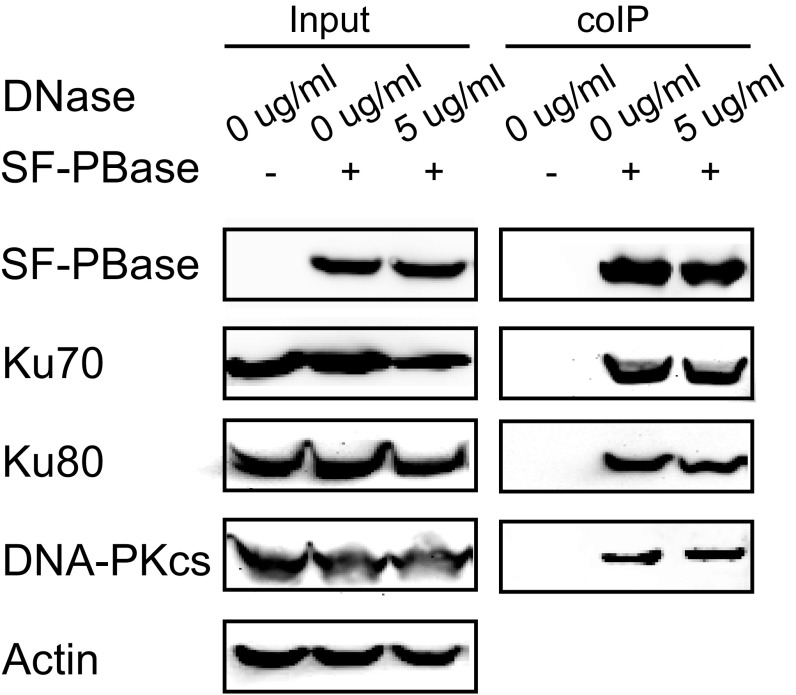
To investigate the potential involvement of host factors in PB transposase (PBase)-mediated transposition, we used PBase as bait to identify its binding partners. PBase tagged with streptavidin-binding peptide (SBP) and Flag peptide on its N terminus (SF-PBase) was expressed in HEK293T cells. After sequential purification by Streptavidin Sepharose and anti-Flag M2 affinity resin, PBase with its binding proteins was digested by trypsin followed by tandem liquid chromatography and mass spectrometry (LC-MS/MS) analysis (11, 12). Nonspecific binding proteins were subtracted by control experiments with empty vector. Among the binding proteins identified through LC-MS/MS, Ku70 was ranked at the top and two other components of the DNA–PK complex, Ku80 and DNA-PKcs, were also among the top 10 identified proteins (Table S1). We thus focused our efforts on the DNA–PK complex for further analysis. To confirm the physical interaction between PBase and DNA–PK complex components, coimmunoprecipitation experiments were performed followed by Western blot analysis. As expected, intrinsic Ku70, Ku80, and DNA-PKcs all coprecipitated with SF-PBase in a DNA-independent manner (Fig. 1A and Fig. S1A). Furthermore, PBase coprecipitated with tagged components of the DNA–PK complex [Fig. 1 B–D; SBP- and Flag-tagged Ku70 (SF-Ku70) and Ku80 (SF-Ku80), and Flag-tagged DNA-PKcs (F-DNA-PKcs)]. These data confirm the physical interaction between PBase and the DNA–PK complex, and suggest that DNA–PK could be involved in PBase-mediated PB transposition.
Table S1.
PBase-interacting peptides of DNA–PK components identified by LC-MS/MS
| Protein name | Peptides |
| KU70 | |
| R.SDSFENPVLQQHFR.N | |
| R.LGSLVDEFK.E | |
| R.TFNTSTGGLLLPSDTK.R | |
| R.ILELDQFK.G | |
| K.NIYVLQELDNPGAK.R | |
| R.DSLIFLVDASK.A | |
| R.NIPPYFVALVPQEEELDDQK.I | |
| R.FDDPGLMLMGFK.P | |
| R.DLLAVVFYGTEK.D | |
| R.DTGIFLDLMHLK.K | |
| R.NLEALALDLMEPEQAVDLTLPK.V | |
| KU80 | |
| R.HIEIFTDLSSR.F | |
| K.TDTLEDLFPTTK.I | |
| K.SQLDIIIHSLK.K | |
| R.HLMLPDFDLLEDIESK.I | |
| R.HLMLPDFDLLEDIESK.I | |
| K.IQPGSQQADFLDALIVSMDVIQHETIGK.K | |
| K.ASFEEASNQLINHIEQFLDTNETPYFMK.S | |
| R.DDEAAAVALSSLIHALDDLDMVAIVR.Y | |
| DNA-PKcs | |
| R.NCISTVVHQGLIR.I | |
| K.DLLLNTMSQEEK.A | |
| R.YNFPVEVEVPMER.K | |
| R.YNFPVEVEVPMER.K | |
| R.TVGALQVLGTEAQSSLLK.A | |
| K.LLLQGEADQSLLTFIDK.A | |
| K.LLLQGEADQSLLTFIDK.A |
Fig. 1.
PBase binds to the components of the DNA–PK complex. (A) Ku70, Ku80, and DNA-PKcs coimmunoprecipitated with PBase. (B) PBase coimmunoprecipitated with Ku70. (C) PBase coimmunoprecipitated with Ku80. (D) PBase coimmunoprecipitated with DNA-PKcs. All experiments were done with HEK293T cells. coIP, coimmunoprecipitation.
Fig. S1.
PBase coimmunoprecipitated with DNA–PK components with or without DNase I. Coimmunoprecipitation was done using PBase as bait with or without DNase I in the lysate. No obvious difference can be detected with 5 μg/mL DNase I in the lysate.
DNA–PK Expression Significantly Impacts on the Transposition Efficiency of PB in Mammalian Cells.
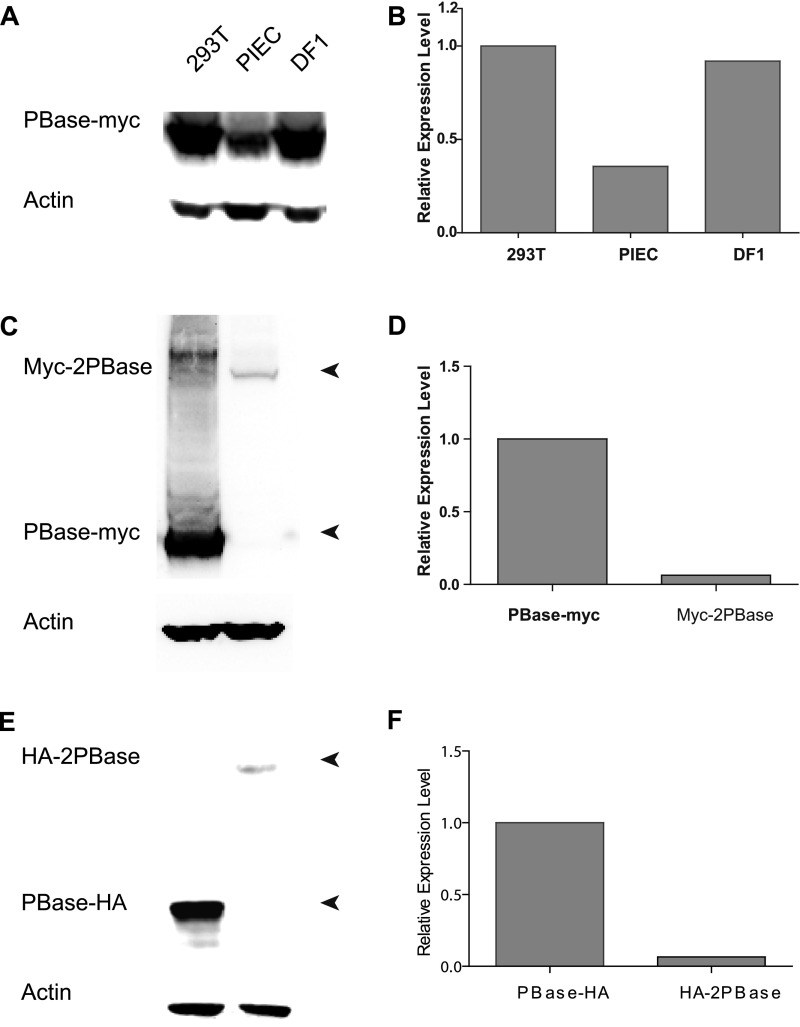
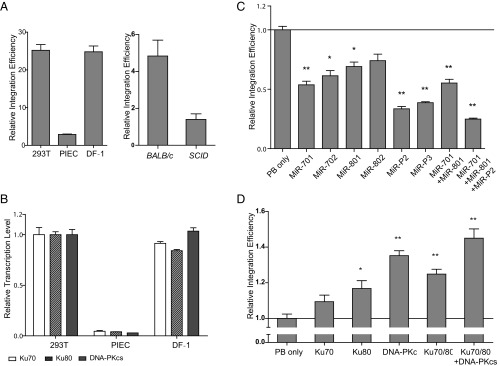
We next examined whether the involvement of DNA–PK contributes to the variation of PB transposition efficiency in different cell lines. To measure transposition efficiency, plasmid-to-chromosome transposition was induced by expressing PBase in cells transfected with PB carrying puromycin resistance (PB[Puro]3K); drug-resistant cells were then counted and compared with those of PBase-negative experiments as described in our previous publication (5). The PBase expression level for each cell line was examined and used to normalize the transposition efficiency (Fig. S2 A and B). We found that PB is much less active in PIEC, a cell line derived from pig kidney epithelium, than in HEK293T and DF-1 (chicken embryo fibroblast cell line) cells (Fig. 2A). Real-time RT-PCR revealed that PIEC expresses components of the DNA–PK complex at levels much lower than HEK293T and DF-1 cells (Fig. 2B and Table S2). We also analyzed PB transposition in mouse embryonic fibroblasts (MEFs). SCID mice are known to have a null mutation of DNA–PKcs, whereas its parental strain, BALB/c, has normal DNA–PK genes (13). With the same strategy used in cell lines, we found that PB transposition efficiency in SCID MEFs was significantly lower than that in BALB/c control (SCID versus BALB/c: 1/3.45; Fig. 2A). The correlation between DNA–PK levels and transposition efficiency implicates DNA–PK as a positive regulator of PB transposition in cultured cells.
Fig. S2.
PBase expression in cultured cells. (A) Western blots of PBase in different cultured cells are shown. (B) PBase relative expression levels in different cultured cells normalized by the expression of Actb are shown. (C) Western blots of PBase (PBase-Myc) and dimer-PBase (Myc-2PBase) are shown. (D) PBase-Myc and Myc-2PBase relative expression levels normalized by the expression of Actb are shown. (E) Western blots of PBase (PBase-HA) and dimer-PBase (HA-2PBase) are shown. (F) PBase-HA and HA-2PBase relative expression levels normalized by the expression of Actb are shown.
Fig. 2.
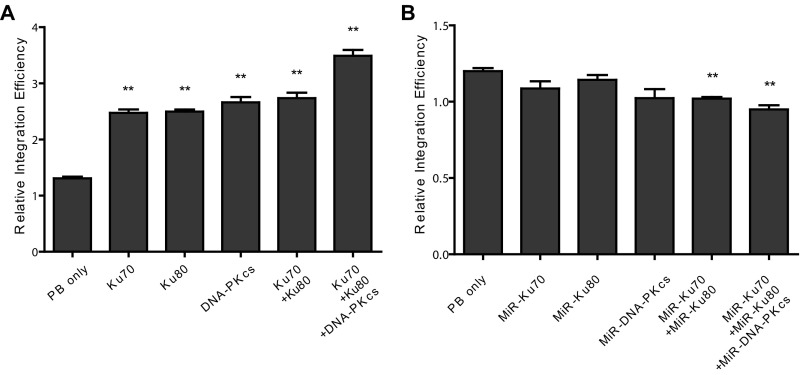
DNA–PK expression significantly affects PB transposition. (A) PB relative transposition efficiency in cultured cells and normalized with PBase expression. (B) Transcription of Ku70, Ku80, and DNA-PKcs in HEK293T, PIEC, and DF-1 cells. Gene expression was detected by real-time RT-PCR and normalized by Actb. (C) Knockdown of Ku70, Ku80, or DNA-PKcs in HEK293T cells suppresses PB transposition. RNAi target antisense sequences are listed in Table S3. *P < 0.01, **P < 0.001. (D) Overexpression of Ku70, Ku80, or DNA-PKcs facilitates PB transposition in HEK293T cells. *P < 0.05, **P < 0.01. Error bars were plotted by the standard error of the mean (SEM).
Table S2.
Primer sequences
| Primer | Sequence, 5′-3′ | |
| Transcription level comparison between human (293T) and pig (PIEC) cell lines | ||
| Ku70 | ||
| 70-QSF | AGTGACAGCTTTGAGAACCC | |
| 70-QSB | GGATTGTAATCTGGTGGGTA | |
| Ku80 | ||
| 80-QSF | TGGCTCCAATTTGTCTATAAGG | |
| 80-QSB | CCATAGCGGAACCCTTGAATA | |
| DNA-PKcs | ||
| PK-QSF | GTTAGCAGGTGCCAATCCAGC | |
| PK-QSB | GTTGGGGTCTGTTGCCTGGTC | |
| Actb | ||
| Act-QSF | AAGGAGAAGCTGTGCTACGTCG | |
| Act-QSB | TGAAGGTAGTTTCGTGGATGCC | |
| Transcription level comparison between human (293T) and chicken (DF-1) cell lines | ||
| Ku70 | ||
| 70-2QF | TAGCAGAGGATGAGGACCT | |
| 70-2QB | CGCTAGGCAGAAGCAAAC | |
| Ku80 | ||
| 80-2QF | TCCAATTTGTCTATAAGGATTG | |
| 80-2QSB | AAAGGAACTATATCACT | |
| DNA-PKcs | ||
| PK-2QF | GAGAATCAGCTGCTGGAGA | |
| PK-2QB | TGACTCATTTCCTCACTCA | |
| Actb | ||
| Act-2QF | GACAGGATGCAGAAGGAGAT | |
| Act-2QB | TACTCCTGCTTGCTGATCCA | |
| Mouse genotyping | ||
| Ku80 | ||
| Wild-type band | ||
| 216-F3 | GCCAGCCTCCCCCTAATACAGATGAGAGAATATG | |
| 216-B10 | TGCCTCCAGCTCTAACGGAAAG | |
| Insertion band | ||
| Bac-RF1 | CCTCGATATACAGACCGATAAAACACATGC | |
| 216-B3 | TCAGTCTCTTTCAGGGTTACATGGTACTTCAGGGC | |
| 222 site | ||
| Wild-type band | ||
| 222-L2A | GCCCTTGTTAAATACAGACAGATTC | |
| 222-R2A | GCACATAAACACGAGTATATCAGTG | |
| Insertion band | ||
| 222-L2A | GCCCTTGTTAAATACAGACAGATTC | |
| Bac-RF1 | CCTCGATATACAGACCGATAAAACACATGC | |
| A6 site | ||
| Wild-type band | ||
| A6-F2 | ACTGGTTACTTCATATTGATGTTCCTCCAC | |
| A6-B2 | CCCTCGATCTCTTTTTGTTGTCTTATTGTTCTAGC | |
| Insertion band | ||
| A6-F2 | ACTGGTTACTTCATATTGATGTTCCTCCAC | |
| LB2 | CTGAGATGTCCTAAATGCACAGCG | |
| Testing DNA-PKcs RNAi vectors of HEK293T cells | ||
| DNA-PKcs | ||
| PK-E73 | ACGGTATCCAGAGGAGACTTTGAGC | |
| PK-E74 | GCTTTCGCTGCTTATGATGAAGGG | |
| GAPDH | ||
| GAPDH-E7 | TGACAACTTTGGTATCGTGGAAGG | |
| GAPDH-E8 | GCAGGGATGATGTTCTGGAGAG | |
| Testing mouse germ-line Ku80 transcription levels | ||
| Ku80 | ||
| 216-E6F | CACCTCAAACCCTCCTTTCCTC | |
| 216-E7B | AGACGCACAGTTGTCGTAGACTCTC | |
| GAPDH | ||
| GAPDHQ-L1 | TGTTCCTACCCCCAATGTGTCC | |
| GAPDHQ-R1 | GGAGTTGCTGTTGAAGTCGCAG | |
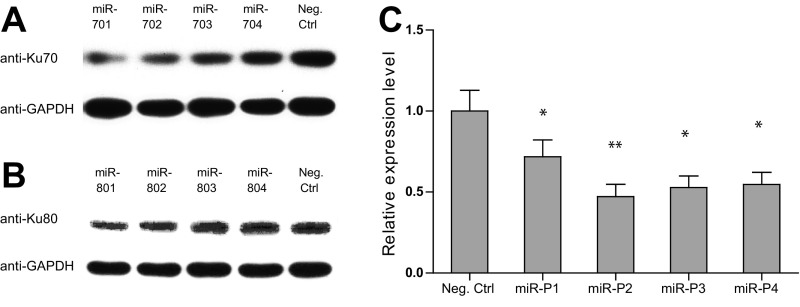
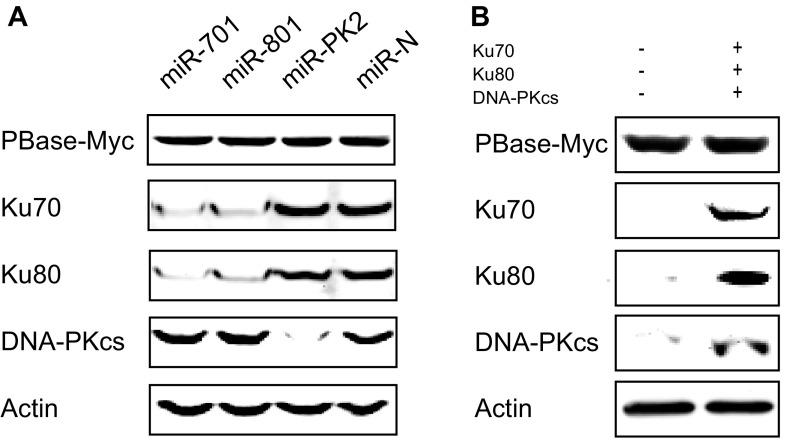
To confirm the effect of DNA–PK on PB transposition, we used RNAi to knock down each component of the complex in HEK293T cells. Four independent RNAi constructs were tested for each gene before the two most effective ones were chosen for PB transposition efficiency experiments (Fig. S3 and Table S3). Indeed, knocking down any component of DNA–PK led to a significant inhibition of PB transposition, and a combination of these RNAi constructs together further inhibited the transposition (Fig. 2C). We further examined the effect of DNA–PK overexpression. Consistent with the knockdown results, overexpression of individual DNA–PK components, especially overexpression of Ku70, Ku80, and DNA–PKcs together, significantly increased PB transposition efficiencies (Fig. 2D). Similar results were also obtained with overexpression and RNAi knockdown experiments in PIEC cells (Fig. S4 and Table S4). These results indicate that the increased transposition efficiency is unlikely because of a different steady state of PBase (Fig. S5). Taken together, these data show that DNA–PK promotes PB transposition in cultured mammalian cells.
Fig. S3.
Evaluation of RNAi constructs of DNA–PK components in HEK293T cells. Western blots of Ku70 and Ku80 are shown in A and B, respectively. Real-time RT-PCR results normalized by the expression of Actb are shown for DNA-PKcs in C. *P < 0.05, **P < 0.01. Error bars were plotted by the standard error of the mean (SEM).
Table S3.
BLOCK-iT Pol II RNAi expression vectors
| Sequence name | Target antisense sequence, 5′-3′ |
| Ku70 | |
| MiR-701 | TTAACCTGCTGAGTGCTCGCT |
| MiR-702 | TATTGGAGGAGGCTTGAGAGC |
| MiR-703 | ATGAGCAGAGCACTGAACAGG |
| MiR-704 | ATGTCAGGTCCACTGCTTGTT |
| Ku80 | |
| MiR-801 | ATCAACAGCATTCAACTGTGC |
| MiR-802 | ATCACATCCATGCTCACGATT |
| MiR-803 | AAGAATTGCAGGGAGATGTCA |
| MiR-804 | TTTAGTGGAAAGGAAGGCCCA |
| DNA-PKcs | |
| MiR-PK1 | TTAGCATGTAAGCTCCAACAT |
| MiR-PK2 | TAAACACGGTCGTCACCAGTG |
| MiR-PK3 | ACAAGTTGACGGCACAAAGCT |
| MiR-PK4 | AGCAGCTTCAGAATAATCACT |
| Negative control | AAATGTACTGCGCGTGGAGAC |
Fig. S4.
DNA–PK expression significantly affects PB transposition in PIEC cells. (A) Overexpression of Ku70, Ku80, or DNA-PKcs facilitates PB transposition in PIEC cells. *P < 0.01, **P < 0.001. (B) Knockdown of Ku70, Ku80, or DNA-PKcs in PIEC cells suppresses PB transposition. RNAi target antisense sequences are listed in Table S4. *P < 0.05, **P < 0.01. Error bars were plotted by the standard error of the mean (SEM).
Table S4.
siRNA sequences used in PIEC RNAi testing of DNA–PK components
| siRNA name | Mixed siRNA sequence, 5′-3′ |
| Ku70 RNAi mixture | |
| si-Ku70-1 | CAGGUAUCUUCCUGGACUUdTdT |
| si-Ku70-2 | GACGUUUAAUGUAAACACAdTdT |
| si-Ku70-3 | GUCAAGAUGAGCCAUAAGAdTdT |
| Ku80 RNAi mixture | |
| si-Ku80-1 | CCUAUGAGUGUUUAGUGUAdTdT |
| si-Ku80-2 | GAUGAAAUAUAUUCCUUUAdTdT |
| si-Ku80-3 | CUAUUCAAGGGUUCCGCUAdTdT |
| DNA-PKcs RNAi mixture | |
| si-PK-1 | GAGGUUACGCAGACGAUUUdTdT |
| si-PK-2 | GAAAGAUGAUGUUCACUCUdTdT |
| si-PK-3 | CUUUGCAUAUGAGAUAAUUdTdT |
| Negative control | UUCUCCGAACGUGUCACGUTT |
Fig. S5.
PBase stability is not influenced by DNA–PK components. (A) Ku70, Ku80, and DNA-PKcs were down-regulated by RNAi constructs miR-701, miR-801, and miR-PK2 (miR-N is a negative control) in 293T cells. PBase expression levels were detected from each line of cells. (B) PBase expression levels were detected in PIEC cells with or without DNA–PK components. Human cDNAs of Ku70, Ku80, and DNA-PKcs were all expressed in PIEC cells.
DNA–PK Affects PB Transposition in the Mouse Germ Line.
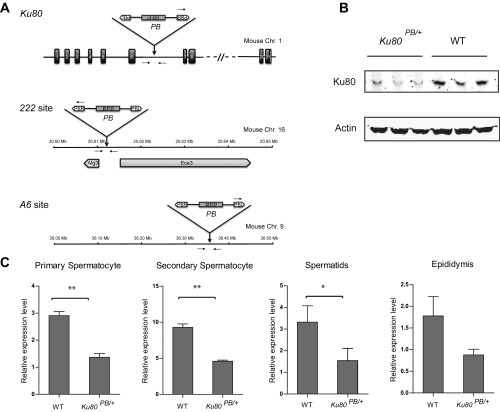
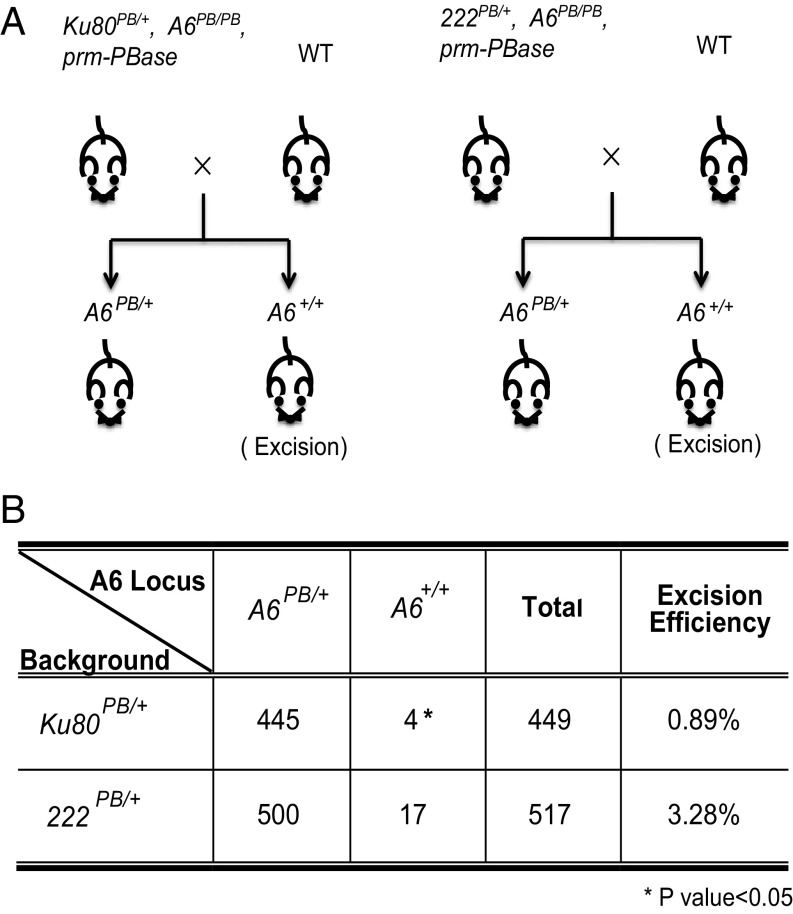
We next examined whether DNA–PK could also significantly affect PB transposition in vivo, especially in germ-line cells. Specifically, we wanted to learn whether DNA–PK plays a role in PB excision, an early step of transposition. To this end, we generated three mouse lines. First, we generated a Ku80 mutation in our mouse PB insertional mutagenesis screen (Ku80PB; Fig. S6A; the screen will be described elsewhere). The level of Ku80 mRNA in the male germ line of heterozygous mutants (Ku80PB/+) is reduced to half that in wild-type mice (Fig. S6C). The expression of Ku80 has also been significantly affected by the mutation (Fig. S6B). Meanwhile, we generated a PB insertion in a noncoding region (222PB) as the wild-type Ku80 control. Third, a commonly used jump starter, the A6 PB insertion, which is located in another noncoding region, was created to serve as the target of excision. These three elements were bred with a PBase transgene expressed in male germ cells (Prm1-PBase), so that A6 PB excision could be followed in the progeny of wild-type females and “Ku80PB/+, A6PB/PB, Prm1-PBase” or “222PB/+, A6PB/PB, Prm1-PBase” males, respectively (Fig. 3A). We used genotyping PCR to identify the genotype of their offspring on the A6 site. We found that PB excision efficiency was significantly lower in the Ku80PB/+ background than that in the 222PB/+ control (0.89 versus 3.28%; Fig. 3B). This result indicates that DNA–PK plays an important role in PB excision in vivo.
Fig. S6.
Mutants used to analyze PB transposition. (A) Schematic diagrams of PB insertions in Ku80, 222, and A6. Primers used in genotyping are indicated by arrows. (B) Ku80 gene expression in Ku80PB/+ male testis. (C) Reduced expression of Ku80 in male germ cells of Ku80PB/+ was revealed by real-time RT-PCR. *P < 0.05, **P < 0.01. Error bars were plotted by the standard error of the mean (SEM).
Fig. 3.
Defective DNA–PK component Ku80 suppresses PB transposition in the mouse germ line. (A) Schematic diagram of the breeding strategy. Homozygous mice with a PB insertion at the A6 locus (A6PB/PB) were crossed with wild type. Offspring of A6+/+ (excision) were examined by three-primer PCR (Fig. S6A). (B) PB excision efficiency at the A6 locus was significantly reduced by heterozygous Ku80 mutations.
DNA–PK Contributes to PEC Formation of PB.
DNA–PK is a DNA-dependent protein kinase complex that plays a key role in nonhomologous end-joining (NHEJ) repair (14–16). It binds to DNA double-strand breaks to form a synapsis and recruits other proteins such as the ligase complex (17–20). As a central event of transposition, PEC formation is also characterized by a synapsis between both ends of the transposon (21, 22), and we thus addressed the question of whether PBase interacting with DNA–PK contributes to PEC formation.
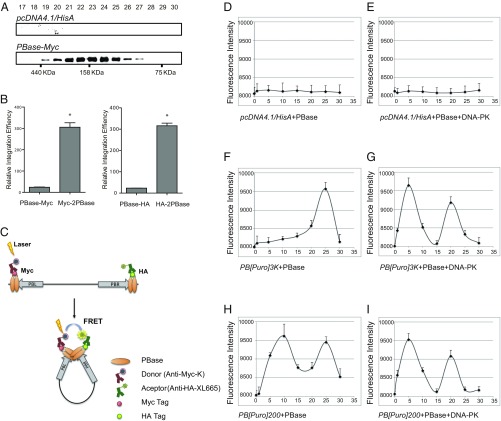
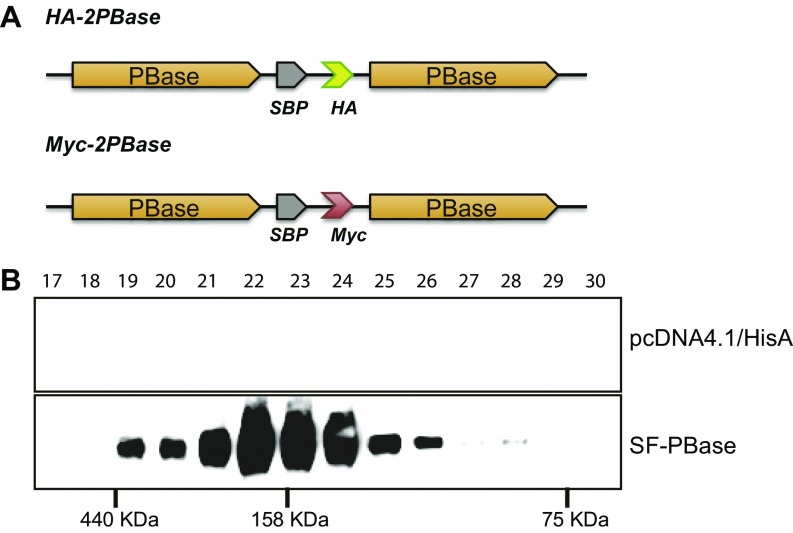
We speculated whether PBase binds to PB ends to form the PEC. Fluorescence resonance energy transfer (FRET) could be observed between PBase molecules bound on different ends (Fig. 4C). Considering that the transposase could exist as a monomer, dimer, or tetramer (22–24), we first analyzed the conformation of PBase expressed in HEK293T cells. Gel-filtration assay of transposon-free lysate or purified PBase proteins revealed that PBase exists predominantly as a dimer (Fig. 4A and Fig. S7B). We thus constructed HA- and Myc-tagged PBase dimers (HA-2PBase and Myc-2PBase, respectively) and showed that they are highly active in mediating PB transposition (Fig. 4B and Fig. S7A). We then used tandem PBase dimers for FRET experiments. In the experiments, HA-2PBase and Myc-2PBase were incubated with circular DNA substrates with or without the purified DNA–PK components. Antibodies labeled with europium (K; see Fig. 4C) cryptate (FRET donor) and XL665 fluorophores (FRET acceptor) were then used to detect potential FRET. In the absence of PB, no FRET could be detected (Fig. 4D). When a PB element (PB[Puro]3K) was provided, the first FRET peak could be detected at around 25 min of incubation (Fig. 4F). When DNA–PK was added, the FRET peak quickly emerged at 5 min (Fig. 4G). As expected, providing DNA–PK did not generate positive FRET signals in a PB-free system (Fig. 4E). This result indicated that DNA–PK could promote PEC formation of PB.
Fig. 4.
DNA–PK contributes to PEC formation of PB. (A) PBase forms dimers in cell lysate. Western blots of gel-filtration fractions are shown. HEK293T lysates were expressed with either PBase-Myc or the empty vector control. Fraction numbers are indicated. (B) The activity of dimer-PBases (Myc-2PBase or HA-2PBase) in 293T cells. Relative integration efficiency was normalized with the expression of PBase or dimer-PBase (Fig. S2). *P < 0.01. (C) Schematic diagram of FRET expected upon PEC formation. (D–I) FRET signals detected upon PEC formation. Time courses of FRET were recorded when PBase was incubated with different PB constructs (Fig. 5A) without (D, F, and H) or with DNA–PK (E, G, and I). The plasmid pcDNA4.1/HisA was used as negative control. Error bars were plotted by the standard error of the mean (SEM).
Fig. S7.
(A) Schematic diagrams of dimer-PBases. (B) Purified PBase from HEK293T forms a dimer. PBase expressed in HEK293T cells or empty vector control was purified by Streptavidin Sepharose. Western blots of gel-filtration fractions are shown. Fraction numbers are indicated.
PB Vectors with Closer Ends Could Increase Transposition Efficiency and Compensate the Effect of Low DNA–PK Expression.
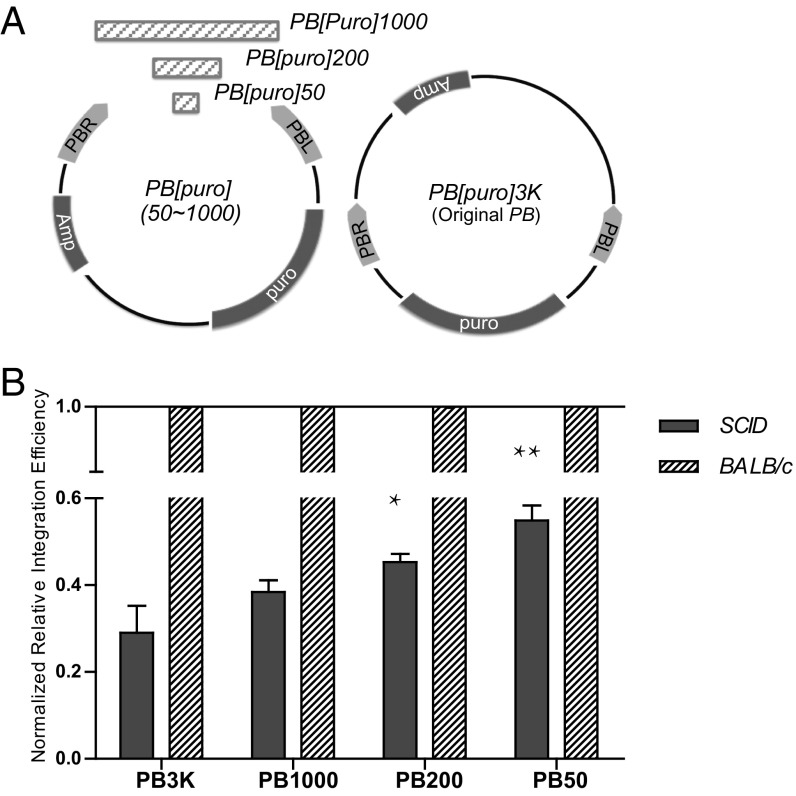
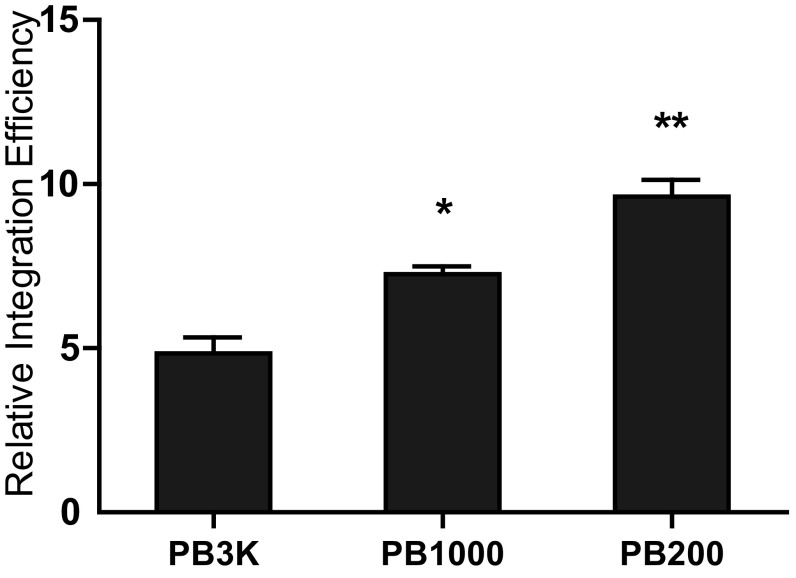
It is known that the size of the transposon (the length of the sequence contained within the transposon inverted ends) as well as the length of DNA sequences outside the transposon ends affect transposition efficiency (25, 26). The fact that DNA–PK promotes both PEC formation and transposition raises the possibility that efficiency of PEC formation enhances PB transposition. If this is the case, PB vectors with closer ends (PB-CE vectors; a shorter length of the sequence outside of the two transposon ends in a plasmid) may increase the efficiency of PEC formation and have higher transposition efficiency. Considering the practicality for PB to carry large cargos, we designed PB-CE vectors with the inverted terminal repeats (ITRs) facing in an outward conformation (Fig. 5A). To test this assumption, we first generated a PB-CE vector with a 200-bp external spacer between both ends (PB[Puro]200; Fig. 5A) to examine its performance in PEC formation. After incubation with PBase, the first FRET peak of PB[Puro]200 emerged at 5 min of incubation, independent of the presence of DNA–PK (Fig. 4 H and I). Compared with PB[Puro]3K that had a 3.2-kb external spacer, PB[Puro]200 allows easier PEC formation.
Fig. 5.
PB vectors with closer ends increase transposition efficiency and compensate the effect of low DNA–PK expression. (A) Schematic diagram of PB-CE vectors. (B) PB-CE diminishes the differences between DNA–PK inactive and active cells. Transposition efficiencies of BALB/c MEF cells were normalized to 100%. *P < 0.05, **P < 0.01.
Higher PEC formation efficiency of PB[Puro]200 encouraged us to further explore the effect of PB end distance on transposition. In addition to PB[Puro]3K and PB[Puro]200, we used PB[Puro]1K and PB[Puro]50, PB-CE vectors with a 1-kb and 50-bp external spacer, respectively (Fig. 5A). Transposition efficiencies of these vectors were scored in SCID MEF cells by a plasmid-to-chromosome transposition assay, and compared with those in BALB/c MEF cells. In general, shorter external spacers significantly increased transposition efficiency and diminished the differences between DNA–PK inactive and active cells (Fig. 5B). Therefore, a shorter distance between PB ends in the vector could compensate the effect of low DNA–PK expression. Shorter external spacers also increased transposition efficiency in BALB/c MEF cells, which are wild-type for DNA–PK (Fig. S8), indicating that a lesser distance between PB ends could in general increase transposition efficiency. These data are consistent with previous findings in different transposon systems (25, 26) and support the importance of PEC formation.
Fig. S8.
Relative transposition efficiency of PB in BALB/c MEF cells. PB-CE vectors increase transposition efficiency in BALB/c MEF cells. *P < 0.05, **P < 0.01.
Discussion
We have discovered that the DNA–PK complex facilitates PB transposition by binding to the PB transposase and promoting paired-end complex formation. Mass spectrometry analysis and coimmunoprecipitation revealed physical interaction between PBase and the DNA–PK components Ku70, Ku80, and DNA-PKcs. Overexpression or knockdown of DNA–PK components enhances or suppresses PB transposition in tissue culture cells, respectively. Furthermore, germ-line transposition efficiency of PB is significantly reduced in Ku80 heterozygous mutant mice, confirming the role of DNA–PK in facilitating PB transposition in vivo. Previous studies for Sleeping Beauty and P element also showed that the DNA–PK complex could increase transposition efficiency (27–29). The DNA–PK complex is known for its function in regulating double-strand breaks through the NHEJ pathway. It is thought that this DNA repair function of DNA–PK contributes to transposition. Here our data argue that DNA–PK promotes PEC formation and therefore helps PB transposition.
DNA–PK’s role in PEC formation was detected by FRET assay. Protein extracts from cells show that PBase exists as a dimer. Therefore, tagging a monomer PBase would not allow detection of FRET between PB ends. We thus made dimer PBase (dimer-PBase). If a monomer PBase binds to each PB terminus and brings the two termini together by PEC formation, then the dimer-PBase would no longer work in promoting transposition. Furthermore, if there is more than one set of PBase dimers at each PB terminus, we would also not see any significant FRET shift. This is because most of the PB transposon DNA would have mixed tagged dimer-PBase molecules bound at their ends and only a minority of the PB molecules would have two Myc-tagged dimer-PBases at one end and two HA-tagged dimer-PBases at the other end. The fact that we detected a significant FRET shift when differently tagged dimer-PBases were incubated with the PB transposon DNA suggests that PBase dimers are functional units. This is consistent with our observation that the PBase protein extracts from cells exist as dimers. To functionally verify this, we now used the tagged dimer-PBase in transposition experiments and found that not only are they active in mediating transposition but do so much more effectively than monomer PBase (Fig. 4B). Together, these data suggest that PBase functions as a dimer unit. Our FRET results indicate that DNA–PK could facilitate PEC formation during PB transposition, providing an explanation for its effect on transposition efficiency. Given that DNA–PK also interacts with transposases from other transposons, including Sleeping Beauty and P element, and is evolutionarily conserved (Dataset S1), it may promote transposition of other transposons in a similar fashion.
The DNA–PK complex is involved in V(D)J recombination. HMGB1 has been reported to help RAG and DNA form loops (30). Our results have raised the possibility that DNA–PK could also promote PEC formation during V(D)J recombination.
The involvement of host factors is critical to our understanding of underlying mechanisms of transposition and the applications of transposon-based technologies. Our data from cultured mammalian cells and in mice indicate that the DNA–PK complex can bind to PBase and promote PB transposition. Furthermore, our data indicate that DNA–PK could facilitate PEC formation during PB transposition, providing an explanation for its effect on transposition efficiency. We also found that dimerization of PBase provides us a highly active transposase protein, which may owe to its stability. The discovery that the PB closer end vectors could significantly increase transposition efficiency in both DNA–PK deficient (SCID) and normal cells (BALB/c) supports the importance of PEC formation. Consistent with previous discoveries in different vector systems (25, 26), these data indicate that shorter external spacers increase transposition efficiency and provide a simple practical principle for the design of transposon vectors (31). Given that the DNA–PK complex is also involved in the transposition of other DNA transposons (27–29), the approach using closer end vectors could be applied to other mobile elements for designing efficient vector systems.
Materials and Methods
Mice.
All animal procedures were approved by the Animal Care and Use Committee of the Institute of Developmental Biology and Molecular Medicine. Details of the piggyBac insertions in Ku80, 222, and A6 have been published in the PBmice database (idm.fudan.edu.cn/PBmice/), with line names P13qR12/13, 090115222-HRA, and 080429013-HRA, respectively.
Genotyping.
The identification of PB insertion mice was performed with three-primer genotyping PCR (two of which flanked the PB transposon on the genome and the third on one side of a PB end). Primers for each insertion site are listed in Table S2.
Plasmids.
The expression vector of human DNA-PKcs (pCMV-F2-K) was a generous gift from David J. Chen (University of Texas). All other expression vectors were constructed with the pcDNA4.1/HisA backbone. In SF-Ku70, SF-Ku80, and SF-PBase, the SBP and Flag sequences were added upstream of each cDNA. For PBase-Myc, the Myc tag was added downstream of PBase. For HA-2PBase and Myc-2PBase, an SBP and an HA/Myc tag were cloned between two PBase cDNAs.
PB[puro]3K was generated by replacing the neomycin resistance cassette in PB[SV40-neo] with a puromycin resistance marker from pMSCVpuro (Clontech) (5). It has a 3.5-kb PB element and a 3.2-kb external spacer. PB-CE vectors were generated by inserting a pair of PB ends (PBL and PBR), a puromycin resistance marker from pMSCVpuro, and a spacer of given length between the NotI and ClaI sites of pBluescript II KS. They all have a 6.3-kb PB element. RNAi experiments were carried out with BLOCK-iT Pol II miR RNAi expression vectors (Invitrogen). Composite sequences of all of the constructs are available upon request.
Protein Purification.
Cells were lysed in 0.5% Nonidet P-40 Tris buffer (50 mM Tris, 150 mM NaCl, pH 7.5) with protease inhibitor (Roche) and PMSF (Sigma) freshly added following the manufacturer’s guide. Immunoprecipitation was carried out by sequentially incubating Anti-Flag M2 Affinity Gel (Sigma) and Streptavidin Sepharose (GE Healthcare) with cell lysate for 3 to 4 h at 4 °C. Precipitated proteins were washed with Tris buffer three times and we competitively eluted Anti-Flag M2 Affinity Gel by 3×Flag peptides (Sigma) and Streptavidin Sepharose by biotin (Sigma), respectively.
LC-MS/MS.
Streptavidin Sepharose bound with SF-PBase was washed with 0.5% Nonidet P-40 Tris buffer three times, followed by three washes with 50 mM NH4HCO3. The precipitated proteins were digested by trypsin (Sigma). Supernatant was collected, dried, and dissolved in 10% acetonitrile and 0.8% formic acid. The peptides were then analyzed by LC-MS/MS.
Western Blot.
Western blots of SDS/PAGE were performed by enhanced chemiluminescence detection (Pierce). SF-PBase, SF-Ku70, SF-Ku80, and F-DNA-PKcs were detected by an anti-Flag antibody (Sigma; F7425), PBase-Myc and PBase-HA were detected by the antibody of anti-Myc (Santa Cruz; J2306) and anti-HA (Covance; MMS-101P). Ku70 was detected by an anti-Ku70 antibody (Thermo Fisher Scientific; MS329), Ku80 was detected by an anti-Ku80 antibody (Thermo Fisher Scientific; MS285), DNA-PKcs was detected by an anti–DNA-PKcs antibody (Thermo Fisher Scientific; MS423), and GAPDH was detected by an anti-GAPDH antibody (KangChen Bio-tech; KC5G4). Intensities of Western blot bands were measured by ImageJ (NIH) as NIH tutorial (Gels) suggested (https://imagej.nih.gov/ij/docs/menus/analyze.html#gels) with default settings.
Real-Time RT-PCR.
Total RNA from separated male germ cells or cell cultures was purified with TRIzol (Invitrogen) and reverse-transcribed with RNA PCR Kit (AMV) 3.0 from TaKaRa. Real-time PCR was carried out with the Mx3000P thermocycler (Stratagene) with Brilliant II SYBR Green (Stratagene).
For comparison of DNA–PK gene expression levels, we designed the primer pairs in the 100% identical region among species. Primer sequences are listed in Table S2.
Cell Culture.
All medium was supplemented with 10% FBS (HyClone) and 100 unit/mL penicillin and streptomycin (Invitrogen). HEK293T and DF-1 cells were cultured in DMEM (Invitrogen). PIEC cells were cultured in 1640 medium (Invitrogen). After transfections with Lipofectamine 2000 (Invitrogen), cells were cultured for 48 h before Western analysis. SCID and BALB/c MEF cells were derived from 14.5 days postcoitum (dpc) embryos and cultured in DMEM. Transfections were performed by electroporation (300 V, 960 µF) in a Bio-Rad Gene Pulser II.
Forty-eight hours after transfection, medium containing 1.5 µg/mL puromycin (Sigma) was used for 2 wk to select PB-positive cells. Surviving HEK293T or PIEC cells were scored by the number of colonies after 0.2% methylene blue staining, whereas surviving MEF cells were counted by FACS.
For testing PB transposition efficiencies, PB circular plasmids (transposon donor) were cotransfected with PBase expression vectors driven by the actin promoter or pcDNA4.1/HisA empty vector as negative control. Fold increase of surviving cells in the presence of PBase (relative integration efficiency) was used to score transposition efficiency. The number of drug-resistant clones with PBase was normalized by its negative control without PBase, which contributed to random integration. PBase expression levels were also used to normalize the final relative integration to diminish the differing expression of PBase in different cell lines. In MEF cells, surviving cell numbers instead of surviving clones were calculated because of the difficulty for MEF cells of forming clones.
Gel Filtration.
Cell lysates or purified proteins were separated by Superdex 200 10/30 GL (GE Healthcare) into fractions of 500 µL. PBase was detected by Western blot. Molecular weight was marked by a Gel Filtration HMW Calibration Kit (GE Healthcare).
FRET Assay.
Streptavidin Sepharose (GE Healthcare)-purified HA-2PBase and Myc-2PBase from HEK293T cell lysates were mixed with PB DNA in 1× NEBuffer 4 and incubated at 37 °C. Formaldehyde was added at each time point to a final concentration of 1% before immediately freezing at −80 °C. Micro Bio-Spin chromatography columns (P-6; Bio-Rad) were then used to remove the formaldehyde. Finally, FRET analysis was performed with the HTRF anti-tag reagents toolbox (Cisbio) according to the manufacturer’s instructions.
Statistical Analysis.
Comparisons of PB excision efficiency at the A6 locus were performed with the χ2 test. Other comparisons between groups were made by an unpaired two-tailed Student’s t test. P values were calculated based on comparison with controls.
SI Materials and Methods
Coimmunoprecipitation with DNase.
DNase I (Worthington; B002004) was added to the cell lysate at a concentration of 5 μg/mL. CoIP was then performed as described in Materials and Methods.
Examination of PBase Expression Level.
For testing PBase expression levels in different cultured cells, PBase was tagged with the Myc epitope on its C terminus (PBase-Myc). An equal amount of PBase-Myc expression vector was transfected into each line of cells with Lipofectamine 2000 (Invitrogen). Western blot analysis was performed 48 h later. PBase-Myc was detected by anti-Myc (Santa Cruz; J2306). Actin was detected by anti-Actb (Sigma; A3854). Intensities of Western blot bands were measured by ImageJ.
Knockdown of the Components of DNA–PK.
For knockdown of the components of DNA–PK in HEK293T cells, four expression vectors of each gene were designed by Invitrogen using their BLOCK-iT Pol II miR RNAi Expression Vector Kit. Sequences are listed in Table S3.
For knockdown of the components of DNA–PK in PIEC cells, a mixture of siRNAs was designed by Sigma. siRNA sequences are listed in Table S4.
Overexpression of DNA–PK Components in PIEC Cells.
Human cDNA expression vectors of DNA–PK components as used in HEK293T cells were used to promote the transposition efficiency of PB in PIEC cells.
Protein Extraction of Mouse Testis.
Testis protein of 8-wk-old mice was extracted by RIPA with freshly added 1 mM PMSF and proteinase inhibitor (Roche). Mouse Ku80 protein was detected by Western blot (Chemicon; AB3744).
Separation of Mouse Spermatogenic Cells.
Testis from 8-wk-old mice was treated with collagenase IV (1 mg/mL) in DMEM for 20 min at 37 °C and then with 25% trypsin for 2 min at 37 °C. After two PBS washes, cells were separated by Percoll density gradients as described (29).
Conserved Sequence Alignment.
DNA-PKcs conserved amino acid sequence alignment was conducted by the Clustal Omega program of Ensembl (www.ebi.ac.uk/Tools/msa/clustalo/).
Supplementary Material
Acknowledgments
We thank Min Han and Yue Xiong for stimulating discussions; David J. Chen (UT Southwestern Medical Center) for the DNA-PKcs construct; Sheng Ding, Gang Li, and Yanling Yang for generating PB mutants; and Xiaoping Huang and Jing Yan for technical assistance. This study was supported in part by the National Basic Research Program of China (973) Grant 2013CB945301, Chinese Hi-tech Research and Development Project (863) Grant 2014AA021104, National Natural Science Foundation of China Grant 81570756, and Shanghai Municipal Science and Technology Commission Grant 15XD1500500. T.X. is a Howard Hughes Medical Institute Investigator.
Footnotes
The authors declare no conflict of interest.
This article is a PNAS Direct Submission. H.H.K. is a guest editor invited by the Editorial Board.
This article contains supporting information online at www.pnas.org/lookup/suppl/doi:10.1073/pnas.1612980114/-/DCSupplemental.
References
- 1.Richardson JM, Colloms SD, Finnegan DJ, Walkinshaw MD. Molecular architecture of the Mos1 paired-end complex: The structural basis of DNA transposition in a eukaryote. Cell. 2009;138:1096–1108. doi: 10.1016/j.cell.2009.07.012. [DOI] [PMC free article] [PubMed] [Google Scholar]
- 2.Sakai J, Chalmers RM, Kleckner N. Identification and characterization of a pre-cleavage synaptic complex that is an early intermediate in Tn10 transposition. EMBO J. 1995;14:4374–4383. doi: 10.1002/j.1460-2075.1995.tb00112.x. [DOI] [PMC free article] [PubMed] [Google Scholar]
- 3.Handler AM, Gomez SP, O’Brochta DA. A functional analysis of the P-element gene-transfer vector in insects. Arch Insect Biochem Physiol. 1993;22:373–384. doi: 10.1002/arch.940220306. [DOI] [PubMed] [Google Scholar]
- 4.Cary LC, et al. Transposon mutagenesis of baculoviruses: Analysis of Trichoplusia ni transposon IFP2 insertions within the FP-locus of nuclear polyhedrosis viruses. Virology. 1989;172:156–169. doi: 10.1016/0042-6822(89)90117-7. [DOI] [PubMed] [Google Scholar]
- 5.Ding S, et al. Efficient transposition of the piggyBac (PB) transposon in mammalian cells and mice. Cell. 2005;122:473–483. doi: 10.1016/j.cell.2005.07.013. [DOI] [PubMed] [Google Scholar]
- 6.Feschotte C. The piggyBac transposon holds promise for human gene therapy. Proc Natl Acad Sci USA. 2006;103:14981–14982. doi: 10.1073/pnas.0607282103. [DOI] [PMC free article] [PubMed] [Google Scholar]
- 7.Wu SC, et al. piggyBac is a flexible and highly active transposon as compared to Sleeping Beauty, Tol2, and Mos1 in mammalian cells. Proc Natl Acad Sci USA. 2006;103:15008–15013. doi: 10.1073/pnas.0606979103. [DOI] [PMC free article] [PubMed] [Google Scholar]
- 8.Jang CW, Behringer RR. Transposon-mediated transgenesis in rats. CSH Protoc. 2007;2007:pdb.prot4866. doi: 10.1101/pdb.prot4866. [DOI] [PubMed] [Google Scholar]
- 9.Wilson MH, Coates CJ, George AL., Jr PiggyBac transposon-mediated gene transfer in human cells. Mol Ther. 2007;15:139–145. doi: 10.1038/sj.mt.6300028. [DOI] [PubMed] [Google Scholar]
- 10.Wang W, et al. Chromosomal transposition of PiggyBac in mouse embryonic stem cells. Proc Natl Acad Sci USA. 2008;105:9290–9295. doi: 10.1073/pnas.0801017105. [DOI] [PMC free article] [PubMed] [Google Scholar]
- 11.Zhou X, et al. Targeted polyubiquitylation of RASSF1C by the Mule and SCFβ-TrCP ligases in response to DNA damage. Biochem J. 2012;441:227–236. doi: 10.1042/BJ20111500. [DOI] [PMC free article] [PubMed] [Google Scholar]
- 12.Zhao S, et al. Glioma-derived mutations in IDH1 dominantly inhibit IDH1 catalytic activity and induce HIF-1alpha. Science. 2009;324:261–265. doi: 10.1126/science.1170944. [DOI] [PMC free article] [PubMed] [Google Scholar]
- 13.Bosma GC, Custer RP, Bosma MJ. A severe combined immunodeficiency mutation in the mouse. Nature. 1983;301:527–530. doi: 10.1038/301527a0. [DOI] [PubMed] [Google Scholar]
- 14.Deriano L, Roth DB. Modernizing the nonhomologous end-joining repertoire: Alternative and classical NHEJ share the stage. Annu Rev Genet. 2013;47:433–455. doi: 10.1146/annurev-genet-110711-155540. [DOI] [PubMed] [Google Scholar]
- 15.Lieber MR, Ma Y, Pannicke U, Schwarz K. The mechanism of vertebrate nonhomologous DNA end joining and its role in V(D)J recombination. DNA Repair (Amst) 2004;3:817–826. doi: 10.1016/j.dnarep.2004.03.015. [DOI] [PubMed] [Google Scholar]
- 16.Rassool FV. DNA double strand breaks (DSB) and non-homologous end joining (NHEJ) pathways in human leukemia. Cancer Lett. 2003;193:1–9. doi: 10.1016/s0304-3835(02)00692-4. [DOI] [PubMed] [Google Scholar]
- 17.DeFazio LG, Stansel RM, Griffith JD, Chu G. Synapsis of DNA ends by DNA-dependent protein kinase. EMBO J. 2002;21:3192–3200. doi: 10.1093/emboj/cdf299. [DOI] [PMC free article] [PubMed] [Google Scholar]
- 18.Weterings E, Verkaik NS, Brüggenwirth HT, Hoeijmakers JH, van Gent DC. The role of DNA dependent protein kinase in synapsis of DNA ends. Nucleic Acids Res. 2003;31:7238–7246. doi: 10.1093/nar/gkg889. [DOI] [PMC free article] [PubMed] [Google Scholar]
- 19.Yaneva M, Kowalewski T, Lieber MR. Interaction of DNA-dependent protein kinase with DNA and with Ku: Biochemical and atomic-force microscopy studies. EMBO J. 1997;16:5098–5112. doi: 10.1093/emboj/16.16.5098. [DOI] [PMC free article] [PubMed] [Google Scholar]
- 20.Chen L, Trujillo K, Sung P, Tomkinson AE. Interactions of the DNA ligase IV-XRCC4 complex with DNA ends and the DNA-dependent protein kinase. J Biol Chem. 2000;275:26196–26205. doi: 10.1074/jbc.M000491200. [DOI] [PubMed] [Google Scholar]
- 21.Olorunniji FJ, He J, Wenwieser SV, Boocock MR, Stark WM. Synapsis and catalysis by activated Tn3 resolvase mutants. Nucleic Acids Res. 2008;36:7181–7191. doi: 10.1093/nar/gkn885. [DOI] [PMC free article] [PubMed] [Google Scholar]
- 22.Tang M, Cecconi C, Bustamante C, Rio DC. Analysis of P element transposase protein-DNA interactions during the early stages of transposition. J Biol Chem. 2007;282:29002–29012. doi: 10.1074/jbc.M704106200. [DOI] [PubMed] [Google Scholar]
- 23.van Pouderoyen G, Ketting RF, Perrakis A, Plasterk RH, Sixma TK. Crystal structure of the specific DNA-binding domain of Tc3 transposase of C.elegans in complex with transposon DNA. EMBO J. 1997;16:6044–6054. doi: 10.1093/emboj/16.19.6044. [DOI] [PMC free article] [PubMed] [Google Scholar]
- 24.Davies DR, Goryshin IY, Reznikoff WS, Rayment I. Three-dimensional structure of the Tn5 synaptic complex transposition intermediate. Science. 2000;289:77–85. doi: 10.1126/science.289.5476.77. [DOI] [PubMed] [Google Scholar]
- 25.Izsvák Z, Ivics Z, Plasterk RH. Sleeping Beauty, a wide host-range transposon vector for genetic transformation in vertebrates. J Mol Biol. 2000;302:93–102. doi: 10.1006/jmbi.2000.4047. [DOI] [PubMed] [Google Scholar]
- 26.Rostovskaya M, et al. Transposon-mediated BAC transgenesis in human ES cells. Nucleic Acids Res. 2012;40:e150. doi: 10.1093/nar/gks643. [DOI] [PMC free article] [PubMed] [Google Scholar]
- 27.Yant SR, Kay MA. Nonhomologous-end-joining factors regulate DNA repair fidelity during Sleeping Beauty element transposition in mammalian cells. Mol Cell Biol. 2003;23:8505–8518. doi: 10.1128/MCB.23.23.8505-8518.2003. [DOI] [PMC free article] [PubMed] [Google Scholar]
- 28.Weinert BT, Min B, Rio DC. P element excision and repair by non-homologous end joining occurs in both G1 and G2 of the cell cycle. DNA Repair (Amst) 2005;4:171–181. doi: 10.1016/j.dnarep.2004.09.004. [DOI] [PubMed] [Google Scholar]
- 29.Izsvák Z, et al. Healing the wounds inflicted by Sleeping Beauty transposition by double-strand break repair in mammalian somatic cells. Mol Cell. 2004;13:279–290. doi: 10.1016/s1097-2765(03)00524-0. [DOI] [PubMed] [Google Scholar]
- 30.Ru H, et al. Molecular mechanism of V(D)J recombination from synaptic RAG1-RAG2 complex structures. Cell. 2015;163:1138–1152. doi: 10.1016/j.cell.2015.10.055. [DOI] [PMC free article] [PubMed] [Google Scholar]
- 31.Monjezi R, et al. Enhanced CAR T-cell engineering using non-viral Sleeping Beauty transposition from minicircle vectors. Leukemia. 2017;31:186–194. doi: 10.1038/leu.2016.180. [DOI] [PubMed] [Google Scholar]
Associated Data
This section collects any data citations, data availability statements, or supplementary materials included in this article.


