Significance
Here we show that GLAST, a major glutamate transporter in the cerebellar cortex, is essential for synaptic wrapping by Bergmann glia and synaptic wiring on Purkinje cells (PCs) by parallel fibers (PFs) and climbing fibers (CFs). Without GLAST, monoinnervation of PCs by single strong CFs and segregation of CF and PF territories along PC dendrites cannot develop normally or be maintained. PCs are frequently innervated by additional CF, whereas innervation by main CFs becomes weaker. Ectopic PF synapses appear at proximal dendrites, causing disruption of CF and PF territory segregation along PC dendrites. We conclude that GLAST is indispensable for the establishment of excitatory synaptic wiring to PCs through competition between CFs and between CFs and PFs.
Keywords: glutamate transporter, Purkinje cell, Bergmann glia, climbing fiber, parallel fiber
Abstract
Astrocytes regulate synaptic transmission through controlling neurotransmitter concentrations around synapses. Little is known, however, about their roles in neural circuit development. Here we report that Bergmann glia (BG), specialized cerebellar astrocytes that thoroughly enwrap Purkinje cells (PCs), are essential for synaptic organization in PCs through the action of the l-glutamate/l-aspartate transporter (GLAST). In GLAST-knockout mice, dendritic innervation by the main ascending climbing fiber (CF) branch was significantly weakened, whereas the transverse branch, which is thin and nonsynaptogenic in control mice, was transformed into thick and synaptogenic branches. Both types of CF branches frequently produced aberrant wiring to proximal and distal dendrites, causing multiple CF–PC innervation. Our electrophysiological analysis revealed that slow and small CF-evoked excitatory postsynaptic currents (EPSCs) were recorded from almost all PCs in GLAST-knockout mice. These atypical CF-EPSCs were far more numerous and had significantly faster 10–90% rise time than those elicited by glutamate spillover under pharmacological blockade of glial glutamate transporters. Innervation by parallel fibers (PFs) was also affected. PF synapses were robustly increased in the entire dendritic trees, leading to impaired segregation of CF and PF territories. Furthermore, lamellate BG processes were retracted from PC dendrites and synapses, leading to the exposure of these neuronal elements to the extracellular milieus. These synaptic and glial phenotypes were reproduced in wild-type mice after functional blockade of glial glutamate transporters. These findings highlight that glutamate transporter function by GLAST on BG plays important roles in development and maintenance of proper synaptic wiring and wrapping in PCs.
Formation of specific and precise synaptic connections is prerequisite for proper functioning of the nervous system. Synaptic wiring to cerebellar Purkinje cells (PCs) is one of the best studied examples of neural circuit formation during postnatal development (1). Two glutamatergic inputs play critical roles in synaptic organization in the cerebellar cortex (2). Hundreds of thousands of parallel fibers (PFs) innervate distal spiny dendrites of PCs, whereas single climbing fibers (CFs) monopolize individual PCs by forming hundreds of synapses along proximal dendrites. CF monoinnervation and segregated CF and PF territories are two key features of PC circuitry that develop through tightly controlled processes (3).
In the early postnatal period, the soma of individual PCs is innervated by >5 CFs with similar synaptic strengths, from which a single CF is functionally strengthened (4, 5). The strengthened CF starts dendritic translocation, whereas the other weaker CFs remain in the soma until they are eliminated (6, 7). In this process, P/Q-type voltage-dependent Ca2+ channels promote functional differentiation and dendritic translocation of the strengthened CF, and propel the early phase of CF synapse elimination (8). The late phase of CF synapse elimination critically depends on PF synapse formation, in which the GluD2–Cbln1–neurexin adhesion system ensures structural connectivity of PF–PC synapses (9–11), whereas the type 1 metabotropic glutamate receptor–protein kinase Cγ signaling pathway mediates the activity of PF–PC synapses for CF synapse elimination (12–16). This signaling pathway also regulates territorial segregation by eliminating PF synapses from proximal dendrites (17). Thus, activity-dependent [Ca2+]i regulation and input-selective synaptic adhesion cooperate to sculpt PC circuitry properly.
Plasmalemmal glutamate transporters are essential for rapid clearance of glutamate released at synapses (18). In the cerebellum, Bergmann glia (BG), specialized astrocytes enwrapping PC dendrites and synapses (19), highly express l-glutamate/l-aspartate transporter (GLAST) (EAAT1/Slc1a3) with additional expression of GLT-1 (EAAT2/Slc1a2) (20, 21). Given high densities of glutamatergic synapses, these glial transporters permit high-fidelity signaling. Indeed, glutamate transporters are activated by synaptically released glutamate and shorten the time course of postsynaptic responses in PCs (22–24). Analyses of GLAST knockout (GLAST-KO) mice have revealed that GLAST plays an important role in rapid clearance of synaptically released glutamate, motor coordination, and establishment of CF monoinnervation (25, 26). The role in CF monoinnervation is based on the finding that two types of CF-evoked excitatory postsynaptic currents (CF-EPSCs) are recorded from single PCs in GLAST-KO mice: one with a fast rise and large amplitude and the other with a slow rise and small amplitude (25). This finding suggests aberrant wiring by multiple CFs with distinct neuronal origins in the inferior olive and with different innervation sites on PC dendrites. Nevertheless, the role in synaptic wiring remains inconclusive because such slow-rising CF-EPSCs are also elicited by spillover from neighboring CFs by acute pharmacological blockade of glial glutamate transporters by (2S,3S)-3-[3-(4-methoxybenzoylamino) benzyloxy] aspartate (PMB-TBOA) (27) in adult wild-type PCs (28). Here we investigated the role of GLAST in synaptic organization in PCs.
Results
Impaired Glial Wrapping.
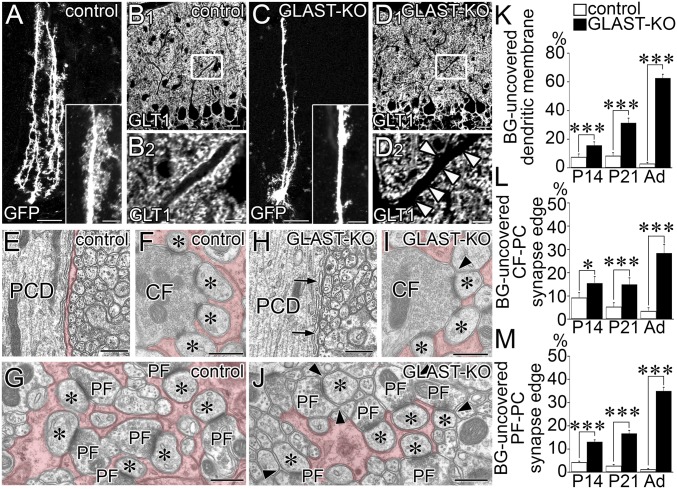
By lentiviral labeling of green fluorescent protein (GFP), Bergmann fibers were visualized to run from the soma to the pial surface in both control and GLAST-KO (mutant) mice (Fig. 1 A and C). Fine lamellate processes richly extended from Bergmann fibers in control mice, whereas they were poorly differentiated in mutant mice (Fig. 1 A and C, Insets). GLT-1-labeled BG processes almost fully enwrapped the shaft dendrites in control mice (Fig. 1B), whereas they were intermittent in mutant mice (Fig. 1D, arrowheads). Up-regulation of GLT-1 is known to occur in GLAST-KO cerebella (29). We tested this possibility by postembedding immunogold microscopy and found a twofold increase in GLT-1 labeling density in mutant mice (2.51 ± 0.20 particles per micrometer of BG membrane; n = 172 BG processes) compared with control mice (1.16 ± 0.11; n = 148; mean ± SEM, P < 0.0001, Mann–Whitney U test). These findings suggest two distinct changes in mutant BG: retraction of fine lamellate processes and compensatory up-regulation of GLT-1.
Fig. 1.
Impaired BG wrapping of PC dendrites and synapses. Images from control (A, B, and E–G) and mutant (C, D, and H–J) mice. (A and C) GFP-transfected BGs. (Insets) Enlarged Bergmann fibers. (B and D) Immunofluorescence for GLT-1. B2 and D2 are the boxed regions in B1 and D1, respectively. Arrowheads indicate lack of GLT-1-labeled BG processes at proximal shaft dendrites. (E–J) Electron micrographs of PCDs (E and H), CF–PC synapses (F and I), and PF–PC synapses (G and J) surrounded by BG processes (red). Arrows or arrowheads indicate dendritic membrane or the edges of the synaptic cleft without BG coverage, respectively. Asterisks indicate PC spines contacting CF or PF terminals. (K–M) Histograms showing the ratio of proximal shaft dendrites (K), CF–PC synaptic edge (L), and PF–PC synaptic edge (M) not covered by BG. The total measured lengths (mm) of the dendritic membrane are 1.73 and 1.87 at P14, 1.45 and 1.64 at P21, and 1.52 and 1.66 in the adult in control and mutant mice, respectively. The total numbers of the synaptic edge are 158 and 188 at P14, 165 and 166 at P21, and 194 and 168 in the adult for CF–PC synapses, and 2,250 and 1,940 at P14, 1,051 and 1,267 at P21, and 1,300 and 1,264 in the adult for PF–PC synapses in control and mutant mice, respectively. *P < 0.05; ***P < 0.001, Mann–Whitney U test. Error bars represent SEM. (Scale bars: A, B1, C, and D1, 20 µm; B2 and D2, Inset in A and C, 5 µm; E–I, 500 nm.)
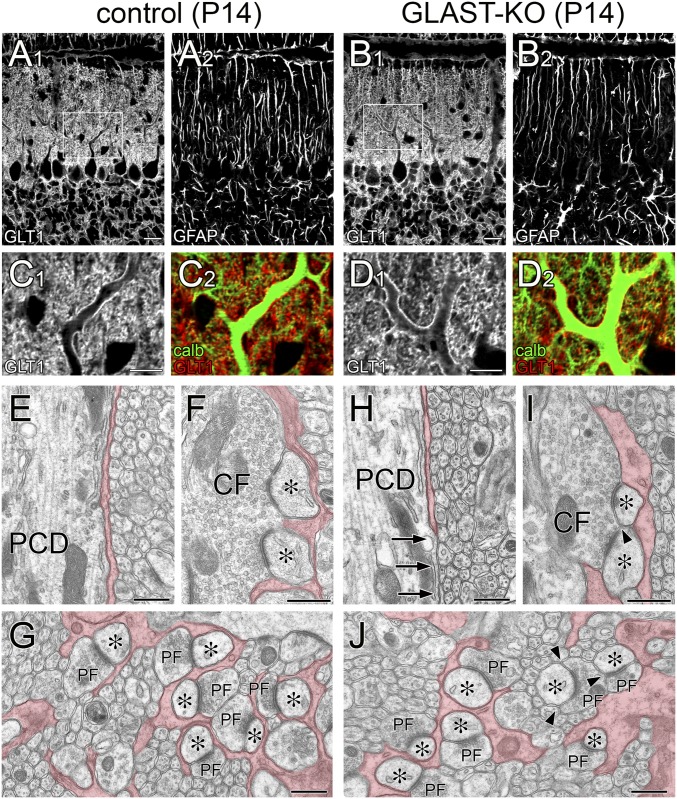
Retraction of glial processes was substantiated by electron microscopy. The extrasynaptic surface of dendritic shafts was completely enwrapped by BG processes in control mice (Fig. 1E), whereas glial coverage was often missing in mutant mice (Fig. 1H, arrows). In control mice, edges of the synaptic cleft were completely covered with BG processes at CF and PF synapses (Fig. 1 F and G), whereas synaptic edges often lacked glial coverage in mutant mice (Fig. 1 I and J, arrowheads). The ratio of dendritic surface and synaptic edges without glial coverage showed significant increases at dendritic shafts (Fig. 1K), CF synapses (Fig. 1L), and PF synapses (Fig. 1M) in mutant mice. Defected glial coverage was discerned on postnatal day 14 (P14; Fig. 1 K–M and Fig. S1), when active synaptogenesis is occurring in rodents (17, 30). Therefore, GLAST ablation impairs differentiation of fine BG processes and their wrapping of PC dendrites and synapses.
Fig. S1.
Mild impairment of BG coverage in GLAST-KO mice at P14. Light and electron microscopic images from control (A, C, and E–G) and mutant (B, D, and H–J) mice. (A–D) Triple immunofluorescence for glutamate transporter GLT-1 (A1–D1, C2, D2, red or gray), glial fibrillary acidic protein (GFAP; A2 and B2, gray), and calbindin (C2 and D2, green). Boxed regions in A and B are enlarged in C and D, respectively. No notable changes are discerned at the light microscopic level. In both mouse strains, shaft dendrites are similarly fringed with GLT-1-positive BG processes, and GFAP-positive Bergmann fibers are regularly arrayed in the molecular layer. (E–J) Electron micrographs of proximal shaft dendrites (E and H), CF–PC synapses (F and I), and PF–PC synapses (G and J). Arrows (H) indicate dendritic membrane without coverage of BG processes. Arrowheads (I and J) indicate the edges of the synaptic cleft without BG coverage, which contact with other neuronal elements. BG processes are pseudocolored in red. Asterisks indicate PC spines contacting CF or PF terminals. (Scale bars: A and B, 20 µm; C and D, 10 µm; E–J, 500 nm.)
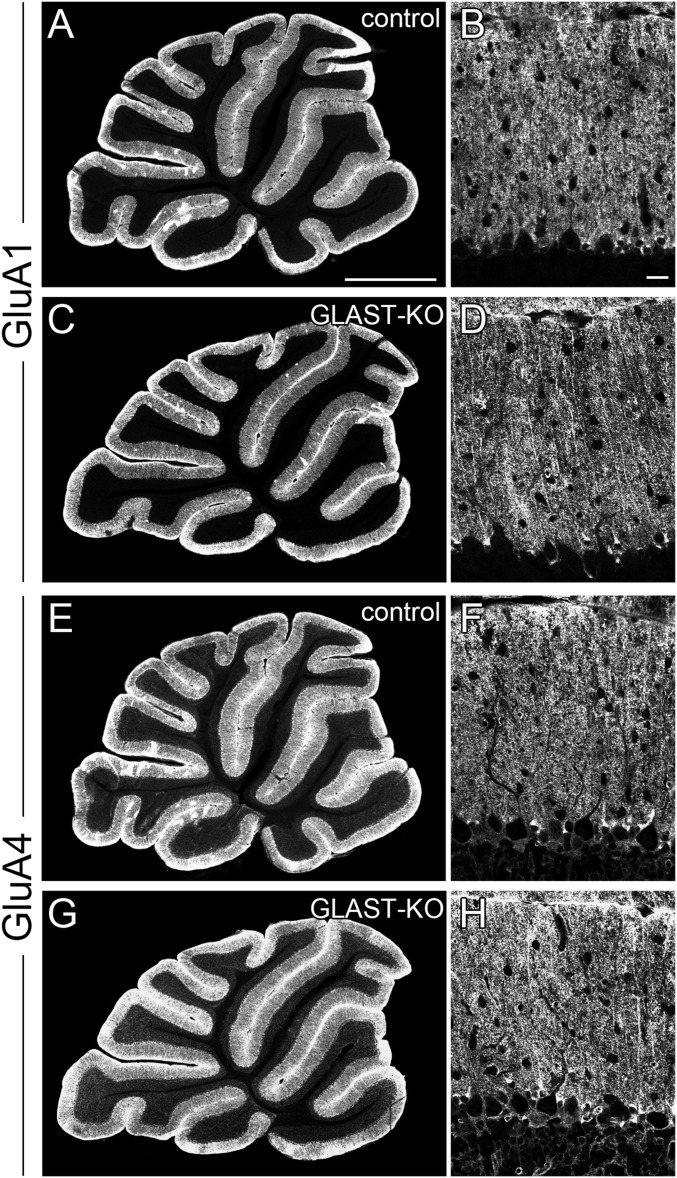
Ca2+-permeable AMPA receptors composed of GluA1/A4 are richly expressed in BG, and are essential for proper glial wrapping of PC synapses (31, 32). Conventional immunofluorescence, which preferentially detects glial, but not synaptic, AMPA receptors (33), showed comparable expression in the molecular layer between control and mutant mice (Fig. S2). Therefore, defected glial coverage in mutant mice is unlikely to result from down-regulation of Ca2+-permeable AMPA receptors.
Fig. S2.
Immunofluorescence for AMPA receptor GluA1 (A–D) and GluA4 (E–H) subunits in control (A, B, E, and F) and GLAST-KO (C, D, G, and H) mice. In the molecular layer of the cerebellum, conventional immunofluorescence (without section pretreatment with pepsin) preferentially detects AMPA receptors on BG, whereas immunofluorescence with pepsin pretreatment unmasks synaptic AMPA receptors (33). In this analysis, we adopted conventional immunofluorescence to compare GluA1 and GluA4 expression on BG. In GLAST-KO mice, the pattern and intensity of GluA1 and GluA4 immunolabeling in the molecular layer are similar to those in control mice, suggesting GLAST-KO BG normally express GluA1 and GluA4. (Scale bars: A, 1 mm; B, 20 µm.)
Impaired CF Innervation.
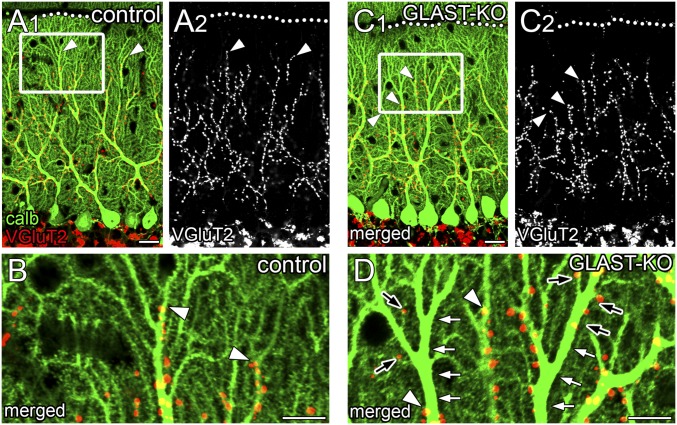
The distribution of CF terminals was examined by double immunofluorescence for calbindin and type 2 vesicular glutamate transporter (VGluT2), markers for PCs and CF terminals, respectively. In control mice, CF terminals were associated with proximal dendrites until their transition into spiny branchlets (Fig. 2 A and B, arrowheads). In mutant mice, CF terminals frequently stopped before reaching the transition (Fig. 2 C and D, arrowheads), leaving the remainder of proximal dendrites free of CF innervation (Fig. 2D, white arrows). Accordingly, the mean relative height to the most distal tips of CF terminals in the molecular layer was significantly reduced in mutant mice (68.5 ± 0.3%; n = 862 points) compared with in control mice (77.9 ± 0.2%; n = 1,093; P < 0.001, Mann–Whitney U test). Of note, one or a few isolated CF terminals often appeared in such vacant portions of proximal dendrites or at distal dendrites (Fig. 2D, black arrows).
Fig. 2.
Perturbed dendritic innervation by ascending CF branches. Double immunofluorescence for calbindin (green) and VGluT2 (red or gray) in control (A and B) and mutant (C and D) mice. B and D are boxed regions in A1 and C1, respectively. Arrowheads indicate the distal tips of VGluT2(+) CF terminals. In mutant mice; dendritic shafts often lack CF innervation (white arrows, D), but a few CF terminals reappear on such vacant portions of proximal dendrites or emerge at distal dendrites (black arrows, D). Dotted lines indicate the pial surface. (Scale bars: A and C, 20 µm; B and D, 10 µm.)
Aberrant Wiring by Ascending CF Branches.
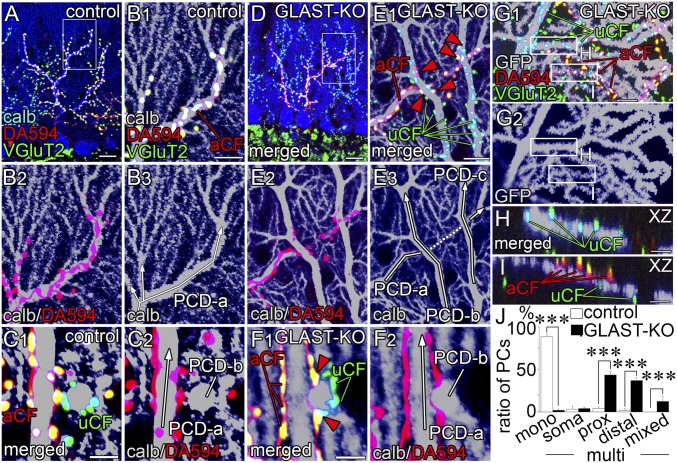
To clarify CF wiring patterns, we used triple fluorescence labeling (Fig. 3) consisting of anterograde CF labeling with dextran Alexa 594 (DA594, red), VGluT2 immunofluorescence (green), and calbindin immunofluorescence (blue in Fig. 3 A and D; gray in Fig. 3 B, C, E, and F). In control mice, DA594-labeled CFs ascended and branched along PC dendrites in the parasagittal plane (Fig. 3 A and B). In the horizontal plane, dendritic trees of given PCs were stacked into single straight bars or oval profiles, and fringed with either anterograde tracer-labeled CF (aCF) or anterograde tracer-unlabeled CF (uCF) (Fig. 3C). These represent the typical pattern of CF monoinnervation in control mice.
Fig. 3.
Multiple CF innervation at proximal (A–F) and distal (G–I) dendrites. (A–F) Triple labeling for calbindin (blue or gray), VGluT2 (green), and DA594 anterograde tracer (red) in control (A–C) and mutant (D–F) mice on parasagittal (A, B, D, and E) and horizontal (C and F) sections. B and E are enlarged images of boxed regions in A and D, respectively. Red arrowheads in E and F indicate aberrant innervation of tracer-labeled CFs that cause multiple CF innervation at proximal dendrites. White arrows indicate the course and branching of proximal shaft dendrites. (G–I) Triple labeling for GFP (gray), DA594 (red), and VGluT2 (green) in a GFP-transfected mutant PC, showing multiple innervation at distal dendrites. Boxed regions in G are enlarged as XZ-plane images of H and I. (J) Histogram showing the pattern and location of CF innervation: CF monoinnervation (mono) and multiple CF innervation (multi). The location of additional CF innervation is classified into somatic type (soma), proximal dendritic type (prox, >2 µm in caliber), distal dendritic type (distal, <2 µm), and mixed type (mixed). n = 189 cells from six control mice, n = 347 cells from eight mutant mice. ***P < 0.001, Mann–Whitney U test. Error bars represent SEM. aCF, VGluT2 (+)/anterograde tracer-labeled CF; PCD, Purkinje cell dendrite; uCF, VGluT2 (+)/tracer-unlabeled CF. (Scale bars: A and D, 20 µm; B, E, and G, 10 µm; C and F, 5 μm; H and I, 2 μm.)
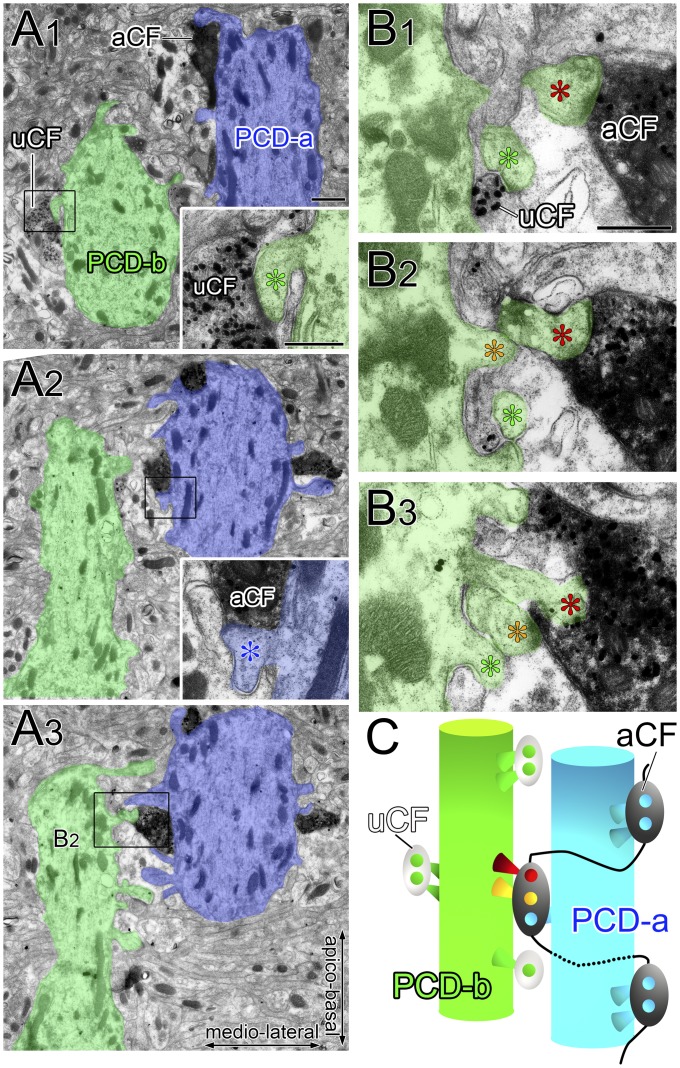
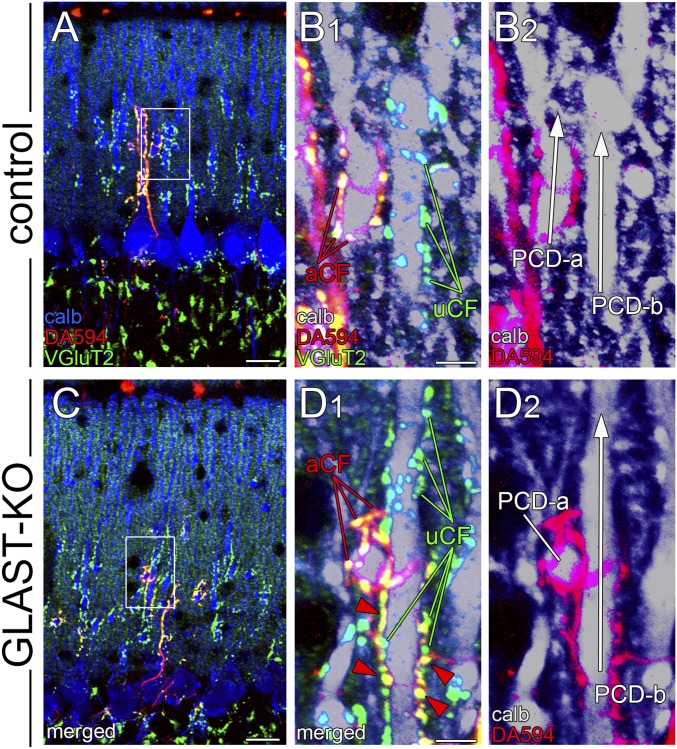
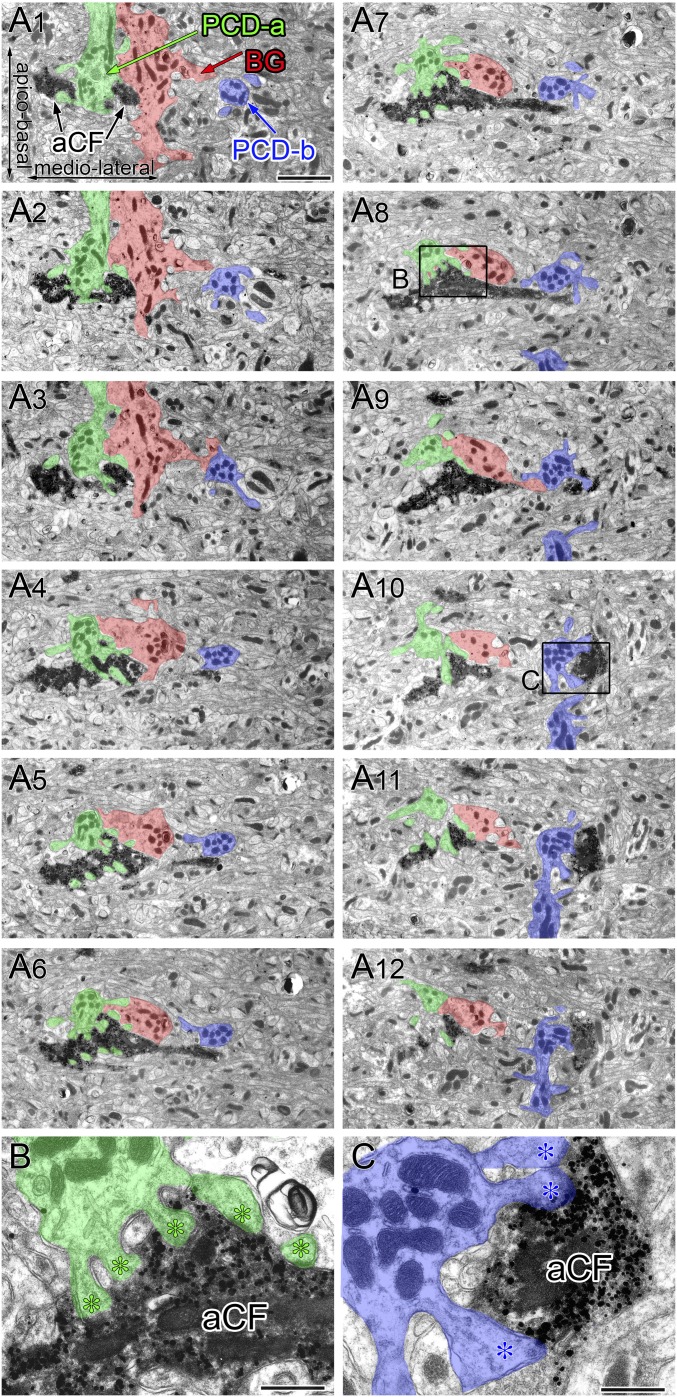
In mutant mice, aberrant CF wiring was readily visible at proximal dendrites. In Fig. 3 D and E, aCF ascended a PC dendrite (PCD-a) and emitted short branches bearing one or a few terminals attaching to adjacent dendrites PCD-b and PCD-c (red arrowheads). Because PCD-b and PCD-c were mainly innervated by uCF, this pattern indicates multiple CF innervation. In the horizontal plane, multiple CF innervation was also evident in triple fluorescent labeling (Fig. 3F, red arrowheads) and serial immunoelectron microscopy (Fig. S3). Such aberrant wiring at crossing points of proximal dendrites was found at P14 in mutant mice, but not in control mice (Fig. S4). Aberrant CF wiring also occurred at distal dendrites. Dendritic trees of single PCs were visualized by sparse lentiviral GFP labeling. A GFP-labeled PC shown in Fig. 3 G–I (gray) was mainly innervated by uCF. However, imaging in the XZ plane captured that aCF running nearby innervated a spiny branchlet of the same PC and caused multiple CF innervation (Fig. 3I).
Fig. S3.
Serial electron micrographs demonstrating multiple CF innervation caused by ascending CF branches in GLAST-KO mice. Horizontal cerebellar sections double-labeled for VGluT2 (metal particles produced by silver-enhanced immunogold) and BDA (diffuse precipitates produced by immunoperoxidase) in mutant mice. (A) Two adjacent dendrites, PCD-a (blue) and PCD-b (green), are shown. (Insets) Boxed regions in A1 and A2 are enlarged, showing that PCD-a is mainly innervated by an aCF, whereas PCD-b is mainly innervated by a uCF. (B) The boxed region in A3 (corresponding to B2) and adjacent images are enlarged in B1–B3. Note that two spines from PCD-b (red and yellow asterisks) are aberrantly innervated by aCF, whereas one spine from PCD-b (green asterisks) is innervated by uCF, demonstrating multiple CF innervation of PCD-b. (C) A schematic drawing illustrates aberrant CF wiring causing multiple CF innervation by ascending CF branches in GLAST-KO mice. (Scale bars: A, 1 µm; Insets in A and B, 500 nm.)
Fig. S4.
Triple fluorescence labeling demonstrating aberrant CF wiring by the ascending branch of CFs causing multiple innervation in GLAST-KO mice at P14. Calbindin immunofluorescence (blue or gray), VGluT2 immunofluorescence (green), and dextran Alexa 594 tracer labeling (DA594, red) in control (A and B) and mutant (C and D) mice using horizontal cerebellar sections. Boxed regions in A and C are enlarged in B and D, respectively. PC dendrites, PCD-a and PCD-b, in control mice are innervated by aCF or uCF only, whereas PCD-b in mutant mice are innervated by both aCF and uCF. White arrows indicate the course of proximal shaft dendrites of individual PCs. (Scale bars: A and C, 20 µm; B and D, 5 µm.)
From triple labeling images for DA594, VGluT2, and calbindin, we classified the pattern and location of CF innervation (Fig. 3J). Monoinnervation pattern was overwhelming in control PCs (88.7 ± 3.1%), whereas multiple innervation pattern was found in the vast majority of mutant PCs (97.8 ± 1.0%). In mutant PCs, aberrant CF wiring was frequently observed at proximal (43.8 ± 4.1%) and distal (37.2 ± 3.0%) dendrites. GLAST ablation thus induces aberrant CF wiring, causing multiple innervation of neighboring PCs at both proximal and distal dendrites.
Aberrant Wiring by Transverse CF Branches.
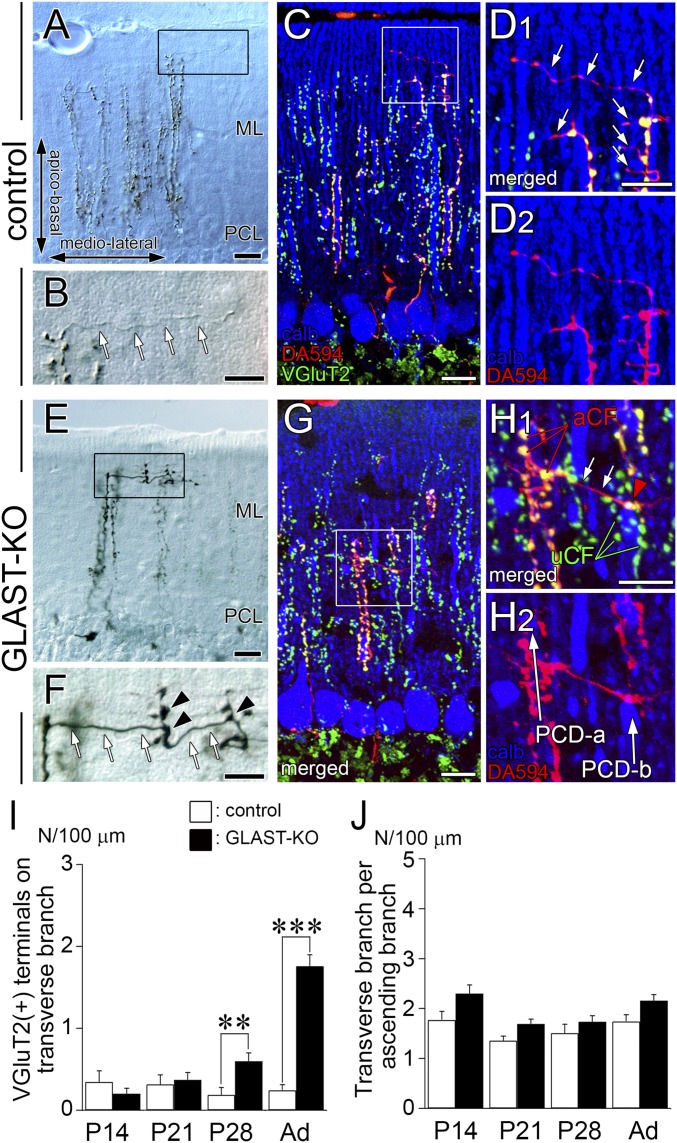
In wild-type mice, ascending branches of CFs extend motile collaterals called transverse branches, which traverse in the transverse plane and form neither VGluT2-containing varicosities nor synapses (34). We confirmed these features in control mice (Fig. S5 A–D). In mutant mice, the transverse branch was markedly thickened, bore VGluT2(+) varicosities (Fig. S5 E–H), and formed synapses on neighboring PC dendrites (Fig. S6). The density of VGluT2(+) terminals on transverse branches was significantly increased at P28 and adulthood (Fig. S5I), whereas the density of transverse branches per se showed no changes at any stage examined (Fig. S5J). Therefore, nonsynaptogenic transverse branches in control mice are transformed into synaptogenic branches in mutant mice, and the transformation becomes first evident at P28, when active synaptogenesis is over.
Fig. S5.
Aberrant wiring by transverse CF branches causing multiple CF innervation in GLAST-KO mice. Horizontal cerebellar sections in control (A–D) and mutant (E–H) mice. (A, B, E, and F) Phase-contrast views showing CF labeling with anterograde tracer BDA injected into the inferior olive. (C, D, G, and H) Triple fluorescence images of calbindin immunofluorescence (blue), VGluT2 immunofluorescence (green), and DA594 tracer labeling (red). Note that transverse CF branches (white arrows) lack terminal varicosities and VGluT2 accumulation in control mice (B and D), whereas they exhibit numerous varicosities containing VGluT2 (black and red arrowheads) and innervate neighboring PC dendrites in mutant mice (F and H). (I) The density of VGluT2(+) varicosities per 100 µm of transverse CF branches at P14, P21, P28, and adulthood. (J) The density of transverse branches per 100 µm ascending CF branches at P14, P21, P28, and adult. The total measured lengths (mm) of the transverse branches are 2.46, 2.99, 2.35, and 5.30 in control mice, and 3.93, 6.15, 5.33, and 10.9 in mutant mice at P14, P21, P28, and adulthood, respectively. The total measured lengths (mm) of the ascending branches are 16.4, 27.9, 13.7, and 26.1 in control mice, and 16.4, 39.4, 29.4, and 45.6 in mutant mice at P14, P21, P28, and adulthood, respectively. **P < 0.01; ***P < 0.001, Mann–Whitney U test. Error bars represent SEM. (Scale bars: A, C, E, and G, 20 µm; B, D, F, and H, 10 µm.)
Fig. S6.
Serial electron micrographs demonstrating aberrant innervation of adjacent PC dendrites by the transverse branch of CFs in GLAST-KO mice. Horizontal cerebellar sections double-labeled for VGluT2 (metal particles by silver-enhanced immunogold) and BDA (diffuse precipitates by immunoperoxidase). A BDA(+)/VGluT2(+) CF (aCF) innervating a dendrite, PCD-a (green), traverses in the mediolateral direction and forms synapses onto PCD-b (blue). PCD-a and PCD-b are separated by a Bergmann fiber (red), suggesting these dendrites are derived from adjacent, but different, PCs. Boxed regions in A8 and A10 are enlarged in B and C, respectively, to show synaptic contacts. (Scale bars: A, 2 µm; B and C, 500 nm.)
Atypical Slow and Small CF EPSCs.
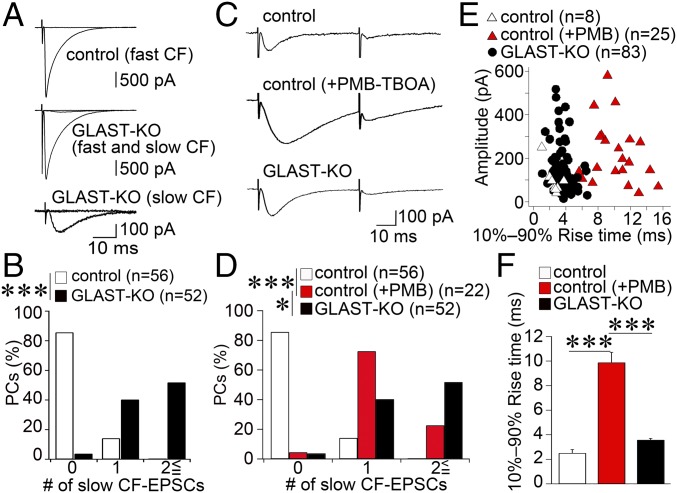
Next, we analyzed CF innervation electrophysiologically in acute cerebellar slices. We recorded CF-evoked responses from PC somata and found that, in most of the control PCs (66.1%; n = 56 cells from four mice), a single large CF-EPSC was elicited in an all-or-none fashion (Fig. 4A, Upper). In contrast, almost all mutant PCs (98.0%; n = 52 cells from four mice) exhibited multiple CF-EPSC steps consisting of a single main CF response with the largest amplitude and one or more additional CF response or responses with small amplitudes (Fig. 4A, Middle). As reported previously (25), two types of small-amplitude CF-EPSCs were observed in mutant PCs: one with a fast 10–90% rise time (≤1 ms), similar to a single main CF-EPSC, and the other with a slow 10–90% rise time (>1 ms; Fig. 4A, Bottom). Slow CF-EPSCs were elicited in 96.1% of mutant PCs and constituted the majority of small CF-EPSCs. The frequency–distribution histogram for the number of slow CF-EPSCs also showed a significant genotypic difference (Fig. 4B; P < 0.001, Mann–Whitney U test).
Fig. 4.
Atypical slow CF-EPSCs in mutant mice have faster kinetics than those induced by PMB-TBOA application in control mice. (A) Representative traces of CF-EPSCs in PCs from control (Upper) and mutant (Middle and Bottom) mice. One or two traces are superimposed at each threshold intensity. Holding potential (Vh) was −20 mV for the top and middle traces and −80 mV for the bottom trace. (B) Frequency–distribution histogram showing the number of discrete CF-EPSC steps with a slow 10–90% rise time (>1 ms) for control (white columns) and mutant (filled columns) mice. ***P < 0.001, Mann–Whitney U test. (C) Sample traces of slow CF-EPSCs evoked by paired CF stimulation with an interpulse interval of 50 ms. Note that slow CF-EPSCs have slower kinetics in control mice treated with 200 nM PMB-TBOA (Middle) than in untreated control (Upper) or mutant (Bottom) mice. Vh, −80 mV. (D) Frequency–distribution histogram showing the number of discrete CF-EPSC steps with a slow 10–90% rise time (>1 ms) in untreated (white columns) and PMB-TBOA–treated (red columns) control mice and in untreated mutant mice (black columns). Note that the probability of occurrence of slow CF-EPSCs is significantly increased by PMB-TBOA in control mice but is still significantly lower compared with untreated mutant mice. ***P < 0.001; *P < 0.05; post hoc Dunn’s test. (E) Scatter plot of the amplitude (ordinate, pA) and the 10–90% rise time (abscissa, ms) of slow CF-EPSCs measured at a holding potential of −80 mV. (F) Summary bar graphs comparing the average 10–90% rise time of slow CF-EPSCs in untreated (white columns) and PMB-TBOA–treated (red columns) control mice, and in untreated mutant mice (black columns). Error bars represent SEM. ***P < 0.001; post hoc Dunn’s test. Numbers of PCs examined are shown in parentheses. Holding potential was corrected for liquid junction potential.
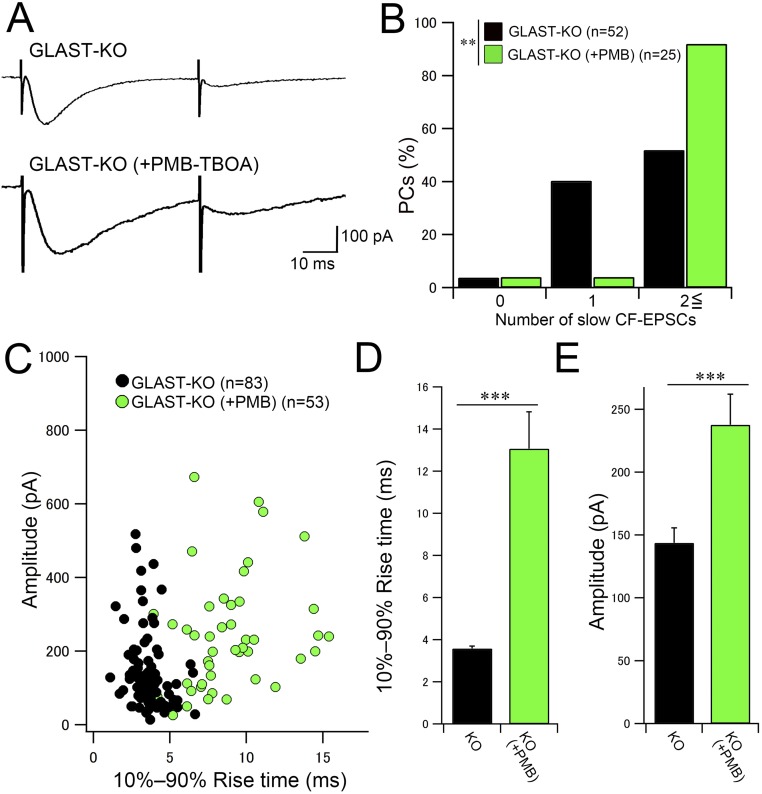
Because CF-EPSCs arising at distal dendritic compartments tend to be slow and of low amplitude (12, 35), atypical CF-EPSCs in mutant mice may arise from excess CF wiring at distal dendrites (Figs. 1 and 3). Given that glutamate transporters function as potent diffusion barriers, atypical EPSCs can be also elicited by functional crosstalk through glutamate spillover in mutant mice. Indeed, such slow responses have been elicited in control mice by inhibiting glial glutamate transporters by PMB-TBOA (27, 28). To evaluate the contributions of glutamate spillover, changes in electrophysiological properties of slow CF-EPSCs were examined in the absence or presence of 200 nM PMB-TBOA in control mice. Consistent with the previous report (28), CF-EPSCs with a slow 10–90% rise time (>1 ms) and displaying prominent paired-pulse depression (Fig. 4C) were rare in control PCs (n = 56 cells from 2 mice; Fig. 4D, white columns) and were markedly increased after PMB-TBOA treatment (22 cells from 2 mice; Fig. 4D, red columns). Nevertheless, the number of slow CF-EPSCs in PMB-TBOA–treated control PCs was significantly fewer than in PMB-TBOA–untreated mutant PCs (Fig. 4D, black columns; P < 0.05, post hoc Dunn’s test). We also tested the effect of PMB-TBOA treatment in mutant mice and found further increase of slow CF-EPSCs (n = 25 cells from two mice; P < 0.001, Mann–Whitney U test; Fig. S7, green columns).
Fig. S7.
PMB-TBOA treatment significantly increases the number of slow CF-EPSCs in GLAST-KO mice. (A) Representative traces of slow CF-EPSCs in response to paired CF stimulation with an interpulse interval of 50 ms. Note that slow CF-EPSCs in 200 nM PMB-TBOA–treated mutant mice (Bottom) have slower kinetics than those in untreated mutant mice (Upper). Vh, −80 mV. (B) Frequency–distribution histogram showing the number of discrete CF-EPSC steps with a slow 10–90% rise time (>1 ms) in untreated (black columns) and PMB-TBOA–treated (green columns) mutant mice. Note that the probability of occurrence of slow CF-EPSCs is significantly increased by PMB-TBOA application in mutant mice. ***P < 0.001, Mann–Whitney U test. (C) Scatter plot of the amplitude (ordinate, pA) and the 10–90% rise time (ms, abscissa) of slow CF-EPSCs measured at a holding potential of −80 mV. (D and E) Summary bar graphs showing the average 10–90% rise time (D) and amplitude (E) of slow CF-EPSCs from untreated (black columns) and PMB-TBOA–treated (green columns) mutant mice. The data for mutant mice without PMB-TBOA treatment in B–E are the same as those shown in Fig. 4. Error bars represent SEM. ***P < 0.001; **P < 0.01; post hoc Dunn’s test. Numbers of PCs and responses examined are shown in parentheses. Holding potential was corrected for liquid junction potential.
To compare the properties of slow CF-EPSCs, peak amplitudes of individual slow CF-EPSCs were plotted against their 10–90% rise times (Fig. 4E). In the absence of PMB-TBOA, the distributions of slow CF-EPSCs in control and mutant mice largely overlapped [white triangles (n = 8 cells from four mice) and black circles (n = 83 cells from four mice), respectively], showing no significant differences in the 10–90% rise time (Fig. 4F, white and black columns; P = 0.58, post hoc Dunn’s test). After PMB-TBOA treatment, the 10–90% rise time of slow CF-EPSCs was further prolonged in control mice [Fig. 4E, red triangles (n = 25 cells from two mice); Fig. 4F, red columns], showing little overlap with plots in PMB-TBOA–untreated control and mutant mice (P < 0.001, post hoc Dunn’s test). These results demonstrate that slow CF-EPSCs in mutant mice show distinct electrophysiological properties from those induced by glutamate spillover.
Aberrant PF Wiring.
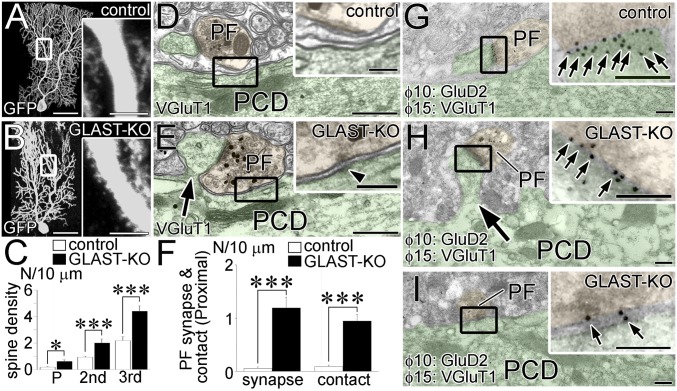
Spine-like protrusions were significantly increased at the primary, secondary, and tertiary dendrites in mutant mice (Fig. 5 A–C). By preembedding immunogold electron microscopy, VGluT1-labeled PF terminals were completely separated from shafts of proximal dendrites by glial processes, and rarely formed synapses at proximal dendrites in control mice (Fig. 5D). In mutant mice, PF terminals frequently contacted dendritic shafts directly (Fig. 5E, Box) and formed synapses on ectopic spines from proximal dendrites (Fig. 5E, arrow), showing significant genotypic differences (Fig. 5F; P < 0.001 for each, Mann–Whitney U test; n = 59 and 45 dendrites in three control and mutant mice, respectively). In such aberrant contacts, small synapse-like condensations were often differentiated in the cytoplasmic side of apposed cell membranes (Fig. 5E, arrowhead in Inset).
Fig. 5.
Excess PF wiring. Images from control (A, D, and G) and mutant (B, E, H, and I) mice. Boxed regions are enlarged in Insets. PCDs and PF terminals are pseudocolored in green and yellow, respectively. (A and B) GFP-transfected PCs. (C) The density of spines per 10 µm of the primary, secondary, and tertiary dendrites. The total measured lengths (mm) of the primary, secondary, and tertiary dendrites are 0.59, 3.93, and 1.51 in control mice and 0.60, 1.42, and 1.71 in mutant mice, respectively. (D and E) Preembedding immunogold for VGluT1, a marker for PF terminals. (F) The density of PF synapses (Left) and direct PF contacts (Right) per 10 µm of proximal shaft dendrites (>2 µm in caliber). The total measured lengths (μm) are 933.6 and 517.4 in control and mutant mice, respectively. *P < 0.05; ***P < 0.001, Mann–Whitney U test. Error bars represent SEM. (G–I) Postembedding immunogold labeling for GluD2 (ϕ = 10 nm, small arrows) and VGluT1 (ϕ = 15 nm). (Scale bars: A and B, 50 µm; Inset in A and B, 10 µm; D and E, 500 nm; G–I, 200 nm; Insets in D, E, and G–I, 100 nm.)
To examine synaptic differentiation, we performed postembedding immunogold for glutamate receptor GluD2, a molecule selective to PF–PC synapses (36, 37). Similar to PF–PC synapses in control mice (Fig. 5G), immunogolds for GluD2 were deposited densely at PF synapses on ectopic spines from proximal dendrites in mutant mice (Fig. 5H). Importantly, low GluD2 labeling was detected at PF–PC contacts with synapse-like small condensations (Fig. 5I). Although no significant changes were reported for electrophysiological properties of PF-EPSCs in GLAST-KO mice (25, 38), the loss of GLAST promotes the differentiation of PF synapses and expands the PF territory to encompass the entire dendritic trees.
Reproduced Phenotypes by PMB-TBOA.
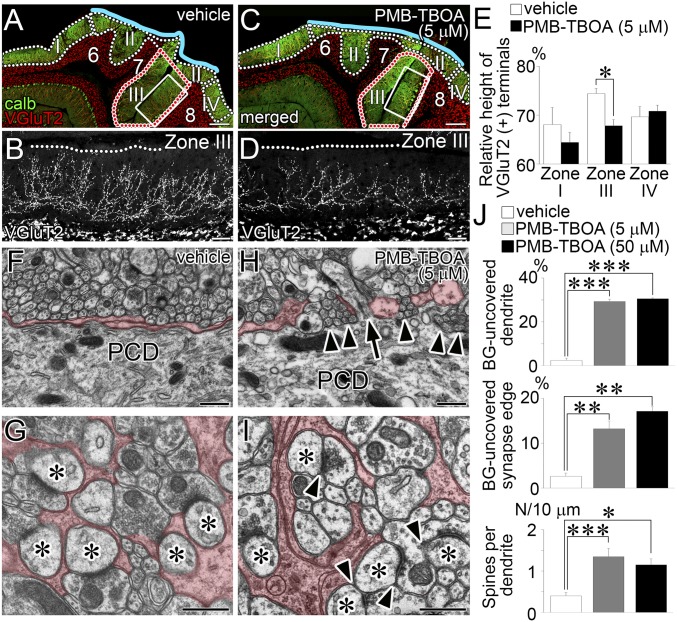
To examine whether the above defects occurred by blockade of glial glutamate transporters, 5 µM PMB-TBOA was chronically applied to the cerebellum of C57BL/6 mice by Elvax (14). The drug efficacy was assessed by relative height of VGluT2-labeled CF terminals. PMB-TBOA treatment significantly reduced the height in zone III, which was deep to the implant, but not in zones I and IV, which were rostral or caudal to the implant, respectively (Fig. 6 A–E). In zone II, directly contacting the implant, mechanical damage hindered reliable assessment.
Fig. 6.
Reproduced glial and synaptic phenotypes after PMB-TBOA treatment in wild-type mice. Vehicle (A, B, F, and G) or 5 µM PMB-TBOA (C, D, H, and I) treatment. (A–D) Double immunofluorescence for calbindin (green) and VGluT2 (red or gray). B and D show VGluT2 labeling of boxed regions in A and C, respectively. Blue lines indicate the pial surface of lobules 6–8 in contact with Elvax implants. (E) Histograms showing the mean vertical height to the distal tips of VGluT2(+) CF terminals relative to the thickness of the molecular layer in zones I, III, and IV. *P < 0.05, Mann–Whitney U test. The total measured thickness (mm) of the molecular layer in control and mutant mice is 12.9 (n = 96 points) and 11.6 (n = 73) in zone I, 22.0 (n = 142) and 27.6 (n = 182) in zone III, and 14.0 (n = 107) and 17.6 (n = 97) in zone IV, respectively. (F–I) Electron micrographs showing proximal dendrites (F and H) and PF–PC synapses (G and I). Arrowheads indicate the loss of BG coverage. Arrow indicates an ectopic spine from proximal dendrite in contact with PF terminal. Asterisks indicate PC spines contacting PF terminals. (J) Histograms showing the percentages of dendritic shafts (>2 µm in caliber; Upper) and PF–PC synapse edges (Middle) lacking BG coverage, and the density of PC spines at proximal shaft dendrites (>2 µm in caliber, Bottom). The total measured lengths (mm) of proximal shaft dendrites are 0.99, 1.32, and 1.08, and the total measured numbers of PF–PC synapse edges are 780, 1,384, and 1,057 in vehicle-treated, 5 µM PMB-TBOA–treated, and 50 µM PMB-TBOA–treated mice, respectively. *P < 0.05; **P < 0.01; ***P < 0.001; Bonferroni correction. Error bars represent SEM. (Scale bars: A and C, 200 µm; B and D, 50 µm; F–I, 500 nm.)
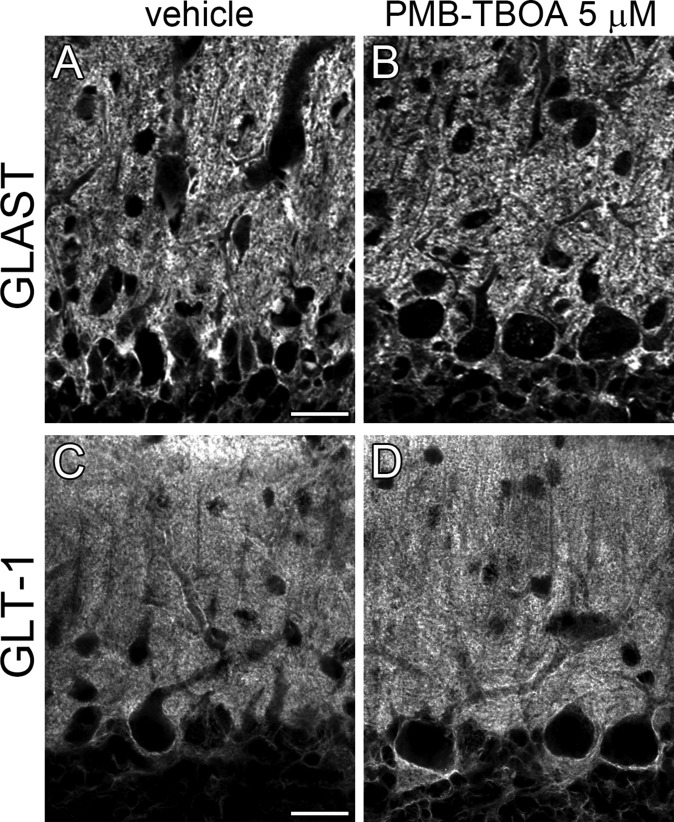
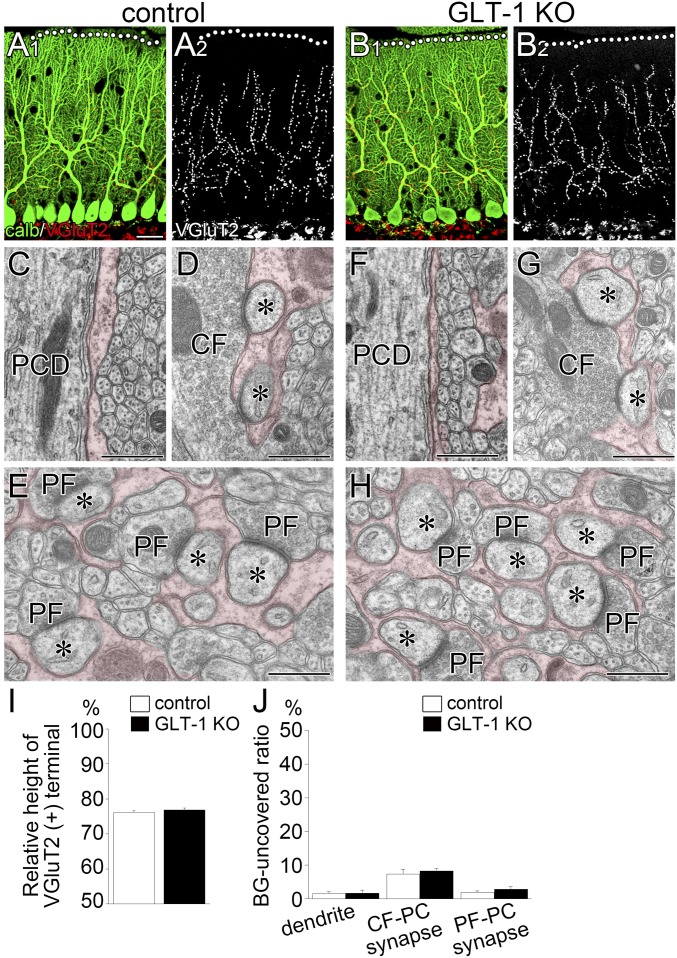
Zone III was analyzed by electron microscopy. PMB-TBOA treatment caused defected glial coverage of PC dendrites and synapses (Fig. 6 F–I) and increased ectopic PF synapses at proximal dendrites (Fig. 6H, arrow), as confirmed quantitatively (Fig. 6J, white and gray columns; P < 0.0001 for each, Bonferroni correction). Moreover, effects of 5 µM PMB-TBOA treatment were similar to those of 50 µM PMB-TBOA treatment (Fig. 6J, black columns, respectively), indicating that the drug efficacy has plateaued at 5 µM in zone III. No discernible changes in GLAST and GLT-1 expression were observed between 5 µM PMB-TBOA–treated and vehicle groups (Fig. S8). Furthermore, GLT-1 KO mice at P21 showed no significant alterations in CF-PC wiring or BG wrapping of PCs (Fig. S9). These data support the notion that GLAST is the major glial glutamate transporter in BG at both expression and functional levels (29) and indicate that the changes after PMB-TBOA treatment can be ascribed mainly to functional blockade of GLAST. Together, glutamate uptake function, but not expression, of GLAST is essential for normal synaptic wrapping and wiring in PCs.
Fig. S8.
Chronic application of PMB-TBOA by Elvax did not alter the expression pattern of glial glutamate transporters. Immunofluorescence for GLAST (A and B) and GLT-1 (C and D) in the cerebellum of vehicle-treated (A and C) and PMB-TBOA–treated (5 μM) (B and D) wild-type mice. Micrographs were taken from zone III (shown by red dotted lines in Fig. 6 A and C), an adjacent portion deep to Elvax implant. (Scale bars, 20 μm.)
Fig. S9.
Normal dendritic translocation by CFs and normal BG wrapping of PC dendrites and synapses in GLT1-KO mice at P21. (A and B) Double immunofluorescence for calbindin (green) and VGluT2 (red or gray) in control (A) and GLT-KO (B) mice. (C–H) Electron micrographs of PCDs (C and F), CF–PC synapses (D and G) and PF–PC synapses (E and H) surrounded by BG processes (pseudocolored in red) in control (C–E) and GLT-1 KO mice (F–H). Dendritic surface and synaptic edges are normally covered by BG processes in GLT1-KO mice. Asterisks indicate PC spines contacting CF or PF terminals. (I) Histogram showing normal vertical height of VGluT2(+) CF terminals relative to the molecular layer thickness in GLT1-KO mice: 76.2 ± 0.5% in control (n = 129) and 76.9 ± 0.5% in GLT-1 KO (n = 180) mice; P = 0.2591, Mann–Whitney U test. (J) Histograms showing normal BG coverage of proximal shaft dendrites (Left; P = 0.2330, Mann–Whitney U test), CF–PC synaptic edge (Middle; P = 0.6579), and PF–PC synaptic edge (Right; P = 0.2752) in GLT1-KO mice. The total measured lengths of the dendritic membrane are 424.5 and 380.0 μm in control and GLT-1 KO mice, respectively. The total numbers of the synaptic edge are 86 and 118 for CF–PC synapses, and 396 and 350 for PF–PC synapses in control and mutant mice, respectively. Error bars represent SEM. (Scale bars: A, 20 µm; C–H, 500 nm.)
Discussion
GLAST plays a key role in preventing glutamate spillover in the cerebellar cortex, but its role in synaptic organization remains uncertain (25, 28). In the present study, we examined GLAST-KO cerebella and revealed various defects in synaptic wrapping by BG and synaptic wiring of PCs. These phenotypes were reproduced in wild-type mice after PMB-TBOA blockade starting after active synaptogenesis is over. Our findings highlight that glutamate uptake function of GLAST plays a key role in the development and maintenance of synaptic organization in PCs.
Glial Wrapping.
Lamellate BG processes display strong structural affinity for PCs (19, 39). In control mice, PC dendrites and synapses were almost completely covered by BG processes from the early postnatal period. In contrast, incomplete coverage was already evident at P14 and exacerbated in adulthood in GLAST-KO mice. How is glial wrapping impaired in GLAST-KO mice? Because AMPA receptors quickly desensitize (40, 41), sustained elevation of extracellular glutamate concentrations ([Glu]e) in GLAST-KO and PMB-TBOA–treated mice might desensitize Ca2+-permeable AMPA receptors on BG. If this is the case, impaired Ca2+ influx causes retraction of BG processes, such as GluA2-transfected or GluA1/GluA4-KO BG (31, 32).
It is also known that glutamate uptake by glial glutamate transporters mediates metabolic crosstalk between neurons and glia (42). On enhanced synaptic activities, Na+ influx coupled with glutamate transport increases glucose uptake and glycolysis by astrocytes and increases lactate supply to local neurons and synapses. Given that lamellate BG processes differentiate in tight correlation with dendritic outgrowth and synapse formation in PCs (19), GLAST ablation may disrupt this neuron–glial interplay during development and in adulthood, thereby impairing the cytodifferentiation of BG.
Synaptic Wiring.
In GLAST-KO mice, hyperspiny transformation was induced, and ectopic PF synapses and contacts frequently occurred at proximal dendrites. Furthermore, two types of CF branches caused aberrant wiring onto neighboring PC dendrites. Electrophysiologically, slow CF-EPSCs in GLAST-KO PCs were far more numerous and had distinct kinetics compared with those in PMB-TBOA–treated control PCs, suggesting the former should reflect aberrant wiring, at least partly. How does the loss of GLAST promote the aberrant glutamatergic wiring?
When desensitization of AMPA receptor is reduced by cyclothiazide, GLAST-KO mice manifest significant increases in 10–90% rise time, peak amplitude, and decay time constant in both PF- and CF-EPSCs compared with wild-type (24). These functional phenotypes indicate an important role of GLAST in rapid and bulk clearance of synaptic glutamate. In GLAST-KO mice, sustained high [Glu]e may accelerate aberrant wiring by reducing the fidelity and specificity of glutamatergic transmission and permitting local crosstalk among glutamatergic synapses. This notion is supported by previous studies showing that exogenously applied glutamate promotes spinogenesis in hippocampal neurons (43). In the cerebellum, retraction of BG processes increases PF–PC synapse number (44), induces multiple CF innervations onto PCs (31), and impairs fine motor coordination (32). All these phenotypes are observed in GLAST-KO mice (26, present study). In GLAST-KO mice, retraction of BG processes further exacerbates glutamate spillover, whereas compensatory up-regulation of GLT-1 counteracts it. Taking no such defects in synaptic wiring and wrapping in PCs of GLT1-KO mice, BG processes enriched with these transporters, particularly GLAST, should play key roles as a physical insulator that separates individual PC dendrites and synapses, and also as a chemical insulator that limits glutamate spillover beyond the synapses. These insulator functions may prevent aberrant and excessive synapse formation, thereby maintaining proper excitatory wiring in PCs.
Synaptic Competition.
The phenotype of GLAST-KO mice provides insight into the process of competitive synaptic wiring by PF and CF inputs (3). In this mutant, innervation by the main CF was significantly weakened, whereas the formation of aberrant CF synapses and ectopic PF synapses was facilitated. This wiring pattern is analogous to that observed in the developing cerebellum, where a single strengthened CF is not yet strong enough to eliminate the other weaker CFs from PC somata (7), and PF synapses cover the entire dendritic tree (45). To establish CF monoinnervation and segregated PF/CF territories, proper activations of P/Q-type Ca2+ channels and the type 1 metabotropic glutamate receptor–Gαq–PLCβ4–protein kinase Cγ signaling pathway by glutamatergic inputs are crucial (8, 15–17). Therefore, one factor likely contributing to the impaired synaptic competition in GLAST-KO mice is the elevated [Glu]e, which may alter the balance of activation between glutamatergic synapses in favor of the inputs that should normally be eliminated over the ones that should remain or be further strengthened.
The involvement of glial glutamate transporters in synaptic competition has been documented in the somatosensory cortex, where GLT-1 is mainly expressed in cortical astrocytes with additional expression of GLAST (20, 21). When whiskers are damaged during the critical period, lesioned barrels shrink and adjacent intact barrels expand (46). Intriguingly, the magnitude of this lesion-induced plasticity is diminished severely in GLT-1-KO mice, and mildly in GLAST-KO mice (47). Because whisker-related patterning is regulated by the NMDA-type glutamate receptor and the mGluR5–PLCβ1 signaling pathway (48–50), elevated [Glu]e in the somatosensory cortex may also impair the discrimination of activity disparity among glutamatergic inputs. On the basis of these phenotypic and molecular similarities, we hypothesize that glutamate transporters keeping [Glu]e low fuel competitive glutamatergic wiring so that synapses with advantaged inputs are further strengthened and consolidated, whereas those with disadvantaged inputs are further weakened or eliminated.
Materials and Methods
In the present study, we performed immunofluorescence, immunoelectron microscopy, anterograde tracer labeling, Elvax implantation, viral vector preparation, and electrophysiology. Animal experiments were performed according to the guidelines for the care and use of laboratory animals of the Hokkaido University Graduate School of Medicine. More information about the experimental procedures and the specificity of primary antibodies (refs. 17, 19, 33, 37, 47; Table S1) is available in the SI Materials and Methods.
Table S1.
Details of the primary antibodies used
| Molecule | Sequence NCBI | Host | Specificity | Ref. | RRID |
| Calbindin | 1–261aa NM009788 | Go | IB, IHC | 17 | AB_2571569 |
| GFAP | 335–400aa AF332061 | GP | IB, IHC | 19 | AB_2571709 |
| GFP | 1–238aa YP_002302326 | Rb | IHC | 17 | AB_2571573 |
| GLT-1 | 540–572aa NM001077514 | Rb | IB, KO | 47 | AB_2571718 |
| GluA1 | 841–907aa X57497 | Rb | IB, KO | 33 | AB_2571752 |
| GluA4 | 849–902aa AB022913 | Rb | IB, KO | 33 | AB_2571755 |
| GluD2 | 897–934aa NM_008167 | Rb | IB, KO | 37 | AB_2571601 |
| VGluT1 | 531–560aa BC054462 | Rb | IB | 37 | AB_2571616 |
| VGluT2 | 559–582aa BC038375 | GP | IB | 17 | AB_2571621 |
aa, amino acid residues; GFAP, glial fibrillary acidic protein; GFP, green fluorescent protein; GLT-1, glutamate transporter-1; GluA1, 4, AMPA-type glutamate receptor subunit-1, 4; GluD2, glutamate receptor delta-2; Go, goat polyclonal antibody; GP, guinea pig polyclonal antibody; IB, immunoblot with brain homogenates; IHC, cell type-specific immunohistochemical labeling; KO, lack of immunohistochemical or immunoblot labeling in knockout mice; Rb, rabbit polyclonal antibody; RRID, Research Resource Identifier; VGluT1, vesicular glutamate transporter-1; VGluT2, vesicular glutamate transporter-2.
SI Materials and Methods
Animals.
GLAST-KO mice were produced originally on a mixed C57BL/6 × 129/Sv genetic background by homologous recombination as described previously (25). They were backcrossed to the C57BL/6 background more than 10 generations. Heterozygous pairs were mated to obtain GLAST-KO and control littermates. For each qualitative and quantitative analysis, three mutant and control male mice were used unless otherwise noted. Two months of age were examined as adult mice. GLT-1 KO and control littermates were obtained by mating pairs of heterozygous GLT-1 mutant mice (47) and used for morphological analysis at P21. For electrophysiological analysis, C57BL/6 mice were used. Animal experiments were performed according to the guidelines for the care and use of laboratory animals of the Hokkaido University Graduate School of Medicine.
Antibodies.
We used primary antibodies against calbindin, GFAP, GFP, GLAST, GLT-1, GluD2, VGluT1, and VGluT2. Information on antigen sequences, host species, specificity, and Research Resource Identifiers, as well as references for each primary antibody are summarized in Table S1.
Sections.
Under deep pentobarbital anesthesia (150 mg/kg body weight, i.p.), mice for light microscopic analysis were perfused transcardially with 4% paraformaldehyde in 0.1 M sodium phosphate buffer (pH 7.2), and those for immunoelectron microscopy were perfused with 4% paraformaldehyde/0.1% glutaraldehyde in 0.1 M sodium phosphate buffer. Parasagittal or horizontal cerebellar sections were prepared on a microslicer (50 µm in thickness; VT1000S, Leica). For conventional electron microscopy, mice were perfused with 2% paraformaldehyde/2% glutaraldehyde in 0.1 M sodium cacodylate buffer (pH 7.2). Microslicer sections (400 µm) were postfixed with 1% osmium tetroxide in 0.1 M cacodylate buffer for 1 h, dehydrated in a graded alcohol series, and embedded in Epon 812 for the preparation of ultrathin sections (70 nm), using an Ultracut ultramicrotome (Leica).
Genotyping.
The genotype of GLAST-KO mice was determined by PCR using a mixture of four primers (5ʹ-aagtgcctatccagtccaacga-3ʹ, 5ʹ-aagaactctctcagcgcttgcc-3ʹ, 5ʹ-aatggaaggattggagctacgg-3ʹ, and 5ʹ-ttccagttgaaggctcctgtgg-3ʹ), yielding DNA fragments of 214 and 362 base pairs for the control and mutant alleles, respectively.
Immunofluorescence.
All immunofluorescence incubations were performed at room temperature in a free-floating state. Cerebellar sections were incubated successively with 10% normal donkey serum for 20 min, a mixture of primary antibodies (0.5–1 µg/mL) overnight, and a mixture of Alexa Fluor 488-labeled, Cy3-labeled, and Cy5-labeled species-specific secondary antibodies for 2 h at a dilution of 1:200 (Jackson Immunoresearch or Invitrogen). Images were taken with a confocal laser scanning microscope (FV1000 or FV1200, Olympus). To avoid crosstalk between multiple fluorophores, Alexa Fluor 488, Cy3, and Cy5 fluorescence signals were acquired sequentially using the 488-nm, 543-nm, and 633-nm excitation lines. Single optical sections were obtained (640 × 640 pixels; pixel size, 110 nm). Fluorescence images were acquired on a fluorescence microscope (BZ-9000, Keyence) equipped with a CFI Plan Apo λ (20×/0.20) objective lens. Images were analyzed with Metamorph software (Universal Imaging Corp.). Dendritic translocation of CFs was evaluated by measuring the distance from the base of the molecular layer to the tips of VGluT2-positive CF terminals and the thickness of the molecular layer. All data were presented as the mean ± SEM. Statistical significance was evaluated by Mann–Whitney U test unless otherwise indicated.
Immunoelectron Microscopy.
Postembedding immunogold labeling was performed as described previously (37). Ultrathin sections were prepared using Lowicryl HM20 (Lowi) embedding medium, and incubated with rabbit GLT-1 antibody (20 µg/mL) or rabbit GluD2 antibody (5 µg/mL), and then with 10-nm colloidal gold-conjugated anti-rabbit IgG (1:100; British Bio Cell International). For double labeling, rabbit VGluT1 antibody was directly conjugated to colloidal gold (15 nm in diameter) according to a method previously described (37). Images were taken with an electron microscope; H7100 (Hitachi) or JEM 1400 (JEOL).
Anterograde Tracer Labeling.
As previously described (17), CFs were selectively visualized by injecting biotinylated dextran amine (BDA; 3,000 molecular weight; Invitrogen) or dextran Alexa 594 (DA594, Invitrogen) into the inferior olive. For multiple fluorescence labeling, DA594-labeled microslicer sections were immunolabeled with calbindin and VGluT2 antibodies. For electron microscopy, BDA-labeled microslicer sections were incubated with VGluT2 antibody. Immunogold for VGluT2 was silver-enhanced (Aurion), whereas BDA was visualized with 3,3ʹ-diaminobenzidine. Sections were postfixed with 1% osmium tetroxide for 15 min, dehydrated in graded alcohols, and embedded in Epon 812.
Elvax Implant.
As previously described (14), beads (100 mg) of ethylene-vinyl acetate copolymer (Elvax, DuPont) were dissolved in dichloromethane (100 mg/mL) and mixed with 20 µL DMSO containing 2% Fast green and 20 µL of a 5- or 50-µM solution of PMB-TBOA, a blocker of glial glutamate transporters (27–29). After stirring, the Elvax solution was plated on a glass dish, frozen quickly, kept at −70 °C for 1 h, and placed at −20 °C for 12 h. For implantation, mice at P24 were anesthetized with sodium pentobarbital (20 mg/kg body weight, i.p.), the skin over the cerebellum was cut, and a small piece of the occipital bone and dura that covered the surface of cerebellar lobules 6–8 was removed. A piece of Elvax (4 × 4 mm) was placed over the opening, and the skin was sutured. For PMB-TBOA treatment, the piece of Elvax contained either 45 nmol (for 5 µM) or 450 nmol (for 50 µM) PMB-TBOA. After 7 d of treatment, mice were anesthetized and fixed by transcardial perfusion.
Viral Vector Preparation.
For the production of lentivirus expressing GFP, a mixture of the pCAGkGP1R, pCAG4RTR2, and pCAG-VSV-G vectors and pCL20c-GFP lentivector plasmids (kindly provided by K. Kobayashi, Fukushima Medical University, Fukushima, Japan) were cotransfected to human embryonic kidney 293T cells, using the calcium phosphate precipitation method. Then, 40 h after transfection, culture medium containing virus particles was filtered through 0.22-µm membranes and centrifuged at 6,000 × g for 8.5 h. Viral particles were finally suspended in DMEM. A 0.5-µL aliquot of the lentivirus solution (titer, 1.0 × 10⁷–8 TU/mL) was injected into the vermis of cerebellar lobules 6–7 by air pressure. Then, 2 wk later, mice were anesthetized and fixed by transcardial perfusion.
Electrophysiology.
Whole-cell recordings were made from visually identified PCs using an upright microscope (BX51WI; Olympus) at 31 °C. Patch pipettes had a resistance of 2–4 MΩ when filled with an internal solution composed of the following (in mM): 60 CsCl, 10 Cs d-gluconate, 20 TEA (tetraethylammonium)-Cl, 20 BAPTA, 4 MgCl2,4 ATP, 0.4 GTP, and 30 Hepes at pH 7.3, adjusted with CsOH. The pipette access resistance was compensated by 80%. The composition of the standard bathing solution was as follows (in mM): 125 NaCl, 2.5 KCl, 2 CaCl2, 1 MgSO4, 1.25 NaH2PO4, 26 NaHCO3, and 20 glucose, bubbled with 95% O2 and 5% CO2. Bicuculline methochloride (10 µM; Tocris Bioscience) was added to the bath solution for blocking inhibitory synaptic transmission. PMB-TBOA was prepared as described previously (27–29). For the PMB-TBOA experiment, 3-[(r)-2-carboxypiperazin-4-yl]-propyl-1-phosphonic acid (Tocris) was added to block polysynaptic responses. All drugs were dissolved in distilled water or DMSO at a concentration of 1–10 mM. The final concentrations of the drugs indicated in the Results were obtained by diluting the stock solutions in the recording external solution. The final DMSO concentration was kept under 0.1%. All solutions containing drugs were bath applied at a rate of 2–3 mL/min, resulting in solution exchange within 2–3 min. Ionic currents were recorded with a patch-clamp amplifier (EPC10; HEKA). The signals were filtered at 2 kHz and digitized at 20 kHz. Online data acquisition and offline data analysis were performed using PULSE software (HEKA). Stimulation pipettes (5–10-µm tip diameter) were filled with standard saline and used to apply square pulses for focal stimulation (duration, 0.1 ms; amplitude, 0–90 V). Comparisons of two groups were performed using two-tailed Mann–Whitney U test. For three or more group comparisons, Kruskal–Wallis test with post hoc Dunn’s multiple pairwise comparison procedure was performed. Statistical significance was set at P < 0.05.
Acknowledgments
We thank Dr. Sho Kakizawa at Kyoto University for technical advice on the Elvax implant experiment and Prof. Kazuto Kobayashi at Fukushima Medical University for the kind gift of lentiviral vectors. This study was supported by Grants-in-Aid for Scientific Research from the Ministry of Education, Culture, Sports, Science and Technology of Japan (to M.W., 24220007; M.K., 25000015; T.M., 26460250; K.H., 25117006, 16H01615, 17H03551; and M. Yamasaki, 26460251), the Narishige Neuroscience Research Foundation (T.M.), the Takeda Science Foundation (T.M. and M. Yamasaki), the Naito Foundation (M. Yamasaki and M.W.), the Strategic Research Program for Brain Sciences from the Ministry of Education, Culture, Sports, Science and Technology of Japan and Japan Agency for Medical Research and Development (AMED) (K.H.), and the Uehara Memorial Foundation (M.W.).
Footnotes
The authors declare no conflict of interest.
This article is a PNAS Direct Submission.
This article contains supporting information online at www.pnas.org/lookup/suppl/doi:10.1073/pnas.1617330114/-/DCSupplemental.
References
- 1.Palay S, Chan-Palay V. 1974. Cerebellar cortex: Cytology and organization (Springer, New York); pp 63–69, 242–287.
- 2.Sotelo C. Cellular and genetic regulation of the development of the cerebellar system. Prog Neurobiol. 2004;72:295–339. doi: 10.1016/j.pneurobio.2004.03.004. [DOI] [PubMed] [Google Scholar]
- 3.Watanabe M, Kano M. Climbing fiber synapse elimination in cerebellar Purkinje cells. Eur J Neurosci. 2011;34:1697–1710. doi: 10.1111/j.1460-9568.2011.07894.x. [DOI] [PubMed] [Google Scholar]
- 4.Kawamura Y, et al. Spike timing-dependent selective strengthening of single climbing fibre inputs to Purkinje cells during cerebellar development. Nat Commun. 2013;4:2732. doi: 10.1038/ncomms3732. [DOI] [PMC free article] [PubMed] [Google Scholar]
- 5.Hashimoto K, Kano M. Functional differentiation of multiple climbing fiber inputs during synapse elimination in the developing cerebellum. Neuron. 2003;38:785–796. doi: 10.1016/s0896-6273(03)00298-8. [DOI] [PubMed] [Google Scholar]
- 6.Carrillo J, Nishiyama N, Nishiyama H. Dendritic translocation establishes the winner in cerebellar climbing fiber synapse elimination. J Neurosci. 2013;33:7641–7653. doi: 10.1523/JNEUROSCI.4561-12.2013. [DOI] [PMC free article] [PubMed] [Google Scholar]
- 7.Hashimoto K, Ichikawa R, Kitamura K, Watanabe M, Kano M. Translocation of a “winner” climbing fiber to the Purkinje cell dendrite and subsequent elimination of “losers” from the soma in developing cerebellum. Neuron. 2009;63:106–118. doi: 10.1016/j.neuron.2009.06.008. [DOI] [PubMed] [Google Scholar]
- 8.Hashimoto K, et al. Postsynaptic P/Q-type Ca2+ channel in Purkinje cell mediates synaptic competition and elimination in developing cerebellum. Proc Natl Acad Sci USA. 2011;108:9987–9992. doi: 10.1073/pnas.1101488108. [DOI] [PMC free article] [PubMed] [Google Scholar]
- 9.Kashiwabuchi N, et al. Impairment of motor coordination, Purkinje cell synapse formation, and cerebellar long-term depression in GluR δ2 mutant mice. Cell. 1995;81:245–252. doi: 10.1016/0092-8674(95)90334-8. [DOI] [PubMed] [Google Scholar]
- 10.Matsuda K, Yuzaki M. Cbln1 and the δ2 glutamate receptor–an orphan ligand and an orphan receptor find their partners. Cerebellum. 2012;11:78–84. doi: 10.1007/s12311-010-0186-5. [DOI] [PubMed] [Google Scholar]
- 11.Uemura T, et al. Trans-synaptic interaction of GluRδ2 and Neurexin through Cbln1 mediates synapse formation in the cerebellum. Cell. 2010;141:1068–1079. doi: 10.1016/j.cell.2010.04.035. [DOI] [PubMed] [Google Scholar]
- 12.Hashimoto K, et al. Roles of glutamate receptor δ2 subunit (GluRδ2) and metabotropic glutamate receptor subtype 1 (mGluR1) in climbing fiber synapse elimination during postnatal cerebellar development. J Neurosci. 2001;21:9701–9712. doi: 10.1523/JNEUROSCI.21-24-09701.2001. [DOI] [PMC free article] [PubMed] [Google Scholar]
- 13.Ichise T, et al. mGluR1 in cerebellar Purkinje cells essential for long-term depression, synapse elimination, and motor coordination. Science. 2000;288:1832–1835. doi: 10.1126/science.288.5472.1832. [DOI] [PubMed] [Google Scholar]
- 14.Kakizawa S, Yamasaki M, Watanabe M, Kano M. Critical period for activity-dependent synapse elimination in developing cerebellum. J Neurosci. 2000;20:4954–4961. doi: 10.1523/JNEUROSCI.20-13-04954.2000. [DOI] [PMC free article] [PubMed] [Google Scholar]
- 15.Kano M, et al. Impaired synapse elimination during cerebellar development in PKC γ mutant mice. Cell. 1995;83:1223–1231. doi: 10.1016/0092-8674(95)90147-7. [DOI] [PubMed] [Google Scholar]
- 16.Kano M, et al. Persistent multiple climbing fiber innervation of cerebellar Purkinje cells in mice lacking mGluR1. Neuron. 1997;18:71–79. doi: 10.1016/s0896-6273(01)80047-7. [DOI] [PubMed] [Google Scholar]
- 17.Ichikawa R, et al. Territories of heterologous inputs onto Purkinje cell dendrites are segregated by mGluR1-dependent parallel fiber synapse elimination. Proc Natl Acad Sci USA. 2016;113:2282–2287. doi: 10.1073/pnas.1511513113. [DOI] [PMC free article] [PubMed] [Google Scholar]
- 18.Danbolt NC. Glutamate uptake. Prog Neurobiol. 2001;65:1–105. doi: 10.1016/s0301-0082(00)00067-8. [DOI] [PubMed] [Google Scholar]
- 19.Yamada K, et al. Dynamic transformation of Bergmann glial fibers proceeds in correlation with dendritic outgrowth and synapse formation of cerebellar Purkinje cells. J Comp Neurol. 2000;418:106–120. [PubMed] [Google Scholar]
- 20.Chaudhry FA, et al. Glutamate transporters in glial plasma membranes: Highly differentiated localizations revealed by quantitative ultrastructural immunocytochemistry. Neuron. 1995;15:711–720. doi: 10.1016/0896-6273(95)90158-2. [DOI] [PubMed] [Google Scholar]
- 21.Rothstein JD, et al. Localization of neuronal and glial glutamate transporters. Neuron. 1994;13:713–725. doi: 10.1016/0896-6273(94)90038-8. [DOI] [PubMed] [Google Scholar]
- 22.Barbour B, Keller BU, Llano I, Marty A. Prolonged presence of glutamate during excitatory synaptic transmission to cerebellar Purkinje cells. Neuron. 1994;12:1331–1343. doi: 10.1016/0896-6273(94)90448-0. [DOI] [PubMed] [Google Scholar]
- 23.Bergles DE, Dzubay JA, Jahr CE. Glutamate transporter currents in bergmann glial cells follow the time course of extrasynaptic glutamate. Proc Natl Acad Sci USA. 1997;94:14821–14825. doi: 10.1073/pnas.94.26.14821. [DOI] [PMC free article] [PubMed] [Google Scholar]
- 24.Takayasu Y, et al. Differential roles of glial and neuronal glutamate transporters in Purkinje cell synapses. J Neurosci. 2005;25:8788–8793. doi: 10.1523/JNEUROSCI.1020-05.2005. [DOI] [PMC free article] [PubMed] [Google Scholar]
- 25.Watase K, et al. Motor discoordination and increased susceptibility to cerebellar injury in GLAST mutant mice. Eur J Neurosci. 1998;10:976–988. doi: 10.1046/j.1460-9568.1998.00108.x. [DOI] [PubMed] [Google Scholar]
- 26.Perkins EM, et al. 2016. Posterior cerebellar Purkinje cells in an SCA5/SPARCA1 mouse model are especially vulnerable to the synergistic effect of loss of β-III spectrin and GLAST. Hum Mol Genet 2016;25:4448–4461.
- 27.Shimamoto K, et al. Characterization of novel L-threo-beta-benzyloxyaspartate derivatives, potent blockers of the glutamate transporters. Mol Pharmacol. 2004;65:1008–1015. doi: 10.1124/mol.65.4.1008. [DOI] [PubMed] [Google Scholar]
- 28.Takayasu Y, Iino M, Shimamoto K, Tanaka K, Ozawa S. Glial glutamate transporters maintain one-to-one relationship at the climbing fiber-Purkinje cell synapse by preventing glutamate spillover. J Neurosci. 2006;26:6563–6572. doi: 10.1523/JNEUROSCI.5342-05.2006. [DOI] [PMC free article] [PubMed] [Google Scholar]
- 29.Takatsuru Y, et al. Roles of glial glutamate transporters in shaping EPSCs at the climbing fiber-Purkinje cell synapses. Neurosci Res. 2006;54:140–148. doi: 10.1016/j.neures.2005.11.002. [DOI] [PubMed] [Google Scholar]
- 30.Altman J. Postnatal development of the cerebellar cortex in the rat. II. Phases in the maturation of Purkinje cells and of the molecular layer. J Comp Neurol. 1972;145:399–463. doi: 10.1002/cne.901450402. [DOI] [PubMed] [Google Scholar]
- 31.Iino M, et al. Glia-synapse interaction through Ca2+-permeable AMPA receptors in Bergmann glia. Science. 2001;292:926–929. doi: 10.1126/science.1058827. [DOI] [PubMed] [Google Scholar]
- 32.Saab AS, et al. Bergmann glial AMPA receptors are required for fine motor coordination. Science. 2012;337:749–753. doi: 10.1126/science.1221140. [DOI] [PubMed] [Google Scholar]
- 33.Yamazaki M, et al. TARPs γ-2 and γ-7 are essential for AMPA receptor expression in the cerebellum. Eur J Neurosci. 2010;31:2204–2220. doi: 10.1111/j.1460-9568.2010.07254.x. [DOI] [PubMed] [Google Scholar]
- 34.Nishiyama H, Fukaya M, Watanabe M, Linden DJ. Axonal motility and its modulation by activity are branch-type specific in the intact adult cerebellum. Neuron. 2007;56:472–487. doi: 10.1016/j.neuron.2007.09.010. [DOI] [PMC free article] [PubMed] [Google Scholar]
- 35.Hirai H, et al. Cbln1 is essential for synaptic integrity and plasticity in the cerebellum. Nat Neurosci. 2005;8:1534–1541. doi: 10.1038/nn1576. [DOI] [PubMed] [Google Scholar]
- 36.Landsend AS, et al. Differential localization of delta glutamate receptors in the rat cerebellum: Coexpression with AMPA receptors in parallel fiber-spine synapses and absence from climbing fiber-spine synapses. J Neurosci. 1997;17:834–842. doi: 10.1523/JNEUROSCI.17-02-00834.1997. [DOI] [PMC free article] [PubMed] [Google Scholar]
- 37.Yamasaki M, et al. Glutamate receptor δ2 is essential for input pathway-dependent regulation of synaptic AMPAR contents in cerebellar Purkinje cells. J Neurosci. 2011;31:3362–3374. doi: 10.1523/JNEUROSCI.5601-10.2011. [DOI] [PMC free article] [PubMed] [Google Scholar]
- 38.Nikkuni O, Takayasu Y, Iino M, Tanaka K, Ozawa S. Facilitated activation of metabotropic glutamate receptors in cerebellar Purkinje cells in glutamate transporter EAAT4-deficient mice. Neurosci Res. 2007;59:296–303. doi: 10.1016/j.neures.2007.07.006. [DOI] [PubMed] [Google Scholar]
- 39.Grosche J, et al. Microdomains for neuron-glia interaction: Parallel fiber signaling to Bergmann glial cells. Nat Neurosci. 1999;2:139–143. doi: 10.1038/5692. [DOI] [PubMed] [Google Scholar]
- 40.Tang CM, Dichter M, Morad M. Quisqualate activates a rapidly inactivating high conductance ionic channel in hippocampal neurons. Science. 1989;243:1474–1477. doi: 10.1126/science.2467378. [DOI] [PubMed] [Google Scholar]
- 41.Trussell LO, Fischbach GD. Glutamate receptor desensitization and its role in synaptic transmission. Neuron. 1989;3:209–218. doi: 10.1016/0896-6273(89)90034-2. [DOI] [PubMed] [Google Scholar]
- 42.Pellerin L, Magistretti PJ. Glutamate uptake into astrocytes stimulates aerobic glycolysis: A mechanism coupling neuronal activity to glucose utilization. Proc Natl Acad Sci USA. 1994;91:10625–10629. doi: 10.1073/pnas.91.22.10625. [DOI] [PMC free article] [PubMed] [Google Scholar]
- 43.Richards DA, et al. Glutamate induces the rapid formation of spine head protrusions in hippocampal slice cultures. Proc Natl Acad Sci USA. 2005;102:6166–6171. doi: 10.1073/pnas.0501881102. [DOI] [PMC free article] [PubMed] [Google Scholar]
- 44.Lippman JJ, Lordkipanidze T, Buell ME, Yoon SO, Dunaevsky A. Morphogenesis and regulation of Bergmann glial processes during Purkinje cell dendritic spine ensheathment and synaptogenesis. Glia. 2008;56:1463–1477. doi: 10.1002/glia.20712. [DOI] [PMC free article] [PubMed] [Google Scholar]
- 45.Ichikawa R, Sakimura K, Watanabe M. GluD2 Endows Parallel Fiber-Purkinje Cell Synapses with a High Regenerative Capacity. J Neurosci. 2016;36:4846–4858. doi: 10.1523/JNEUROSCI.0161-16.2016. [DOI] [PMC free article] [PubMed] [Google Scholar]
- 46.Van der Loos H, Woolsey TA. Somatosensory cortex: Structural alterations following early injury to sense organs. Science. 1973;179:395–398. doi: 10.1126/science.179.4071.395. [DOI] [PubMed] [Google Scholar]
- 47.Takasaki C, et al. Glutamate transporters regulate lesion-induced plasticity in the developing somatosensory cortex. J Neurosci. 2008;28:4995–5006. doi: 10.1523/JNEUROSCI.0861-08.2008. [DOI] [PMC free article] [PubMed] [Google Scholar]
- 48.Hannan AJ, et al. PLC-β1, activated via mGluRs, mediates activity-dependent differentiation in cerebral cortex. Nat Neurosci. 2001;4:282–288. doi: 10.1038/85132. [DOI] [PubMed] [Google Scholar]
- 49.Iwasato T, et al. Cortex-restricted disruption of NMDAR1 impairs neuronal patterns in the barrel cortex. Nature. 2000;406:726–731. doi: 10.1038/35021059. [DOI] [PMC free article] [PubMed] [Google Scholar]
- 50.Yamasaki M, et al. Opposing role of NMDA receptor GluN2B and GluN2D in somatosensory development and maturation. J Neurosci. 2014;34:11534–11548. doi: 10.1523/JNEUROSCI.1811-14.2014. [DOI] [PMC free article] [PubMed] [Google Scholar]


