Significance
Understanding selection dynamics over time is fundamental for predicting evolutionary potential. This is critical in long-lived organisms, particularly trees, which are at increased risk of mortality because of climate change-related drought and associated stresses. For ponderosa pine, we show rare direct empirical evidence of strong context-dependent fluctuating selection on growth rates over time: fast growth was selected for before a mountain pine beetle outbreak but against after the outbreak, when a growth–survival trade-off emerged. Our results provide insight into the mechanisms contributing to the maintenance of genetic diversity in a long-lived organism, and show that strong and fluctuating selection can contribute to the evolutionary potential of trees under climate change.
Keywords: fluctuating selection, growth–survival trade-offs, selection response, Pinus ponderosa, Dendroctonus ponderosae
Abstract
Long generation times limit species’ rapid evolution to changing environments. Trees provide critical global ecosystem services, but are under increasing risk of mortality because of climate change-mediated disturbances, such as insect outbreaks. The extent to which disturbance changes the dynamics and strength of selection is unknown, but has important implications on the evolutionary potential of tree populations. Using a 40-y-old Pinus ponderosa genetic experiment, we provide rare evidence of context-dependent fluctuating selection on growth rates over time in a long-lived species. Fast growth was selected at juvenile stages, whereas slow growth was selected at mature stages under strong herbivory caused by a mountain pine beetle (Dendroctonus ponderosae) outbreak. Such opposing forces led to no net evolutionary response over time, thus providing a mechanism for the maintenance of genetic diversity on growth rates. Greater survival to mountain pine beetle attack in slow-growing families reflected, in part, a host-based life-history trade-off. Contrary to expectations, genetic effects on tree survival were greatest at the peak of the outbreak and pointed to complex defense responses. Our results suggest that selection forces in tree populations may be more relevant than previously thought, and have implications for tree population responses to future environments and for tree breeding programs.
Understanding the dynamics of selection over time is fundamental for understanding life-history evolution (1) and predicting evolutionary change under climate change (2, 3). To date, such understanding is based almost exclusively on data for relatively short-lived species (4, 5), but virtually nonexistent for long-lived organisms, such as trees (ref. 6; but see ref. 7). Trees and forests provide critical ecological and commercial services, including impacts on global carbon cycles, species diversity, water quality, and climate regulation (8). Recent forest mortality (9, 10) highlights the importance of understanding how climate change and climate change-driven disturbances may impact forests (11, 12). Trees may live for hundreds of years and experience varying selection pressures associated with fluctuating climate (13), disturbance regimes (14), and biotic interactions (15), all of which may be magnified under climate change. The extent to which these events may change the strength and direction of selection and contribute to the maintenance of genetic diversity and evolutionary potential is unknown. Of special relevance are insect outbreaks, a biotic interaction expected to increase with climate change (16) but unaccounted for in models to predict the evolutionary potential of tree populations (17, 18).
Mountain pine beetle (MPB; Dendroctonus ponderosae Hopkins) is a native, irruptive forest insect in western North America that uses numerous Pinus species as hosts. Via pheromone-mediated mass attacks that overcome host defenses, the MPB kills the host in the process of reproducing and completing its life cycle (19). Attacks have the binary outcome of either a successful mass attack/dead tree or unsuccessful attack/surviving tree, and mechanisms of tolerance as common in other plant–herbivore systems (20) are not involved. MPB outbreaks have recently caused unprecedented mortality in pine forests (21) and have been linked to warming effects on insect development and increased drought stress of hosts (19). Evidence that tree-killing insect outbreaks exert strong selective pressures, potentially changing selection patterns in tree populations and their underlying basis, is rare. Such information is critical to evaluate the evolutionary potential of tree populations under climate change and increasing incidence of insect outbreaks (17).
How insect outbreaks affect selection is important because relative fitness contribution of phenotypic traits changes over time in response to environmental change (2) and ontogenetic development (22). Conflicting selection pressures during ontogeny are common and often arise because of trade-offs among traits (23, 24). For example, growth rate has clear fitness benefits but also incurs intrinsic and extrinsic costs (23, 25). In trees, fast growth rates and large size may provide fitness benefits via increased competitive ability, faster time to reproduction, and increased chances of early survival (26). Fast growth rates are particularly important during early, vulnerable ontogenetic stages when rapid growth minimizes exposure time to mortality agents and suppression by neighbors, and allows a size advantage to monopolize resources (27). However, consistent with results in animals (28), fast early growth in trees has been associated with shorter lifespan (29), with long-term consequences on lifetime reproductive output. Thus, selection pressures for fast growth at early life stages may conflict with fitness costs at later stages (29, 30). These conflicts may explain the substantial intraspecific genetic variation in growth rates observed both within and among natural populations of organisms (23).
Another potential cost of fast growth is decreased defense against consumers (31, 32). Growth-defense trade-offs could contribute to changes in magnitude or even reversals of directional selection over a tree’s lifespan, depending on the intensity and timing of herbivory (6). For example, tree-killing pests can exert strong selective pressures favoring better-defended (33), slower-growing trees (30), and dampen or reverse directional selection for fast growth. Therefore, earlier selection for fast growth but later context-dependent selection for slow growth could contribute to the maintenance of genetic diversity in growth rates (1, 23). Understanding such pressures and their consequences on selection requires following growth dynamics over the entire lifespan of the organisms in question and its consequences on fitness; such data are rarely available for long-lived woody plants (34).
We took advantage of an existing common garden genetic experiment of ponderosa pine (Pinus ponderosa Lawson and C. Lawson var. ponderosa C. Lawson) that was impacted by a MPB outbreak when the trees were approximately 40 y old. We asked the following main question: Does strong herbivory pressure caused by an insect outbreak at the mature stage change the strength and direction of selection on growth rates relative to that in juvenile stages? We also asked: Does this change arise because of a growth–survival trade-off? Defenses against MPB are critical when beetle populations are low to moderate, but their role is thought to decrease at the epidemic stage when mass attacks can overwhelm even well-defended individuals (35). Although resistance to bark beetles is under genetic control (33, 36), it is not known whether genetic effects on tree resistance change during the course of the outbreak. Therefore, we also tested if these effects change over the outbreak. We hypothesized positive selection for fast growth at juvenile stages, but negative selection under strong herbivory pressure at mature stages as a result of a growth–survival trade-off. We also hypothesized stronger genetic effects on tree resistance earlier during the outbreak relative to the peak of the outbreak, when the overwhelming effect of mass attacks at high MPB pressure may render defenses irrelevant.
Results
Survival Over Time.
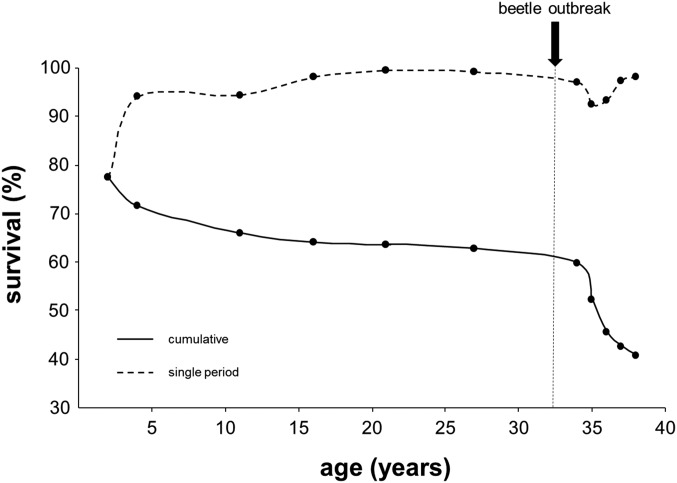
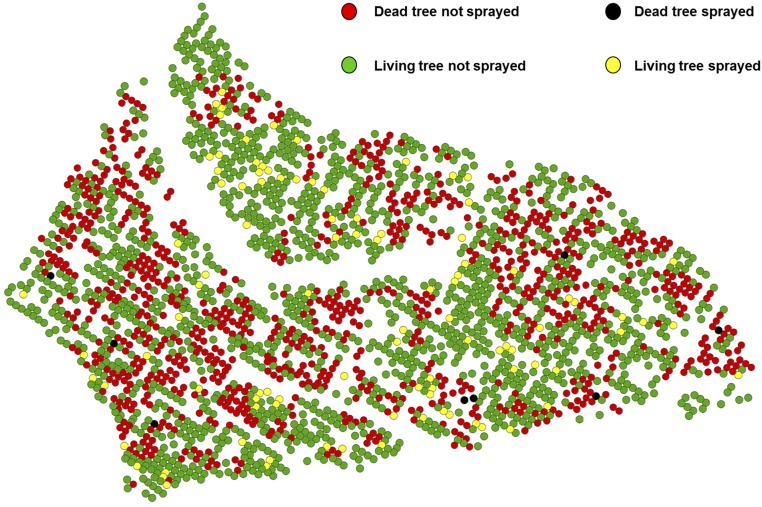
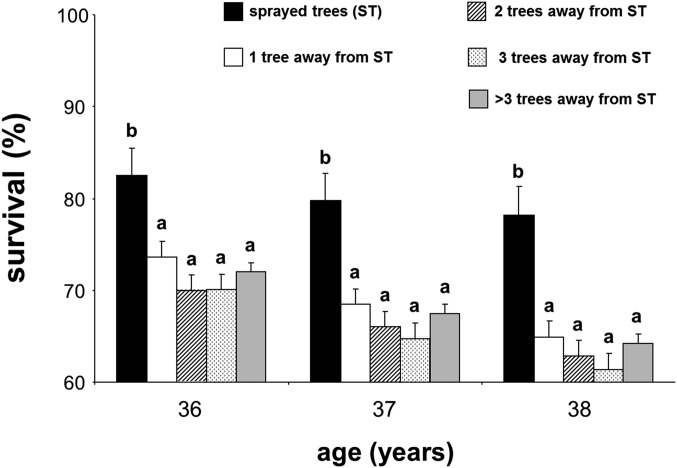
Overall survival 38 y after planting was 41%. Sixty-three percent of trees planted survived before the outbreak, with 64% of those surviving the outbreak (Fig. S1). Before the outbreak, survival was lowest up to age 2 y (78%) and progressively increased to ≥97% for each interval after age 11 y. During the outbreak, survival was lowest at ages 35 and 36 y (85% of the living trees each year) (Fig. S1). At age 36 y, 106 elite trees (identified based on superior growth at age 27 y) were sprayed with insecticide for protection against the MPB. Sprayed trees exhibited much higher survival (93%) compared with background survival (64%; P < 0.05) (SI Text). However, spraying effects were only significant on target sprayed trees and not surrounding trees (SI Text and Figs. S2–S4), and patterns of heritability of survival (see below) did not change after deleting these trees from the analyses (SI Text and Fig. S5).
Fig. S1.
Survival at each period and cumulative survival during the entire study.
Fig. S2.
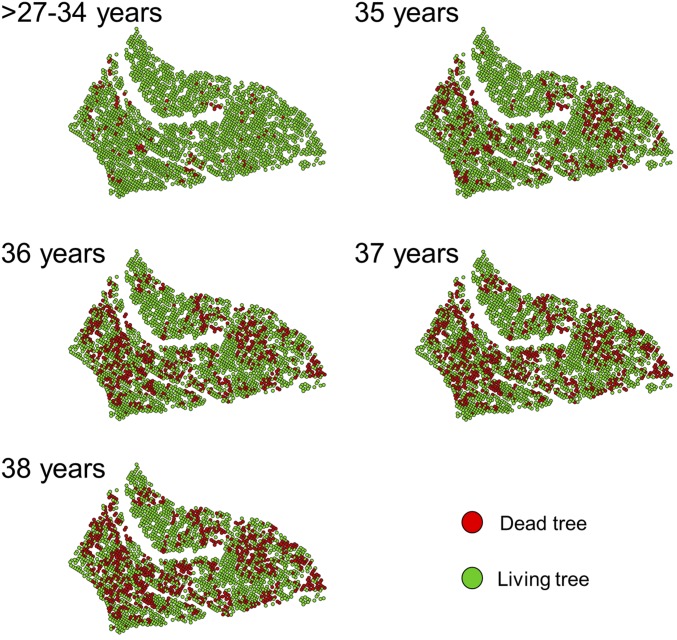
Spatial distribution of 106 trees sprayed with insecticide at age 36 y and beetle-induced mortality at age 38 y.
Fig. S4.
Probability of cumulative survival to the mountain pine beetle after the insecticide spraying for: sprayed trees and trees located one, two, three, and more than three trees away from sprayed trees. Within each age, different letters indicate significant differences among distance groups from targeted sprayed trees.
Fig. S5.
Individual heritability of survival to the mountain pine beetle outbreak. Data are for (A) the cumulative survival during the outbreak and (B) for each single year. Solid lines are the original results including all trees (as in Fig. 5 C and D, respectively) and the dashed lines after removing the insecticide sprayed trees.
The MPB Outbreak Reversed Patterns of Selection.
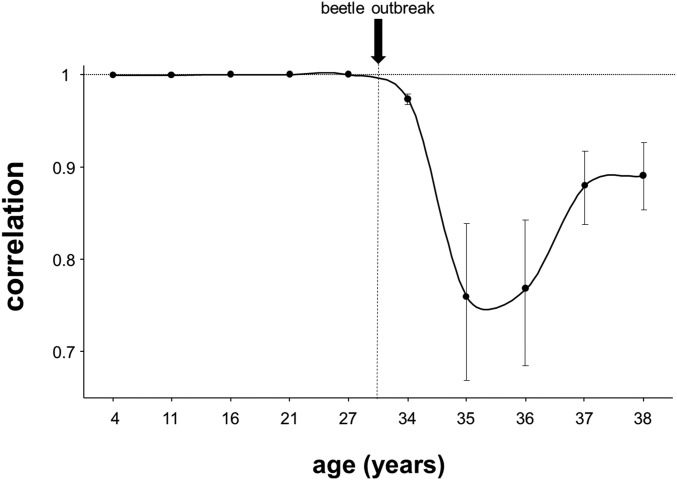
The MPB outbreak strongly changed the survival ranking of families relative to before the outbreak [significant genotype by environment (G×E) interaction; χ2 for log-likelihood comparison between full and restricted model: P < 0.001]. On average, family survival rank changed 76 positions (of the 204 families in total) from before to after the outbreak (Fig. 1), with two extreme cases where family rank changed 192 and 189 positions (Fig. 1). Before the outbreak, genetic correlations between survival at a given sampling age and survival at the previous sampling age were almost equal to one (Fig. S6). Therefore, families most likely to survive in a specific year were also most likely to survive the following year. In contrast, at the onset of the outbreak (from age 34 y) genetic correlations decreased significantly, particularly from ages 34–36 y, indicating a change in the genetic patterns of mortality (the MPB started to kill trees from families that did not necessarily exhibit low survival before the outbreak). Note that we used cumulative survival, so that potential changes in the genetic correlations between two successive sampling ages are only because of the killed trees between both ages. Given that after age 2 y survival rates were above 92% between every two successive ages (Fig. S1), small reductions in the genetic correlations indicate significant changes in the genetic patterns of survival.
Fig. 1.
Family survival rank before and after beetle outbreak for 204 families (lower rank means higher survival). Family ranks were estimated based on survival 27 y after planting (before) and by accounting mortality during the outbreak (after). In bold are drastic rank changes of two families.
Fig. S6.
Genetic correlations between cumulative survival at a given age and that at the previous sampling age. The dashed horizontal line is the theoretical upper threshold for correlations. Bars are 95% credibility intervals (CI). Note that all of the correlations are highly different from 0.
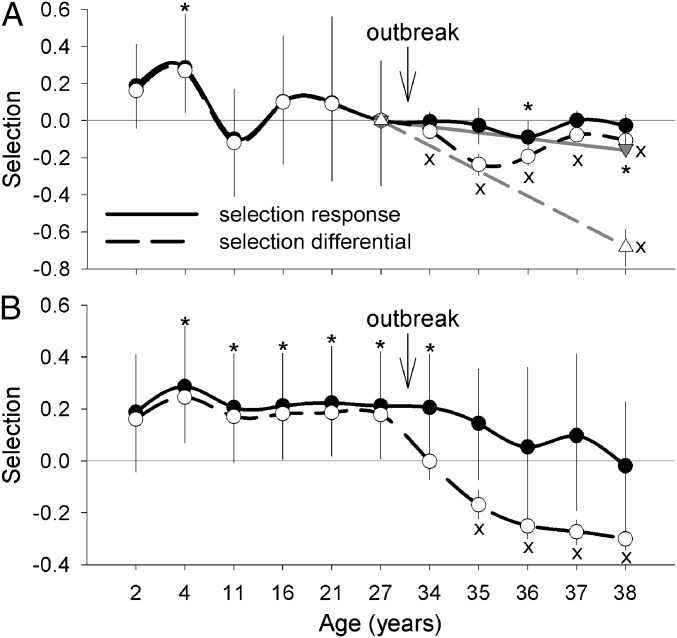
The MPB outbreak caused a switch in selection patterns on intrinsic growth potential [measured as diameter at breast height (DBH) at age 27 to prevent confounding growth responses to reduced competition because of MPB-caused mortality]. Although a positive genetic response to selection in growth rate occurred before the outbreak from age 2–4 y, the genetic response was negative from age 35–36 y, the period of highest mortality during the outbreak (Fig. 2A and Fig. S1). The negative selection during the outbreak was one-third of the positive selection at early stages, but it became stronger when the entire outbreak was considered a single selection event (Fig. 2A). Similarly, cumulative responses were positive during most of the MPB-free period but became nonsignificant after age 34 y, indicating no evolutionary response in the long term (Fig. 2B). Despite the positive genetic response before the outbreak, phenotypic selection differentials were not statistically different from zero, regardless of whether they were calculated on a period-by-period basis or on a cumulative basis (Fig. 2). However, from the onset of the outbreak yearly selection differentials were significantly negative (i.e., preferential selection of slow-growing phenotypes), causing cumulative differentials to also become negative from age 35 y and later. When the outbreak was considered a single selection event, the selection differential was significant and was larger than that at any period before the outbreak (Fig. 2A). This finding indicates a strong environmental effect on strength and direction of selection during the outbreak.
Fig. 2.
Responses to selection and selection differentials over time for intrinsic growth potential (diameter at age 27 y) based on (A) fitness (survival) at each sampling time (black lines, closed and open circles, respectively) and considering the outbreak as a single period (gray lines, closed and open triangles, respectively) and (B) cumulative fitness. Bars are 95% credibility intervals (for clarity, credibility intervals before the outbreak are only shown for responses to selection). An asterisk (*) denotes significant selection responses; an “x” denotes significant selection differentials.
A Growth–Survival Trade-Off Emerged During the MPB Outbreak.
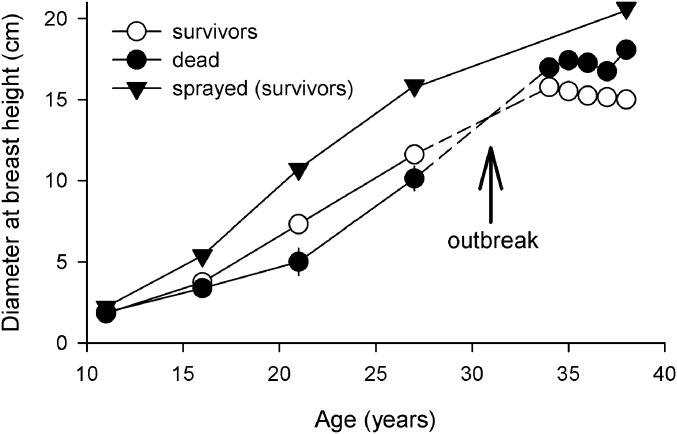
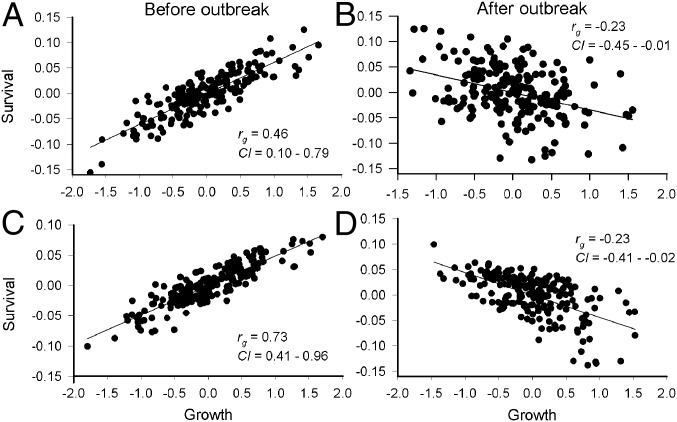
Before the outbreak, surviving trees were larger than trees that died, whereas the reverse was true after the outbreak (Fig. 3). However, sprayed trees (a subset of faster growing trees) exhibited faster growth both before and after the outbreak, indicating that when MPB was excluded, fast growth was not selected against during the outbreak (actual selection estimates within sprayed trees were not possible because of small sample size). Consistently, faster growing families exhibited greater survival before the outbreak (significant positive genetic correlation between survival at the end of the MPB-free period and growth potential) (Fig. 4A), but lower survival after the outbreak (significant negative genetic correlation) (Fig. 4B), indicating a growth–survival trade-off. The pattern before the outbreak was driven by positive genetic correlations from ages 0–2 and 2–4 y (Fig. 4C and Fig. S7), whereas that after the onset of the outbreak was driven by a negative genetic correlation from ages 35–36 y (Fig. 4D and Fig. S7), the period with highest survival heritability (Fig. 5D).
Fig. 3.
Mean diameter of surviving and dead trees over time and of a subset of surviving fast growing (elite) trees treated by insecticide. Preoutbreak surviving trees grew faster than trees that died. The reverse was true postoutbreak. When beetles were excluded in elite trees, fast growth was not selected against and 93% survived. Thus, selection against larger trees in the overall population was beetle-driven. Bars are SEs (often smaller than symbols). Mean diameters postoutbreak are from age 27 y after accounting for mortality. Dashed lines between ages 27 and 34 y illustrate that different sets of trees survive and die pre- and postoutbreak.
Fig. 4.
Genetic correlations between intrinsic growth potential (DBH, age 27 y) and (A) cumulative survival preoutbreak (age 27 y), (B) at the end of the outbreak (age 38 y; only the live-tree pool at age 27 y was considered), and survival from ages (C) 2–4 (preoutbreak) and (D) 35–36 y (during the beetle outbreak). Intervals from ages 2–4 y and 35–36 y were chosen based on most significant genetic correlations (Fig. S7). Data points represent best linear unbiased predictors for 204 open-pollinated pine families. Regression lines, bivariate genetic correlation coefficients (rg), and 95% credibility intervals (CI) shown.
Fig. S7.
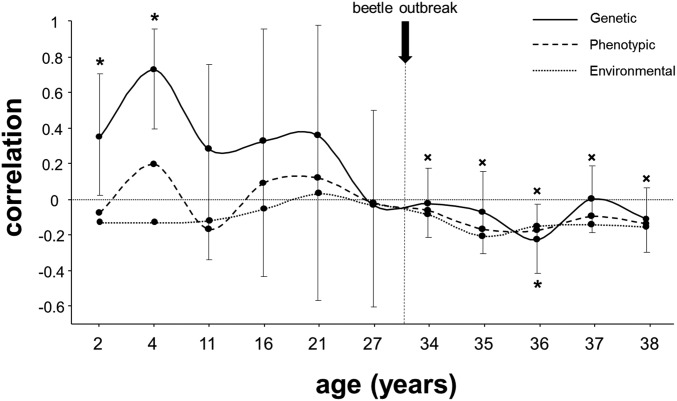
Genetic, phenotypic and environmental correlations between intrinsic growth potential (DBH, age 27 y) and survival at successive periods over time. Bars are 95% credibility intervals shown only for genetic correlations. An asterisk (*) denotes significant genetic correlations (0 value not included in credibility interval); an “x” denotes significant phenotypic and environmental correlations.
Fig. 5.
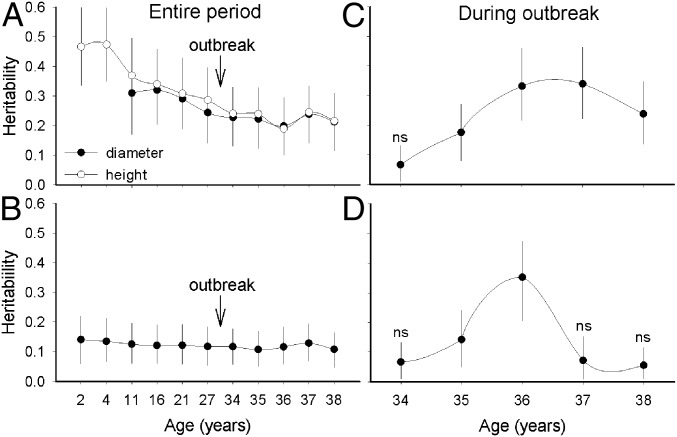
Individual heritability of: (A) growth rates measured as diameter and height over entire period, (B) cumulative survival over entire period, and (C) cumulative survival and (D) survival at each age postoutbreak (live-tree pool only). Bars are 95% credibility intervals. Heritabilities are all significant except when “ns” is noted (“0” value not included in the credibility interval). Heritability for growth traits after the beetle outbreak (A) were estimated based on age 27 y and accounting for mortality thereafter.
Genetic Effects Were Strongest at the Peak of the Outbreak but Were Delayed.
Heritability estimates for growth since planting were low to moderate (hi2 = 0.19–0.47) and tended to decrease with time, with the largest decrease during the first years of life (between ages 4 and 11 y) and stabilizing thereafter (Fig. 5A). Heritability for survival since planting was consistently lower than for growth (hi2 = 0.11–0.14) (Fig. 5B). The genetic effect on survival to MPB attack (i.e., resistance) measured at age 34–38 y was much stronger than that on survival over the entire period. Individual heritabilities for cumulative survival during the outbreak were always significant after age 34 y, with estimates starting at low values at age 34 y (hi2 = 0.07) and reaching a maximum at age 37 y (hi2 = 0.34) (Fig. 5C). On an annual basis during the outbreak, the genetic effect on beetle resistance varied over time, and became significant at ages 35 and 36 y, coinciding with maximum estimated heritability of 0.35 at age 36 y (Fig. 5D).
Discussion
High genetic diversity and strong selection are critical for the evolutionary potential of populations of long-lived species, where long generation times limit rapid evolutionary change. We provide direct evidence of fluctuating selection during ontogeny in P. ponderosa, a long-lived species. Fast growth was selected during juvenile stages, but slow growth was selected under intense herbivory pressure by a MPB outbreak at mature stages (34 to 38 y old; i.e., growth–survival trade-off). Such opposing selection led to no net evolutionary response of growth rates, thus contributing to the maintenance of genetic diversity of this trait. Our data suggest that the growth–survival trade-off during the outbreak was not solely driven by MPB’s preference for larger, resource-rich phenotypes at the epidemic stage (even when well-defended), but it likely reflected an intrinsic host-based life-history trade-off. In contrast to our prediction, strong genetic differentiation in survival to the MPB was delayed and occurred the second year of highest mortality, pointing to complex resistance responses under genetic control. The evolutionary consequences of selective events driven by biotic interactions are relevant under climate change, given the expected increase of insect pests and pathogens (16).
Three lines of evidence support that fluctuating selection was caused by novel environmental conditions imposed by intense herbivory pressure as a result of the MPB outbreak. First, family survival rankings changed significantly from before to the end of the outbreak (Fig. 1). Second, genetic correlations between survival rates at successive sampling periods indicate that at the onset of the outbreak the MPB started to target families that were more likely to survive in the absence of intense herbivory (Fig. S6). Third, when MPB was excluded by insecticide spraying, fast growth was not selected against (Fig. 3). These results support classic accounts of selection in natural populations as a result of biotic interactions, often modulated by abiotic factors (2, 37).
Growth rates have fitness consequences and selection is expected (23). Indeed, we found significant genetic responses to selection on growth rates, but importantly, these responses changed in direction and strength over time (Fig. 2A). Fast growth was positively selected before the outbreak, but negatively selected during the outbreak, clearly showing that intense herbivory shifted selection patterns. Fast growth in trees under competitive environments is critical for light acquisition and resource capture, and slow growth is selected against and underrepresented at mature stages (27). Consistently, selection for fast growth was strongest during early seedling establishment when density-dependent mortality in trees typically occurs (38) and when the proportion of seeds that attain maturity is usually very small (6). The MPB outbreak, however, caused significant selection differentials in the opposite direction (positive selection for slow-growing phenotypes), which triggered a negative genetic response after the outbreak (Fig. 2A). Our results are consistent with studies showing that fast early growth within tree species correlates with decreased longevity (29) and increased herbivory at maturity (30), and provide strong empirical evidence of the conflicting effects of growth rates on fitness during ontogeny.
Importantly, growth potential did not experience a net evolutionary response at the end of the sampling period (Fig. 2B), and even though the negative genetic response caused by the outbreak was noticeably smaller than the positive response at juvenile stages, it was strong enough to counteract the expected positive selection for fast growth in trees. Thus, positive and negative selection responses (1) reduced the cumulative effects of selection, clearly illustrating the importance of assessing selection over time (4).
Directional selection is expected to reduce genetic variability. The decrease in heritability for growth over time (Fig. 5A) suggests this occurred to some degree. However, the reduction was stronger at earlier stages when genetic response to selection for fast growth was strongest, but dampened thereafter. This and the negligible net response to selection clearly indicate that in natural populations subjected to fluctuating and often unpredictable selection pressures, consequences of growth rates are highly context-dependent, thus leading to fluctuating selection and the maintenance of genetic variation (4, 22, 39).
Trees show high intrapopulation genetic diversity relative to other plant species (40), which contributes to their evolutionary potential (18). However, increased potential for microevolution in trees contrasts with slow macroevolutionary rates (6). The current most-favored explanation for this paradox is that selection is not a major driver of genetic diversity (41). In nonsessile organisms, selection has been shown to contribute very little to phenotypic changes over time and changing climate (42). Our results, in contrast, suggest that selection in trees (long-lived sessile organisms) may be more relevant than previously thought and that the accumulation of context-dependent fluctuating, episodic, and opposing selection forces over time contribute to the maintenance of genetic diversity within populations (43). Such diversity is critical to buffer changes in selective pressures as a result of environmental variation over the extended lifespan of trees (18), and likely contributes to their evolutionary success (6).
As the MPB population increases to the epidemic stage, host defenses are more easily overwhelmed and allow beetles to behaviorally switch from weakened, stressed trees toward larger, resource-rich hosts, even if such hosts are better defended (35). This behavioral switch is consistent with the plant-vigor hypothesis, posing that more vigorous, highly nutritious hosts are preferred by insects (44). Consistently, we found that the MPB clearly preferred larger trees (Fig. 3), despite the fact that larger trees at our site have higher resin duct defenses and slightly higher resin flow (45). Negative genetic correlations are often interpreted as evidence of intrinsic life-history trade-offs (46). However, because faster growing families have larger hosts on average, and at the epidemic stage beetles switch preference for larger hosts regardless of defenses, the growth–survival trade-off we found could be entirely driven by the MPB behavioral switch rather than reflect a host-based life-history trade-off (31, 32). However, two lines of evidence suggest that the growth–survival trade-off we found reflects in part a host-based life-history trade-off. First, despite the significant environmental effect caused by the MPB behavior switch (Fig. S7), a significant negative genetic correlation between growth and survival was superimposed (and somewhat stronger) at age 36 y during the peak of the outbreak. Therefore, MPB not only targeted larger phenotypes, but trees from faster growing families. Second, such effect was not driven by a depletion of large hosts in slower-growing families during the first year of high mortality (age 35 y) (Fig. S8). Note also that survival to the MBP outbreak at our site was quite high (64%), likely leaving suitable hosts in all families where variability in growth rates (size) is high. Furthermore, our results are conservative because original selected mothers were vigorous trees, thus likely limiting the range of growth rates. To the extent that mortality during the outbreak was exclusively caused by the beetle, the host-based growth–survival trade-off most likely reflects a growth–resistance trade-off. Unfortunately, however, we lack direct data on defenses during the outbreak (which cannot be obtained in this retrospective study; see below) and we cannot unambiguously demonstrate a growth–resistance trade-off.
Fig. S8.
Depletion effect. At epidemic stages the MPB exhibits a behavioral switch and targets larger, better quality individuals (see main text). We explored whether a depletion effect could have driven the genetic correlation between growth and survival we document. That is, that at age 35 y, the first year of high mortality, the MPB preference for larger trees caused a depletion of large trees in slow-growing families (with lower proportions of large trees), thus driving beetles to preferentially target larger trees in faster-growing families the subsequent year (at age 36 y). To be conservative, we selected trees in high spatial susceptibility areas (highest 25% spatial susceptibility ranking; see Fig. S11) and divided trees into three classes of families: fast- (mean DBH > 16.5 cm), medium- (mean DBH between 15 and 16.5 cm), and slow-growing families (mean DBH < than 15 cm). Consistent with the negative genetic correlation between growth and survival at age 36, the number (A) and percent (B) of killed trees by the MPB at age 36 y decreased significantly in the slowest growing families. If such strong effect was driven by a depletion of large hosts at age 35 y, we would have also expected a strong decrease of the mean diameter of available hosts in the slowest growing families at age 36 y. However, this was not the case: the substantial reduction of killed trees in the slowest growing families was not matched by a significant decrease of mean diameter, which occurred only at the end of the outbreak when overall survival was 64% (C). Asterisks (***) indicate differences (P < 0.001) between the three groups of families at any given age. Different letters indicate significant differences between ages for every type of families. ns, not significant.
Consistent with previous results in Pinus species (33, 36), we found high genetic differentiation in survival (resistance) during the outbreak (Fig. 5C). However, genetic effects varied strongly and unexpectedly over time: they were insignificant early and late in the outbreak (Fig. 5D), but very strong at the peak of the outbreak (at age 36 y, the second consecutive year of highest mortality; approximately 15% for both years). Such a delayed genetic effect is interesting but difficult to interpret with the available data. We suggest it may relate to delayed induced defense responses (47). Induced defenses are critical during bark beetle outbreaks (35), are under genetic control (48) and, importantly, often show a trade-off with constitutive defenses (49). Therefore, higher constitutive defenses in faster growing trees and families at our site (45, 50) may be associated with lower induced defenses. If induced defenses play a predominant role during an outbreak (22), such reductions could offset the constitutive defense advantage in faster growing families, thus leading to higher mortality during the outbreak. Our results point to a delayed induction effect (i.e., at age 36 y). Although the underlying mechanisms remain unclear, induced chemical defenses in pines have been shown to increase with MPB density (35), and it could be that the strong induction effect at age 36 y was a response to high MPB densities following high tree mortality and brood production at age 35 y.
Conclusions: Implications Under Climate Change and for Management
We provide empirical evidence of fluctuating selection in a long-lived sessile organism as a context-dependent mechanism for the maintenance of genetic diversity. High within-population genetic diversity in long-lived species, including trees, is critical to buffer stochastic selective events, such as severe droughts and insect outbreaks, the frequency and intensity of which is expected to increase with climate change (51). Clearly, the evolutionary consequences of such events will depend not only on the direction and relative strength of selection and whether they trigger a net evolutionary change, but also on the size of the surviving population, which in the case of MPB outbreaks depends on the degree of mortality of adults and any regeneration/offspring that occurred before the outbreak.
Our results also have important management implications. Tree improvement programs supply seed resources for managed tree plantations, and for restoration purposes after natural and human-caused disturbances (e.g., fire, severe drought, and reclamation). These programs have traditionally focused on selection on growth-related traits (52), although efforts to breed for tree resistance against insects and pathogens are currently in place (53). Our results indicate that the traditional focus on fast-growth by tree breeding programs may reduce survival under intense, unpredictable stress (54). High pest and disease incidence in agricultural crops (55) and production forests (56), combined with biotic and abiotic stresses associated with climate change, call for a greater effort in tree breeding programs to maintain genetic diversity and to support the adaptive potential of planted forests subjected to a variety of current and future threats (18).
Materials and Methods
Study Site and Data Collection.
The study was conducted in a P. ponderosa common garden half-sibling genetic trial planted at the University of Montana’s Lubrecht Experimental Forest in western Montana (46.8874° N, 113.4753° W) by the Inland Empire Tree Improvement Cooperative (IETIC). Seeds were collected from 204 open-pollinated, unrelated, wild mother trees phenotypically selected for superior growth and form in 44 natural stands in western Montana and northern Idaho, and reared at the US Department of Agriculture Forest Service tree nursery in Coeur d’Alene, Idaho. One-year-old bare-root seedlings were planted in 1974 on 3 × 3-m spacing using a randomized complete block design with four-tree family-row plots in each of five blocks for a total of 20 trees per family (4,025 trees in total). Additional planting of containerized 2-y-old seedlings occurred in 1975 to replace mortality during the first year. Site mean annual air temperature is 7 °C and mean annual precipitation is 500 mm, with 44% falling as snow.
A MPB outbreak began in the region during the mid-2000s, when trees were 27 y old, and reached peak mortality in 2009 and 2010 at the site when trees were 35 and 36 y old (trees are fully reproductive at this age). IETIC applied the broad spectrum insecticide Carbaryl (Sevin) to 106 elite trees with superior form and growth performance in 2010 to minimize MPB-caused mortality. We accounted for insecticide effects in our analyses (Statistical Analyses).
Growth and survival were surveyed six times at ages 2, 4, 11, 16, 21, and 27 y. Total height was measured at ages 2 and 4 y, when height and DBH (1.4 m above ground) were measured at subsequent ages. No MPB-caused mortality was documented through age 27 y.
In June 2013, we mapped each tree using a submetric accuracy GPS device (Trimble Geo HX). For each tree, we determined live or dead status and whether death occurred before 2001 (before the outbreak) or after. MPB-killed trees were mass attacked and identified based on abundant resin pitch tubes. We retrospectively determined the approximate year of successful attack (>2001–2008, 2009, 2010, 2011, 2012) based on needle presence and color, and twig and bark characteristics (Table S1). We assumed year of death was 1 y following attack. This was corroborated by cross-dating increment cores collected from a subsample of about 200 trees using dendrochronological techniques (50) and by checking trees mass-attacked the year of sampling and still green the following year to corroborate their death. A 100% match was found with our estimates of death. Mortality after age 27 y (2001) was exclusively a result of MPB; therefore, survival after beetle attack was used both as a proxy of fitness when coupled with survival in previous years and as a proxy of tree resistance during the outbreak by including only live trees.
Table S1.
Symptomatic scale used to retrospectively determine the year of successful attack by the MPB
| Age of successful attack, y | Symptoms in needles, twigs, and bark |
| 38 | Green needles and fresh pitch tubes |
| 37 | Bright orange needles with the majority of needles still on tree |
| 36 | Still some orange needles but loss of a significant fraction of them relative to unattacked trees |
| 35 | Some gray needles and some bark in upper branches sloughing off |
| >27–34 | No needles, and some fine branches and most bark on the upper portion of the bole had sloughed off |
The scale was based on apparent visual traits in needles, twigs, and bark. Every successfully attacked tree showed numerous pitch tubes along the bole.
Statistical Analyses.
Spatial heterogeneity and autocorrelation as a result of microsite conditions is common for growth-related traits. Spatial autocorrelation is further exacerbated by MPB because beetles emerging from attacked trees are more likely to attack neighboring living trees (57). Therefore, probability of MPB attack in a given year is influenced by both tree resistance and abundance of attacked trees in the neighborhood. We used geostatistical techniques (SAS Institute 9.2) to account for spatial autocorrelation when estimating genetic parameters of growth and tree resistance to MPB. We used a continuous distribution for growth (58) and a binary distribution for survival (59). In both cases, we modeled the trait variance as a function of distance (semivariogram) and fitted semivariograms were then used for Kriging interpolation. Kriging estimates were used to adjust the original data for spatial autocorrelation (SI Text, Figs. S9–S11, and Table S2).
Fig. S9.
Spatial distribution of survival at different ages throughout the MPB outbreak.
Fig. S11.
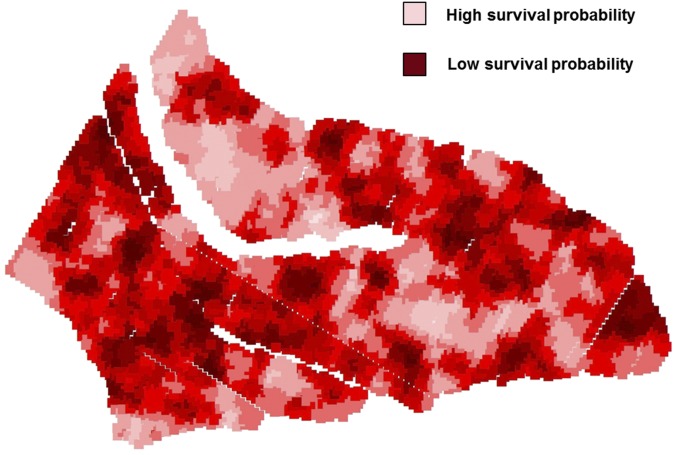
Spatial distribution of the probability of survival to the MPB outbreak (i.e., kriging map; inverse of the spatial susceptibility) at age 38 y.
Table S2.
Parameters characterizing the spatial patterns of height and DBH before the MPB outbreak and of survival after MPB outbreak, adjusted for family effects and derived from the exponential theoretical semivariograms
| Trait | Age, y | C | C0 | a0, m | R2 | Intensity, % | Patch size, m |
| Height | 4 | 0.007 | 0.050 | 11.5 | 0.83 | 12.5 | 34.5 |
| 11 | 0.013 | 0.073 | 9.4 | 0.82 | 15.0 | 28.3 | |
| 16 | 0.142 | 0.608 | 13.7 | 0.95 | 18.9 | 41.1 | |
| 21 | 0.272 | 1.234 | 12.2 | 0.95 | 18.0 | 36.6 | |
| 27 | 0.361 | 1.933 | 16.3 | 0.96 | 15.7 | 48.9 | |
| DBH | 11 | —* | — | — | — | — | — |
| 16 | 1.311 | 8.796 | 17.3 | 0.97 | 13.0 | 51.9 | |
| 21 | 1.868 | 13.600 | 17.8 | 0.95 | 12.1 | 53.4 | |
| 27 | 2.300 | 18.690 | 21.7 | 0.94 | 11.0 | 65.1 | |
| Survival | >27–34 | 0.008 | 0.037 | 11.9 | 0.65 | 18.5 | 35.7 |
| 35 | 0.039 | 0.096 | 8.9 | 0.90 | 28.7 | 26.6 | |
| 36 | 0.071 | 0.115 | 6.4 | 0.96 | 38.2 | 19.3 | |
| 37 | 0.087 | 0.117 | 6.7 | 0.97 | 42.6 | 20.1 | |
| 38 | 0.088 | 0.128 | 9.0 | 0.97 | 40.7 | 27.1 |
The patch variance (C) is the spatially structured variance; the nugget (C0) or intercept at distance zero, represents the variance because of sampling error or spatial dependence at scales not explicitly sampled; range (a0) is the distance at which the plateau begins (the size of homogeneous patches); R2 represents the goodness-of-fit of the theoretical semivariogram; the intensity of the pattern indicates the fraction of the total variance accounted for by the model [(C0/(C0 + C)) × 100]; the patch size (meters) indicates the distance below which data are autocorrelated and shows the scale of the pattern (for exponential semivariograms: 3 × a0).
Spatially independent.
“Animal models” fitted with MCMCglmm package (60) in R 3.2 (R Development Core Team, 2013) were used for quantitative genetic analyses, which implement Bayesian generalized linear models with Markov-chain Monte Carlo (MCMC) methods. These models included the genetic random effect (“animal”) and the fixed-block effect from the experimental design. We set up a pedigree matrix where pine families were assumed to be true half-siblings belonging to same cohort. We estimated additive genetic, environmental, and phenotypic variances in univariate analyses, and additive genetic, environmental, and phenotypic covariances and correlations in bivariate analyses (SI Text).
Individual heritability (hi2) for survival and growth traits was estimated as the ratio of additive genetic variance to total phenotypic variance. For binary traits, an overdispersion term was added and set to Π2/3. Height and DBH hi2 during the outbreak were estimated based on measurements at age 27 y and removing killed trees as the outbreak progressed.
We considered two different periods or environmental contexts: before and after the MPB outbreak. First, to assess genetic patterns of selection over time, we studied the G×E interaction for survival as a measure of change in the fitness genetic landscape caused by MPB. We used survival at age 27 y (last measurement before MPB attack) and at the end of the outbreak (by considering only the live-tree pool) as representatives of the MPB-free environment and the environment during the outbreak, respectively. The significance of the G×E interaction was tested using a log-likelihood ratio test comparing the full model with a reduced model, where the G×E variance was constrained to “0.” To determine the specific time of potential changes in the genetic patterns of selection we used bivariate Bayesian models (see discussion of animal models, above) to estimate genetic correlations between survival at a given sampling age and survival at the previous sampling age.
Bivariate animal models were used to estimate phenotypic and additive genetic covariance between fitness and growth. DBH at age 27 y was used as a proxy for intrinsic growth potential (trees were the same age) to prevent confounding growth effects because of competition release from MPB-caused mortality. We fitted bivariate Bayesian models (see discussion of animal models, above) between relative fitness (by dividing individual survival by the overall mean survival of all trees) and standardized intrinsic growth potential. Responses to selection following Price (61) were computed as the additive genetic covariance between standardized growth potential and relative fitness. Selection differentials were estimated as the phenotypic covariance between standardized growth potential and relative fitness. To assess net effects of selection up to each age and its dynamics over time, we estimated selection responses and differentials at each age based on cumulative survival and survival each year.
Growth–survival trade-offs were assessed from genetic, phenotypic, and environmental correlations fitting bivariate Bayesian models (see discussion of animal models, above) between intrinsic growth potential (DBH at age 27 y) and survival at each sampling period, and also at ages 27 y (overall correlation before the outbreak) and at the end of the outbreak, excluding trees killed before age 27 y (overall correlation during the outbreak). Because mortality after age 27 y was exclusively because of MPB, a negative growth–survival genetic correlation indicates a growth–survival trade-off.
Because individuals from a given family were planted in four-tree family-row plots, insecticide effects on neighbors could have confounded genetic effects. We tested whether the insecticide application on 106 trees in 2010 affected our results by including this as a fixed factor in the quantitative genetic model (see discussion of animal models, above). We considered five groups of trees potentially affected by the insecticide application: targeted sprayed trees and trees one, two, three, and more than three trees away from sprayed trees, respectively. Post hoc comparisons indicated that the insecticide affected survival of the target trees only (SI Text). We then deleted the trees affected by the insecticide from the analysis and re-estimated genetic variances and heritabilities. The number of trees sprayed was too small to allow meaningful estimates of selection (only 106 trees were sprayed).
SI Text
Accounting for the Insecticide Effect.
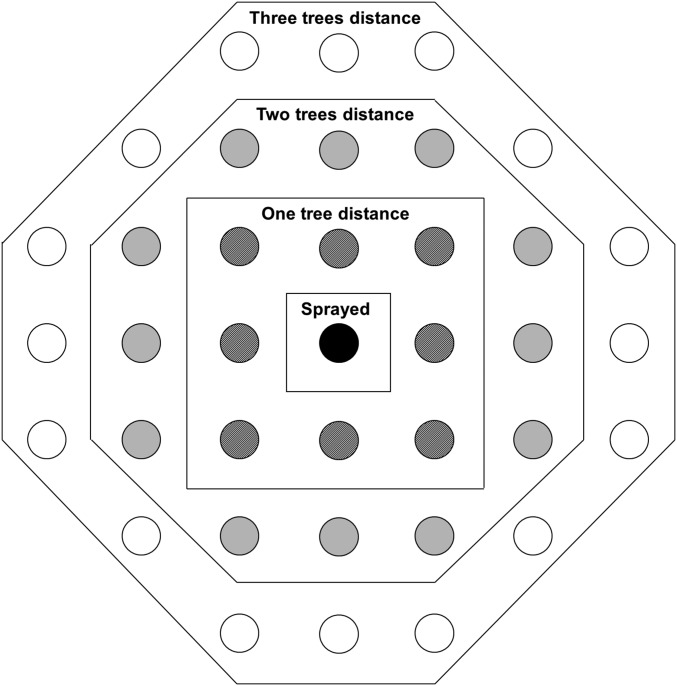
One-hundred six elite trees (trees selected for breeding purposes based on superior growth) were sprayed at age 36 y with Carbaryl (Fig. S2), thus conferring them artificial resistance to the MPB. This spraying effect could therefore potentially confound genetic effects of tree resistance and growth–survival trade-offs. To test for this effect in target sprayed trees and their neighbors, we included an insecticide effect in the quantitative model (Quantitative Genetic Analyses: Animal Models) as a fixed factor that took into account the distance to the sprayed trees. This effect included five groups: sprayed trees and trees at incremental distances of one, two, three, and more than three trees away from the sprayed trees (Fig. S3). We then deleted all trees significantly affected by the insecticide from the analysis to re-estimate the genetic variances and heritability.
Fig. S3.
Diagram illustrating the clustering criterion based on the distance from a targeted insecticide-sprayed tree (black dot) to test the range of influence of the insecticide effect on the 3- × 3-m grid.
Insecticide spraying had a significant effect on survival for every year after the spraying, such that sprayed trees had higher survival, as expected. This effect was confined to the sprayed trees and neighbors were not affected (Fig. S4). When sprayed trees were eliminated from the analyses, the patterns of genetic effects on survival and on heritability estimations did not change relative to when all trees were included (Fig. S5). Therefore, the insecticide effect did not affect the results.
Spatial Analysis: Accounting for the Spatial Autocorrelation of Growth and Beetle Attack.
When spatial heterogeneity is present, near neighbors are more similar than far neighbors: that is, data are autocorrelated and the requirement of data independence in standard parametric statistics is violated. This affects both the estimation of genetic parameters and comparisons among genotypes in genetic trials (58).
Among the approaches to account for spatial autocorrelation, geostatistics has shown promising results both in agricultural and forest experiments (58). Basically, geostatistics consists of two steps: variography and kriging. Variography uses variograms to model the variation as a function of the distance. Thereafter, variograms are used for interpolation by the kriging method, which provides optimal, smooth, and unbiased varying surfaces of values on a spatial grid. The kriging estimates can then be used to adjust the original data for spatial autocorrelation (58).
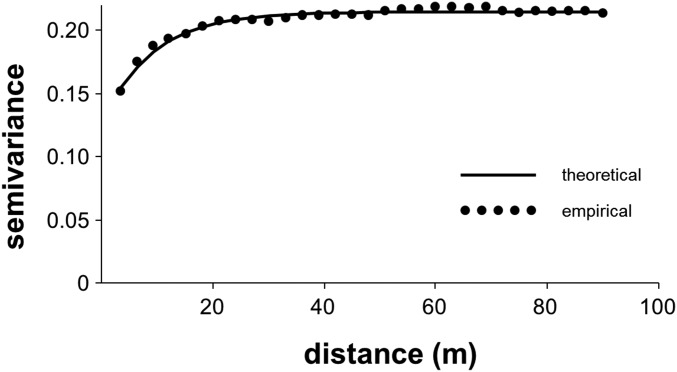
To account for the infectious pattern of beetle attack (Fig. S9), we implemented a methodology similar to that used by Zas et al. (59). For this, we analyzed trees that were alive at age 27 y, but later subjected to the MPB outbreak. Residuals of tree survival after the MPB attack at different ages over the outbreak (>27–34, 35, 36, 37, and 38 y) were analyzed to explore changes in spatial heterogeneity of MPB mortality as the outbreak developed. Family best-linear unbiased predictors (Blups) of survival were calculated using the Glimmix procedure of SAS v9.2 (SAS Institute), assuming a binomial probability distribution and a logit link function. Predicted Blups were subtracted from each individual observation of the family member. The spatial structure of the resulting residuals was analyzed using semivariography, and semivariograms were constructed using the Variogram procedure in SAS 9.2. Best models were fitted as theoretical semivariograms to the experimental semivariograms using the NLIN procedure in SAS 9.2, and obtaining the model parameters. Survival to the MPB attack showed strong spatially structured patterns as expected (Fig. S10 and Table S2), with the intensity of the spatial pattern increasing as the outbreak proceeded.
Fig. S10.
Empirical and fitted theoretical semivariograms for survival to the MPB outbreak at age 38 y.
Thereafter, fitted models were used to partition the variation of survival residuals into spatially autocorrelated variation and random error with the kriging method. Kriging computes surfaces of Blups of values based on the spatial structure defined by the theoretical semivariogram. In this case, the surface was interpreted as the spatial distribution of the probability of survival of trees to MPB (inverse of the spatial susceptibility to beetle attack) (Fig. S11). Because being alive in a free MPB attack patch has different implications than being alive in a high-risk infection zone, original survival values were corrected by subtracting the kriging estimate at each tree location to account for the spatial autocorrelation. This new variable varies between 1 (very resistant: live tree in a completely attacked patch) and −1 (very susceptible; dead tree in a completely MPB-free attack patch) and was considered a proxy for resistance to the MPB. The kriging analysis was performed using the Krige2d SAS procedure.
We further assessed the spatial pattern of tree survival before the MPB attack at different ages (2, 4, 11, 16, 21, and 27 y) by using the same methodology as before. Results showed that mortality before the beetle attack was spatially independent at every age (intensity of spatial pattern < 1%).
We also examined the spatial pattern of the DBH and height before the beetle outbreak, which were used as indicators of growth potential (Materials and Methods). Growth traits showed spatial autocorrelation at most of the ages (Table S2), and thereby they were corrected using an iterative spatial analysis method (58) similar to the one used for the binary variables of tree mortality based on semivariography and kriging. A main difference is that, after the original variable was adjusted for its spatial autocorrelation, the new corrected variable was reanalyzed, and a new estimate of the family effects was obtained and used to generate new residuals. The process was repeated iteratively, until convergence of the estimated family Blups (see refs. 58 and 59 for a detailed description of both methods).
Quantitative Genetic Analyses: Animal Models.
To estimate additive genetic, environmental, and phenotypic variances, covariances, and correlations we fitted univariate and multivariate animal models (60). Animal models are a type of generalized linear mixed-effects model (GLMM) that use the information from all pedigree relationships to specify the expected phenotypic resemblance between relatives. It has several advantages, including its power to separate environmental from genetic sources of resemblance between relatives, its applicability to unbalanced sampling designs, and its robustness to departures from distributional assumptions (62). In these models, pairwise coefficients of kinship estimated from pedigree data define a matrix proportional to the variance–covariance structure of additive genetic random effects. We set up a pedigree matrix where pine families were assumed to be true half-siblings belonging to same cohort with unrelated parents.
Models were fitted using Bayesian methods implemented in MCMCglmm package (R 3.2, R Development Core Team, 2013) including MCMC methods. We included in the models the genetic random effect (“animal”) and the fixed-block effect from the experimental design.
For univariate models, survival during the outbreak was strongly spatially autocorrelated (Spatial Analysis, above). Subsequent spatial correction of survival resulted in a continuous variable. Therefore, survival during the outbreak and growth over the entire lifespan followed a normal distribution and were analyzed using a Gaussian error structure. Several priors were tested to finally retain the least-informative one, leading to proper posterior distributions for variance parameters in the Bayesian models. For Gaussian distributions, we used weak priors: variance and covariance parameters were set to 0.5 and the degree of belief (ν) to 2. Before the outbreak, survival was not spatially autocorrelated (Spatial Analysis, above); therefore, no spatial correction was necessary. To estimate genetic parameters of the binary traits, we fitted models with binomial error structure (family “categorical”). Residual variance cannot be calculated for binary traits, and therefore it was fixed to 1. In binomial models, we used moderately informative priors: variance parameters were set to 1 (and covariances to 0) and the degree of belief (ν) to 10.
We also fitted bivariate models between pairs of traits (survival vs. survival or survival vs. growth) with random-effect and residual unstructured covariance matrices (allowing different variances across the traits and covariances to exist between them). When both traits were normally distributed we used same priors as for univariate Gaussian analyses. When at least one trait of the two was binary, we used same priors as for univariate binomial models, fixing the residual variance of binary traits to 1.
Parameter estimates reported here are means from the posterior distribution with 95% lower and upper credible intervals. For all models we ran MCMC-chains for 5,050,000 iterations. To ensure that the chain mixed well and that subsequent samples were independent, we increased the default burn-in period to 50,000 and the thinning interval to 1,000. Traces were visually inspected to confirm convergence. For consistency, we compared estimations from Bayesian models with restricted maximum-likelihood estimation models implemented in Proc mixed, Proc Glimmix, and bivariate models in SAS software. Estimations from both methods were highly consistent and we only show the ones from Bayesian models.
Acknowledgments
We thank Alexandra Ginter, Gilia Patterson, Katie Arledge, and Jordi Martinez-Vilalta for field support; Marc Rust for Inland Empire Tree Improvement Cooperative data through 2001; and Rafael Zas, David Coltman, Thomas Martin, Lila Fishman, and two anonymous reviewers for thoughtful comments. The Barrié Foundation provided postdoctoral support to R.d.l.M. Research funds were provided by McIntire-Stennis Cooperative Forestry Research Grant MONZ-1206 (College of Forestry and Conservation, University of Montana).
Footnotes
The authors declare no conflict of interest.
This article is a PNAS Direct Submission.
Data deposition: The data reported in this paper have been deposited in the US Forest Service Research Data Archive (https://doi.org/10.2737/RDS-2017-0026).
This article contains supporting information online at www.pnas.org/lookup/suppl/doi:10.1073/pnas.1700032114/-/DCSupplemental.
References
- 1.Schluter D, Price TD, Rowe L. Conflicting selection pressures and life history trade-offs. Philos T R Soc B. 1991;246:11–17. [Google Scholar]
- 2.Grant PR, Grant BR. Unpredictable evolution in a 30-year study of Darwin’s finches. Science. 2002;296:707–711. doi: 10.1126/science.1070315. [DOI] [PubMed] [Google Scholar]
- 3.Hoffmann AA, Sgrò CM. Climate change and evolutionary adaptation. Nature. 2011;470:479–485. doi: 10.1038/nature09670. [DOI] [PubMed] [Google Scholar]
- 4.Siepielski AM, DiBattista JD, Carlson SM. It’s about time: The temporal dynamics of phenotypic selection in the wild. Ecol Lett. 2009;12:1261–1276. doi: 10.1111/j.1461-0248.2009.01381.x. [DOI] [PubMed] [Google Scholar]
- 5.Kingsolver JG, Diamond SE. Phenotypic selection in natural populations: what limits directional selection? Am Nat. 2011;177:346–357. doi: 10.1086/658341. [DOI] [PubMed] [Google Scholar]
- 6.Petit RJ, Hampe A. Some evolutionary consequences of being a tree. Annu Rev Ecol Evol Syst. 2006;37:187–214. [Google Scholar]
- 7.Alía R, Chambel R, Notivol E, Climent J, González-Martínez SC. Environment-dependent microevolution in a Mediterranean pine (Pinus pinaster Aiton) BMC Evol Biol. 2014;14:200. doi: 10.1186/s12862-014-0200-5. [DOI] [PMC free article] [PubMed] [Google Scholar]
- 8.Franklin J, Serra-Diaz JM, Syphard AD, Regan HM. Global change and terrestrial plant community dynamics. Proc Natl Acad Sci USA. 2016;113:3725–3734. doi: 10.1073/pnas.1519911113. [DOI] [PMC free article] [PubMed] [Google Scholar]
- 9.Hansen MC, et al. High-resolution global maps of 21st-century forest cover change. Science. 2013;342:850–853. doi: 10.1126/science.1244693. [DOI] [PubMed] [Google Scholar]
- 10.Allen CD, Breshears DD, McDowell NG. On underestimation of global vulnerability to tree mortality and forest die-off from hotter drought in the Anthropocene. Ecosphere. 2015;6:art129. [Google Scholar]
- 11.Seidl R, Spies TA, Peterson DL, Stephens SL, Hicke JA. Searching for resilience: Addressing the impacts of changing disturbance regimes on forest ecosystem services. J Appl Ecol. 2016;53:120–129. doi: 10.1111/1365-2664.12511. [DOI] [PMC free article] [PubMed] [Google Scholar]
- 12.Speer JH, Swetnam TW, Wickman BE, Youngblood A. Changes in pandora moth outbreak dynamics during the past 622 years. Ecology. 2001;82:679–697. [Google Scholar]
- 13.Gutschick VP, BassiriRad H. Extreme events as shaping physiology, ecology, and evolution of plants: Toward a unified definition and evaluation of their consequences. New Phytol. 2003;160:21–42. doi: 10.1046/j.1469-8137.2003.00866.x. [DOI] [PubMed] [Google Scholar]
- 14.Sousa WP. The role of disturbance in natural communities. Annu Rev Ecol Syst. 1984;15:353–391. [Google Scholar]
- 15.Boege K, Marquis RJ. Facing herbivory as you grow up: The ontogeny of resistance in plants. Trends Ecol Evol. 2005;20:441–448. doi: 10.1016/j.tree.2005.05.001. [DOI] [PubMed] [Google Scholar]
- 16.Anderegg WRL, et al. Tree mortality from drought, insects, and their interactions in a changing climate. New Phytol. 2015;208:674–683. doi: 10.1111/nph.13477. [DOI] [PubMed] [Google Scholar]
- 17.Aitken SN, Yeaman S, Holliday JA, Wang T, Curtis-McLane S. Adaptation, migration or extirpation: Climate change outcomes for tree populations. Evol Appl. 2008;1:95–111. doi: 10.1111/j.1752-4571.2007.00013.x. [DOI] [PMC free article] [PubMed] [Google Scholar]
- 18.Alberto FJ, et al. Potential for evolutionary responses to climate change—Evidence from tree populations. Glob Change Biol. 2013;19:1645–1661. doi: 10.1111/gcb.12181. [DOI] [PMC free article] [PubMed] [Google Scholar]
- 19.Raffa KF, et al. Cross-scale drivers of natural disturbances prone to anthropogenic amplification: The dynamics of bark beetle eruptions. Bioscience. 2008;58:501–517. [Google Scholar]
- 20.Stowe KA, Marquis RJ, Hochwender CG, Simms EL. The evolutionary ecology of tolerance to consumer damage. Annu Rev Ecol Syst. 2000;31:565–595. [Google Scholar]
- 21.Meddens AJH, Hicke JA, Ferguson CA. Spatiotemporal patterns of observed bark beetle-caused tree mortality in British Columbia and the western United States. Ecol Appl. 2012;22:1876–1891. doi: 10.1890/11-1785.1. [DOI] [PubMed] [Google Scholar]
- 22.Monro K, Marshall DJ. Faster is not always better: Selection on growth rate fluctuates across life history and environments. Am Nat. 2014;183:798–809. doi: 10.1086/676006. [DOI] [PubMed] [Google Scholar]
- 23.Arendt JD. Adaptive intrinsic growth rates: An integration across taxa. Q Rev Biol. 1997;72:149–177. [Google Scholar]
- 24.Boege K, Dirzo R, Siemens D, Brown P. Ontogenetic switches from plant resistance to tolerance: Minimizing costs with age? Ecol Lett. 2007;10:177–187. doi: 10.1111/j.1461-0248.2006.01012.x. [DOI] [PubMed] [Google Scholar]
- 25.Mangel M, Stamps J. Trade-offs between growth and mortality and the maintenance of individual variation in growth. Evol Ecol Res. 2001;3:583–593. [Google Scholar]
- 26.Lanner RM. Why do trees live so long? Ageing Res Rev. 2002;1:653–671. doi: 10.1016/s1568-1637(02)00025-9. [DOI] [PubMed] [Google Scholar]
- 27.Landis RM, Peart DR. Early performance predicts canopy attainment across life histories in subalpine forest trees. Ecology. 2005;86:63–72. [Google Scholar]
- 28.Lee W-S, Monaghan P, Metcalfe NB. Experimental demonstration of the growth rate–lifespan trade-off. Philos T R Soc B. 2013;280:20122370. doi: 10.1098/rspb.2012.2370. [DOI] [PMC free article] [PubMed] [Google Scholar]
- 29.Bigler C, Veblen TT. Increased early growth rates decrease longevities of conifers in subalpine forests. Oikos. 2009;118:1130–1138. [Google Scholar]
- 30.Ruel J, Whitham TG. Fast-growing juvenile pinyons suffer greater herbivory when mature. Ecology. 2002;83:2691–2699. [Google Scholar]
- 31.Coley PD, Bryant JP, Chapin FS., 3rd Resource availability and plant antiherbivore defense. Science. 1985;230:895–899. doi: 10.1126/science.230.4728.895. [DOI] [PubMed] [Google Scholar]
- 32.Herms DA, Mattson WJ. The dilemma of plants: To grow or defend. Q Rev Biol. 1992;67:283–335. [Google Scholar]
- 33.Strom BL, Goyer RA, Ingram LL, Boyd GDL, Lott LH. Oleoresin characteristics of progeny of loblolly pines that escaped attack by the southern pine beetle. For Ecol Manage. 2002;158:169–178. [Google Scholar]
- 34.Doak DF. Lifetime impacts of herbivory for a perennial plant. Ecology. 1992;73:2086–2099. [Google Scholar]
- 35.Boone CK, Aukema BH, Bohlmann J, Carroll AL, Raffa KF. Efficacy of tree defense physiology varies with bark beetle population density: A basis for positive feedback in eruptive species. Can J Res. 2011;41:1174–1188. [Google Scholar]
- 36.Yanchuk AD, Murphy JC, Wallin KF. Evaluation of genetic variation of attack and resistance in lodgepole pine in the early stages of a mountain pine beetle outbreak. Tree Genet Genomes. 2008;4:171–180. [Google Scholar]
- 37.Bell G. Fluctuating selection: The perpetual renewal of adaptation in variable environments. Philos Trans R Soc Lond B Biol Sci. 2010;365:87–97. doi: 10.1098/rstb.2009.0150. [DOI] [PMC free article] [PubMed] [Google Scholar]
- 38.Dodd ME, Silvertown J. Size-specific fecundity and the influence of lifetime size variation upon effective population size in Abies balsamea. Heredity (Edinb) 2000;85:604–609. doi: 10.1046/j.1365-2540.2000.00822.x. [DOI] [PubMed] [Google Scholar]
- 39.Dmitriew CM. The evolution of growth trajectories: What limits growth rate? Biol Rev Camb Philos Soc. 2011;86:97–116. doi: 10.1111/j.1469-185X.2010.00136.x. [DOI] [PubMed] [Google Scholar]
- 40.Hamrick JL, Godt M. Effects of life history traits on genetic diversity in plant species. Philos T R Soc B. 1996;351:1291–1298. [Google Scholar]
- 41.Scotti I, González-Martínez SC, Budde KB, Lalagüe H. Fifty years of genetic studies: What to make of the large amounts of variation found within populations? Ann Sci. 2016;73:69–75. [Google Scholar]
- 42.Ozgul A, et al. The dynamics of phenotypic change and the shrinking sheep of St. Kilda. Science. 2009;325:464–467. doi: 10.1126/science.1173668. [DOI] [PMC free article] [PubMed] [Google Scholar]
- 43.Takahata N, Ishii K, Matsuda H. Effect of temporal fluctuation of selection coefficient on gene frequency in a population. Proc Natl Acad Sci USA. 1975;72:4541–4545. doi: 10.1073/pnas.72.11.4541. [DOI] [PMC free article] [PubMed] [Google Scholar]
- 44.Price PW. The plant vigor hypothesis and herbivore attack. Oikos. 1991;62:244–251. [Google Scholar]
- 45.Hood S, Sala A. Ponderosa pine resin defenses and growth: Metrics matter. Tree Physiol. 2015;35:1223–1235. doi: 10.1093/treephys/tpv098. [DOI] [PubMed] [Google Scholar]
- 46.Agrawal AA, Conner JK, Rasmann S. Tradeoffs and negative correlations in evolutionary ecology. In: Bell M, Eanes W, Futuyma D, Levinton J, editors. Evolution Since Darwin: The First 150 Years. Sinauer Associates; Sunderland, MA: 2010. pp. 243–268. [Google Scholar]
- 47.Haukioja E, Suomela J, Neuvonen S. Long-term inducible resistance in birch foliage: Triggering cues and efficacy on a defoliator. Oecologia. 1985;65:363–369. doi: 10.1007/BF00378910. [DOI] [PubMed] [Google Scholar]
- 48.Franceschi VR, Krokene P, Christiansen E, Krekling T. Anatomical and chemical defenses of conifer bark against bark beetles and other pests. New Phytol. 2005;167:353–375. doi: 10.1111/j.1469-8137.2005.01436.x. [DOI] [PubMed] [Google Scholar]
- 49.Moreira X, et al. Trade-offs between constitutive and induced defences drive geographical and climatic clines in pine chemical defences. Ecol Lett. 2014;17:537–546. doi: 10.1111/ele.12253. [DOI] [PubMed] [Google Scholar]
- 50.Pinnell S. 2016. Resin duct defenses in ponderosa pine during a mountain pine beetle outbreak: Genetic effects, mortality, and relationships with growth. Masters thesis (University of Montana, Missoula, MT)
- 51.Kolb TE, et al. Observed and anticipated impacts of drought on forest insects and diseases in the United States. For Ecol Manage. 2016;380:321–334. [Google Scholar]
- 52.White TL, Adams WT, Neale DB. Forest Genetics. Cabi Publishing; Oxfordshire, UK: 2007. [Google Scholar]
- 53.Sniezko RA. Resistance breeding against nonnative pathogens in forest trees—Current successes in North America. Can J Plant Pathol. 2006;28:S270–S279. [Google Scholar]
- 54.Franklin O, Palmroth S, Näsholm T. How eco-evolutionary principles can guide tree breeding and tree biotechnology for enhanced productivity. Tree Physiol. 2014;34:1149–1166. doi: 10.1093/treephys/tpu111. [DOI] [PubMed] [Google Scholar]
- 55.King KC, Lively CM. Does genetic diversity limit disease spread in natural host populations? Heredity (Edinb) 2012;109:199–203. doi: 10.1038/hdy.2012.33. [DOI] [PMC free article] [PubMed] [Google Scholar]
- 56.Paquette A, Messier C. The role of plantations in managing the world’s forests in the Anthropocene. Front Ecol Environ. 2010;8:27–34. [Google Scholar]
- 57.Preisler HK. Modelling spatial patterns of trees attacked by bark-beetles. Appl Stat. 1993;42:501–514. [Google Scholar]
- 58.Zas R. Iterative kriging for removing spatial autocorrelation in analysis of forest genetic trials. Tree Genet Genomes. 2006;2:177–185. [Google Scholar]
- 59.Zas R, Solla A, Sampedro L. Variography and kriging allow screening Pinus pinaster resistant to Armillaria ostoyae in field conditions. Forestry. 2007;80:201–209. [Google Scholar]
- 60.Hadfield JD. MCMC methods for multi-response generalized linear mixed models: The MCMCglmm R package. J Stat Softw. 2010;33:1–22. [Google Scholar]
- 61.Price GR. Selection and covariance. Nature. 1970;227:520–521. doi: 10.1038/227520a0. [DOI] [PubMed] [Google Scholar]
- 62.Kruuk LEB. Estimating genetic parameters in natural populations using the “animal model”. Philos Trans R Soc Lond B Biol Sci. 2004;359:873–890. doi: 10.1098/rstb.2003.1437. [DOI] [PMC free article] [PubMed] [Google Scholar]


