Significance
The evolution of plant vasculature was a key event in earth history because it enabled plants to effectively colonize land. The phloem vasculature was particularly important in this process. In angiosperms, the dominant group of extant terrestrial plants, phloem is assembled from specific conductive cells, the sieve elements. Here we provide evidence that a master regulator of the commitment to sieve element fate in Arabidopsis is strongly conserved and already present in the most basal extant angiosperms. We demonstrate the exquisite dosage-sensitive action of this polar-localized protein and show that its activity is in part regulated through the charge in a phosphorylation site. Surprisingly, however, its shootward polar localization does not appear to be essential for its function.
Keywords: Amborella, OCTOPUS, BREVIS RADIX, sieve element, GSK3
Abstract
Polar cellular localization of proteins is often associated with their function and activity. In plants, relatively few polar-localized factors have been described. Among them, the plasma membrane-associated Arabidopsis proteins OCTOPUS (OPS) and BREVIS RADIX (BRX) display shootward and rootward polar localization, respectively, in developing root protophloem cells. Both ops and brx null mutants exhibit defects in protophloem differentiation. Here we show that OPS and BRX act genetically in parallel in this process, although OPS dosage increase mends defects caused by brx loss-of-function. OPS protein function is ancient and conserved in the most basal angiosperms; however, many highly conserved structural OPS features are not strictly required for OPS function. They include a BRASSINOSTEROID INSENSITIVE 2 (BIN2) interaction domain, which supposedly mediates gain-of-function effects obtained through ectopic OPS overexpression. However, engineering an increasingly positive charge in a critical phosphorylation site, S318, progressively amplifies OPS activity. Such hyperactive OPS versions can even complement the severe phenotype of brx ops double mutants, and the most active variants eventually trigger gain-of-function phenotypes. Finally, BRX-OPS as well as OPS-BRX fusion proteins localize to the rootward end of developing protophloem cells, but complement ops mutants as efficiently as shootward localized OPS. Thus, our results suggest that S318 phosphorylation status, rather than a predominantly shootward polar localization, is a primary determinant of OPS activity.
The subcellular localization of proteins is often directly linked to their function. Asymmetric, polar protein localization has garnered particular attention because it is frequently associated with crucial developmental decisions in multicellular organisms. For example, the polar localization of PAR proteins is required to guide asymmetric cell divisions in animals (1). In plants, relatively few polar-localized factors have been described. The most prominent examples are the PIN-FORMED (PIN) proteins, which are integral plasma membrane efflux carriers for the plant hormone auxin (2). The polar localization of PINs determines the direction of intercellular auxin transport, which is instructive in many adaptive as well as developmental processes (3). PINs are themselves regulated by polar-localized cytoplasmic protein kinases (4), which associate with the plasma membrane through the interaction of their basic hydrophobic patches with phosphoinositides (5). Other examples for polar-localized proteins comprise auxin influx carriers (6), nutrient transporters (7, 8), regulatory proteins involved in Casparian strip formation (9), and developmental switches that determine daughter-cell fate during stomata formation (10). In all of these cases, polar localization is assumed to play an important role in the protein’s activity, and in some cases, this has been demonstrated experimentally.
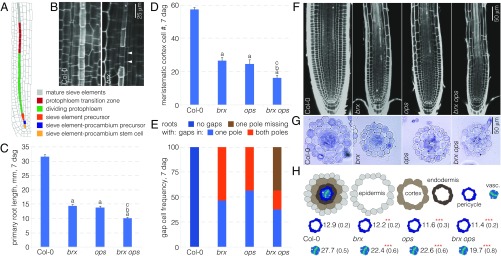
In the Arabidopsis root, two plasma membrane-associated proteins, BREVIS RADIX (BRX) and OCTOPUS (OPS), are polar-localized at the opposite end of developing sieve elements (11, 12). Whereas BRX is localized rootward, OPS is localized shootward. Both BRX and OPS play a crucial role in the formation of the protophloem, the conductive tissue that delivers shoot-derived nutrients and signals to the growing root tip (11–13). In Arabidopsis, dedicated stem cells in the root meristem continuously generate two distinct protophloem sieve element cell files (14, 15). The stem cell daughters undergo a stereotypic series of two periclinal and several anticlinal cell divisions before they partially elongate and differentiate into mature sieve elements as the root tip is gradually displaced distally by the growth process (Fig. 1A). Therefore, protophloem development can be observed in its entirety along a spatiotemporal gradient in the root meristem. Concomitantly, differentiating companion cells eventually flank the mature sieve elements to support them metabolically. Together, a sieve element cell file and two flanking companion cell files form one of the two protophloem poles. Sieve element differentiation comprises various cellular rearrangements, most notably enucleation and cell-wall build up (16, 17). The latter allows easy distinction of the developing protophloem from the later differentiating neighboring tissues and is particularly prominent in the six to eight partially elongated cells of the so-called protophloem sieve element transition zone (Fig. 1A) (12, 15). In brx and ops loss-of-function mutants, sieve element differentiation is frequently impaired, which leads to discontinuous protophloem strands and various associated systemic effects, including strongly reduced root growth (12, 15, 18, 19). Protophloem cells that fail to undergo sieve element differentiation in brx or ops can be visually identified by cell-wall staining in confocal microscopy because they not only fail to enucleate, but also fail to thicken their cell wall. Therefore, they appear as distinct “gaps” in the protophloem differentiation zone (Fig. 1B), and the frequency of these so-called “gap cells” can serve as a quantitative indicator of phenotypic severity (18, 20–22).
Fig. 1.
BRX and OPS act in genetically parallel pathways. (A) Schematic overview of the spatiotemporal gradient of protophloem differentiation in the Arabidopsis root meristem. (B) Confocal microscopy of PI-stained root meristems (close-up of the protophloem transition zone). The developing sieve element strands (asterisks) stand out because of their cell-wall build up compared with neighboring cell files. Nondifferentiating sieve elements in brx mutants do not undergo this process and appear as gap cells (arrowheads). (C–E) Root (meristem) phenotypes of brx single, ops single, and brx ops double mutants at 7 d after germination (dag): root length (n = 18) (C); meristem size (n = 10) (D); and gap-cell frequency (n = 16) (E). Statistically significant differences (Student’s t test) as indicated for P < 0.001 with a = vs. Col-0; b = vs. brx; c = vs. ops; mean ± SEM. (F) Representative confocal microscopy images of PI-stained root meristems for indicated genotypes. Asterisks indicate sieve element strands. (G) Representative cross-sections of toluidine-stained root meristem sections for indicated genotypes, taken approximately at the level where protoxylem starts to differentiate. (H) Quantification of cell numbers in cross-sections as in G for pericycle and vascular tissues (n = 8–16). Student’s t test: **P < 0.01; ***P < 0.001; mean ± SEM.
Mutants in which perception of the plant hormone brassinosteroid (BR) is knocked out also display protophloem differentiation defects; however, their phenotype is quantitatively less severe than in brx or ops (22). A direct link between the BR pathway and OPS has been suggested by the finding that OPS can interact with BRASSINOSTEROID-INSENSITIVE 2 (BIN2), a GSK3/SHAGGY-like kinase that acts downstream of BR receptors (23–26). OPS gain-of-function through ectopic overexpression mimics a BR hypersensitive or constitutive phenotype, including an elongated hypocotyl, twisted cotyledons, and root growth inhibition (27). Thus, it has been proposed that OPS inhibits BIN2 action by sequestering BIN2 at the plasma membrane (27). However, it remains unclear to what degree this is relevant in the wild-type or ops loss-of-function situations because dominant gain-of-function alleles in various downstream BR effectors do not display apparent protophloem phenotypes (22, 27).
OPS is expressed at low levels in the root protophloem poles (12, 15), and its activity appears to be determined by dosage (15), consistent with the strong phenotype triggered by overexpression (27). OPS dosage-sensitive action is also underlined by the observation that addition of a transgenic OPS copy (i.e., OPS expressed under its native promoter) can largely rescue the phloem differentiation defects of other mutants, including brx (15, 18). Thus, OPS can be considered a quantitative master regulator for the commitment to protophloem sieve element differentiation. This idea has also been corroborated by the isolation of a dominant ops mutant allele, which carries a single base-pair mutation that results in an E319K substitution and acts as a second site suppressor of the brx phenotype (15). Here we demonstrate that this substitution is directly adjacent to a phosphorylation site, S318, and that the charge in this site, rather than shootward polar localization, largely determines OPS activity.
Results
The brx ops Double Mutants Display an Additive Phenotype.
The root phenotypes of brx and ops loss-of-function mutants are very similar at the macroscopic as well as the microscopic level in both quality and quantity. For example, compared with their Columbia (Col-0) wild-type background, root length is reduced to ∼40%, meristem size (expressed as the number of meristematic cortex cells) is reduced to ∼50%, and the frequency of protophloem strands with sieve element precursors that fail to differentiate (i.e., gap cells) is ∼50% (12, 15) (Fig. 1 C–E). The phenotypic similarity suggests that BRX and OPS could act in the same pathway, and this notion is strengthened by the observation that the semidominant opsE319K allele, as well as a dosage increase in wild-type OPS, can suppress brx defects (15). However, although these results support a scenario where OPS acts downstream of BRX, it also appears possible that BRX and OPS act in parallel pathways that promote the same process, for example, by impinging on common downstream targets.
Phenotypic epistasis is one way to distinguish whether two mutants affect a process in sequence or in parallel, and we therefore created brx ops double homozygous mutants. In these double mutants, all quantitative phenotypes of the single mutants were enhanced compared with the single mutants, with root length further reduced to ∼30% (Fig. 1C), and meristem size further reduced to ∼40% (Fig. 1D). Gap-cell frequency was further increased (Fig. 1E), but often difficult to quantify because of the severely reduced meristem size (Fig. 1F). Moreover, one of the two protophloem strands was frequently missing, which could be an effect of the substantially reduced number of cell files in the double mutant (Fig. 1 G and H). Therefore, genetically, BRX and OPS appear to act in parallel. Supporting this idea, OPS expression does not appear to depend on BRX (Fig. S1 A and B), and OPS localization is unaltered in brx mutants (15). In summary, BRX and OPS possibly act through parallel pathways that both impinge on protophloem sieve element differentiation.
Fig. S1.
OPS expression in brx and OPS variant with myristylation signal. (A and B) Microscopy images (Nomarski optics) of 5-d-old Col-0 (A) or brx (B) root meristems, stained for expression (blue) of a GUS reporter gene driven by the OPS promoter. (C) Representative seedlings of indicated genotypes at 7 dag. (D) Representative confocal microscopy image of 7-d-old PI-stained (red) root meristem for indicated genotype, expressing a fluorescently tagged OPS variant (green).
OPS Subcellular Localization Is Essential for Its Function.
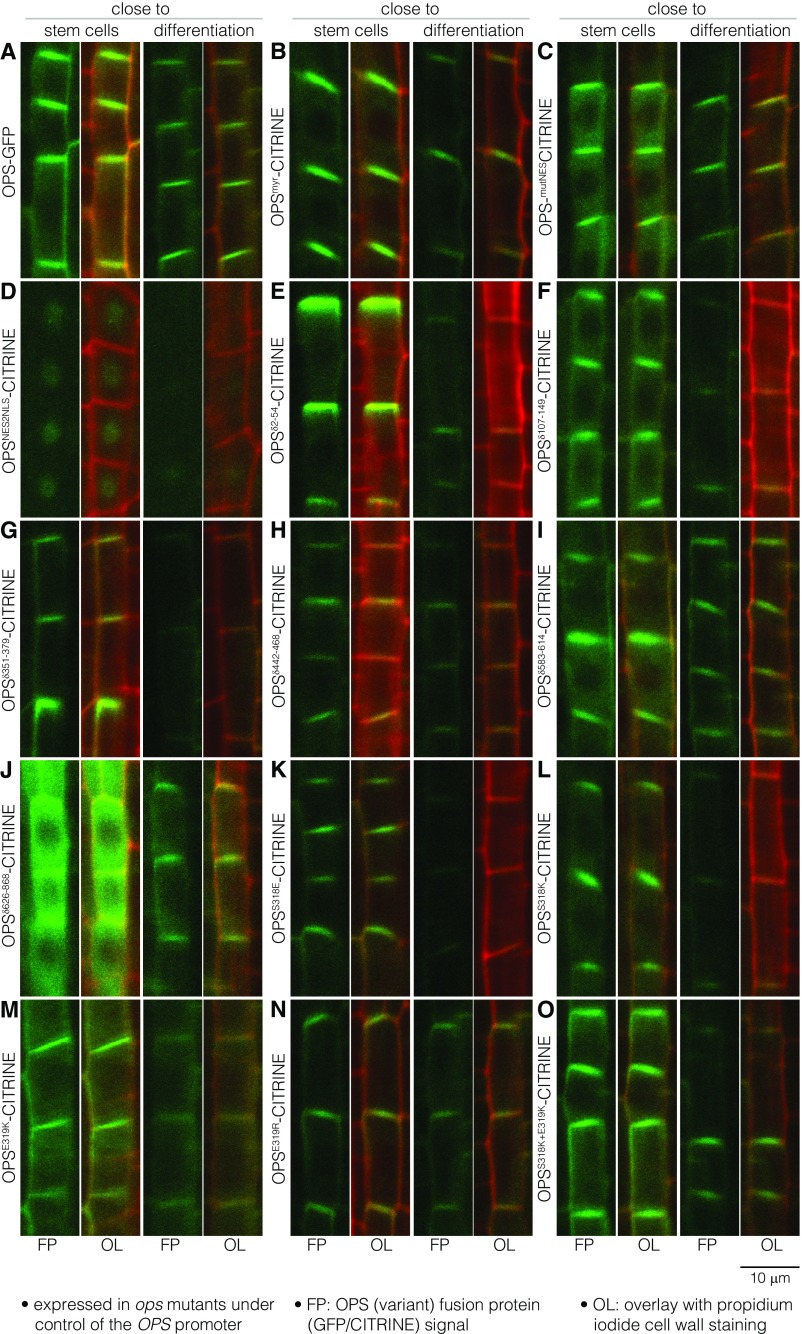
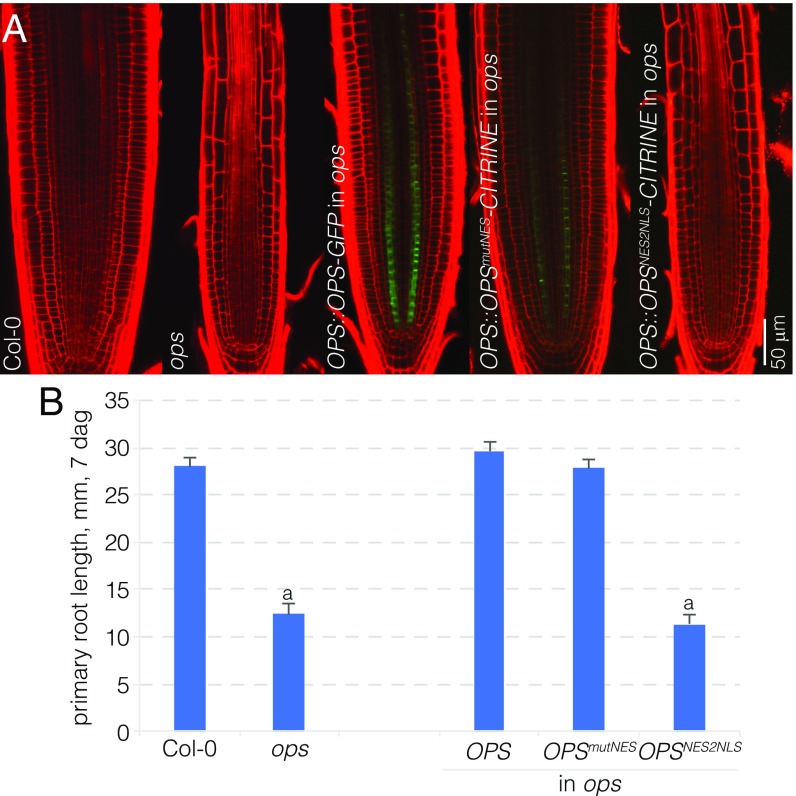
The OPS fusion protein is mostly polar-localized at the plasma membrane, but is also found in the cytoplasm, especially in the early, dividing protophloem cells. To investigate the functional relevance of this localization, we created an OPS variant in which an artificial myristoylation signal was added to the N terminus (OPSmyr) in the hope that this would largely abolish cytoplasmic localization. A corresponding OPS::OPSmyr-CITRINE transgene could perfectly complement the ops mutant (Fig. S1C), and compared with the wild-type OPS-GFP fusion protein, the OPSmyr-CITRINE fusion protein appeared more plasma membrane-associated (Fig. S1D). However, some cytosolic signal was still observed (Fig. S2 A and B). We also created OPS variants in which two putative nuclear exclusion signals (NES) were either disrupted (OPSmutNES) or replaced by nuclear localization signals (NLS) (OPSNES2NLS). The corresponding OPSmutNES-CITRINE fusion protein retained the predominant plasma membrane localization of wild-type OPS (Fig. S2C) and perfectly complemented the ops mutant (Fig. 2 A and B). By contrast, the OPSNES2NLS-CITRINE fusion protein was less abundant, mostly nuclear-localized (Fig. S2D), and not able to complement the ops mutant (Fig. 2 A and B). Therefore, plasma membrane association and/or cytoplasmic localization appear to be essential for OPS function.
Fig. S2.
Subcellular localization of OPS variants investigated in this study. (A–O) Representative confocal microscopy images of PI-stained (red) root meristems, showing close-ups of developing protophloem sieve elements either close to the stem cell niche or just before differentiation (see Fig. 1A for overview). The indicated fluorescently tagged OPS fusion proteins (green) were expressed under control of the OPS promoter in an ops single mutant background.
Fig. 2.
Activity of mis-localized OPS variants. (A) Representative confocal microscopy images of PI-stained (red) root meristems for indicated genotypes, expressing fluorescently tagged OPS variants (green). (B) Root length of indicated genotypes at 7 dag (n = 15). Statistically significant differences (Student’s t test) as indicated for P < 0.001 with a = vs. Col-0; mean ± SEM.
Several Highly Conserved Domains Are Dispensable for OPS Activity.
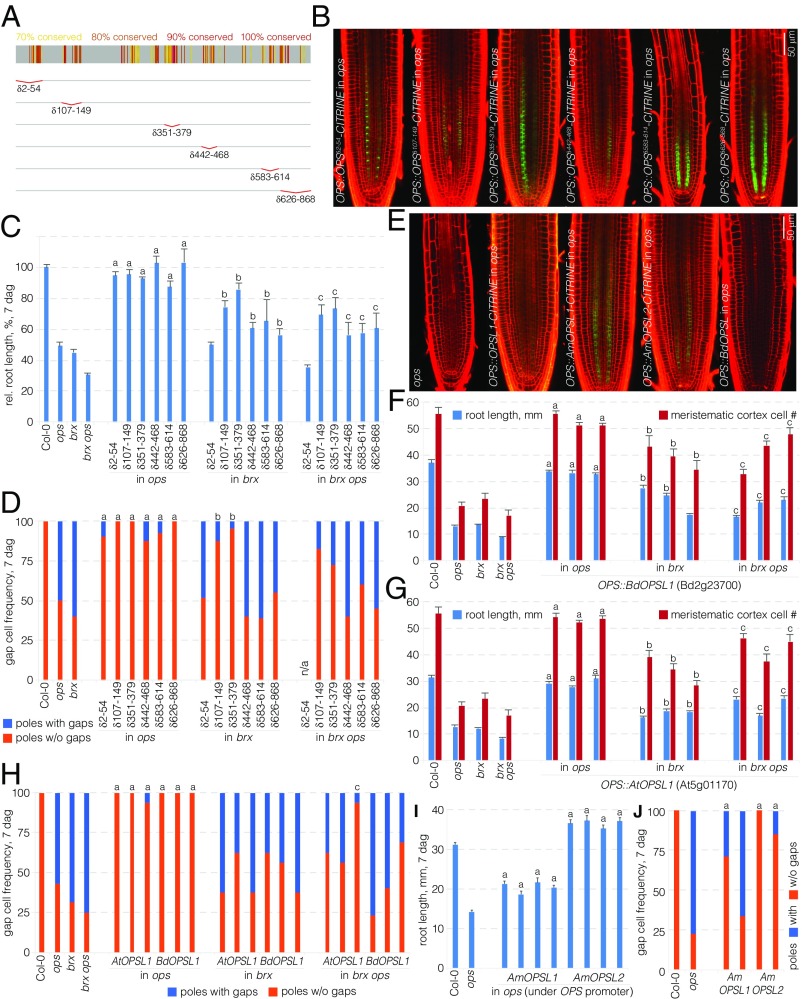
To learn more about functionally important features of OPS, we next created a series of deletion constructs. To guide our experiments, we generated a sequence alignment of 77 OPS homologs mined from 31 plant species to determine the most conserved protein regions (Dataset S1). We then cloned OPS versions in which six of the most highly conserved amino acid regions were deleted in frame: OPSδ2−54, OPSδ107−149, OPSδ351−379, OPSδ442−468, OPSδ583−614, and OPSδ626−868 (Fig. 3A). CITRINE fusions of these proteins all displayed plasma membrane association as well as cytosolic localization, although in varying degrees (Fig. 3B and Fig. S2 E–J). In particular, OPSδ626−868-CITRINE displayed higher cytoplasmic abundance than wild-type OPS (Fig. S2J) and overall also appeared more abundant (Fig. 3B), especially close to the stem cells. By contrast, OPSδ2−54-CITRINE also appeared on average more abundant, but was comparatively less cytoplasmic and more plasma membrane-associated (Fig. 3B and Fig. S2E). However, all deletion constructs were largely able to complement the ops mutant (Fig. 3 C and D). Therefore, none of the conserved domains investigated appears to be essential for OPS function in isolation.
Fig. 3.
Activity of OPS deletion variants and homologs. (A) Schematic presentation of the degree of conservation across an OPS family protein alignment (Dataset S1) and the in-frame deletion constructs investigated in this study. (B) Representative confocal microscopy images of PI-stained (red) root meristems for indicated genotypes, expressing fluorescently tagged OPS variants (green). (C) Root length of indicated genotypes at 7 dag (average of two to eight independent transgenic lines per construct; n ≥ 15 per line). Statistically significant differences (Student’s t test) as indicated for P < 0.001 with a = vs. ops; b = vs. brx; c = vs. brx ops; mean ± SEM. (D) Gap-cell frequency of indicated genotypes at 7 dag (average of two independent transgenic lines per construct; n = 20 per line). Statistically significant differences (Fisher’s exact test) as indicated for P < 0.01 with a = vs. ops; b = vs. brx; Note that brx ops double-mutant control was not scored in this experiment. However, seedlings of all lines except for the δ2−54 construct displayed two protophloem strands, indicative of partial rescue. (E) Representative confocal microscopy images of PI-stained (red) root meristems for indicated genotypes, expressing fluorescently tagged OPS variants (green). (F and G) Root length and meristem size of indicated genotypes at 7 dag with three independent transgenic lines per construct [n = 15 (root length) and n ≥ 8 (meristem size) per line]. Statistically significant differences (Student’s t test) as indicated for P < 0.001 with a = vs. brx; b = vs. ops; c = vs. brx ops; mean ± SEM. (H) Gap-cell frequency of indicated genotypes at 7 dag with three independent transgenic lines per construct (n = 16 per line). Statistically significant differences (Fisher’s exact test) as indicated for P < 0.01 with a = vs. ops; c = vs. brx ops. (I) Root length of indicated genotypes at 7 dag with four independent transgenic lines per construct (n = 15 per line). Statistically significant differences (Student’s t test) as indicated for P < 0.001 with a = vs. brx; b = vs. ops; c = vs. brx ops; mean ± SEM. (J) Gap-cell frequency of indicated genotypes at 7 dag with two independent transgenic lines per construct (n ≥ 18 per line). Statistically significant differences (Fisher’s exact test) as indicated for P < 0.01 with a = vs. ops.
The brx Single and brx ops Double Mutants Provide Sensitized Backgrounds to Quantitatively Assess OPS Activity.
The observation that practically all OPS variants investigated above, with the exception of OPSNES2NLS, could fully rescue the ops mutant was surprising. Given that a transgenic extra copy of OPS::OPS-GFP can rescue the brx phenotype (15), we thus speculated that brx single mutants as well as brx ops double mutants could serve as sensitized backgrounds to assess OPS activity. Indeed, when the various constructs were evaluated in brx single or brx ops double mutants, differences in the activity of OPS variants became apparent. For example, although all deletion variants practically fully rescued root growth of ops single mutants, only OPSδ107−149-CITRINE and OPSδ351−379-CITRINE also substantially rescued brx mutants and brx ops double mutants (Fig. 3 C and D). Moreover, although OPSδ442−468-CITRINE, OPSδ583−614-CITRINE, and OPSδ626−868-CITRINE still partially complemented brx ops (also in the sense that two protophloem strands were observed in all seedlings), OPSδ2−54-CITRINE could not rescue brx ops double mutants at all. In summary, although amino acids 2–54, 442–468, 583–614, and 626–868 are dispensable for complementation of ops mutants, their deletions nevertheless appear to affect OPS activity to variable degrees.
OPS Activity Is Conserved in a Basal Angiosperm.
To complement the domain analysis, we also tested the propensity of selected OPS homologs to rescue the ops mutant. OPS-LIKE (OPSL) genes are relatively well conserved and thus easy to identify in angiosperms. However, they are apparently absent from gymnosperms and lycophytes, as well as bryophytes. In the basal angiosperm Amborella trichopoda, we could identify two OPSL genes, AmOPSL1 and AmOPSL2 (Dataset S2), which we had resynthesized as Arabidopsis codon-optimized versions to ensure efficient expression. Moreover, we isolated the coding sequence of a monocotyledon OPSL gene, the Brachypodium distachyon homolog BdOPSL1 (Bd2g23700), as well as an Arabidopsis OPS homolog, AtOPSL1 (At5g01170). All four ORFs were expressed in ops mutants under control of the OPS promoter. The three proteins that were expressed as CITRINE fusions displayed the characteristic OPS polar plasma membrane association as well as cytoplasmic signal (Fig. 3E). Both BdOPSL1 and AtOPSL1 not only complemented the ops phenotype, but also substantially rescued brx and brx ops mutants (Fig. 3 F–H). However, unlike the fully complementing AmOPSL2, AmOPSL1 only partially rescued the ops mutant (Fig. 3 I and J). This finding was consistent with the fact that it was the most diverged of the four genes tested (Dataset S1). Nevertheless, because AmOPSL2 fully complemented the Arabidopsis ops mutant, our data suggest that OPS protein function has been conserved from the earliest angiosperms onward.
OPS Is Phosphorylated at Its S318 Site.
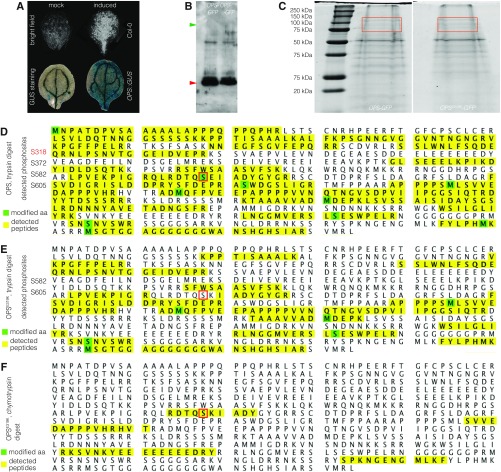
The original finding that assigned OPS a rate-limiting role in driving sieve element differentiation was the identification of a dominant ops allele as a second-site brx suppressor (15). The E319K amino acid change in this opsE319K allele is located C-terminal to a serine residue that has been described to be phosphorylated (28) and within a highly conserved amino acid stretch across OPSL proteins (Fig. 4A). To determine whether the E319K mutation could have an effect on the adjacent phosphosite, we sought to analyze transgenic OPS-GFP as well as an engineered OPSE319K-GFP by proteomics after immunoprecipitation from seedlings. These attempts failed, presumably because OPS is expressed at comparatively low levels in relatively few cells (15). However, a recently established transdifferentiation assay (29) opened up the possibility of performing proteomics analyses of the transgenic OPS-GFP fusion protein when expressed under control of the native OPS promoter. Briefly, in this vascular cell induction culture system using Arabidopsis leaves (VISUAL) assay, cotyledon or leaf mesophyll cells are reprogrammed by hormonal treatments to differentiate into an ∼50:50 mix of xylem vessels and sieve elements. OPS transcription is induced in the future sieve elements during the early stages of this process (29) (Fig. S3A), opening the prospect of immunoprecipitating sufficient OPS-GFP fusion protein from its native cell type to perform proteomics analyses. Even though in Western blots little full-length protein could be detected after immunoprecipitation from an extract of 300–400 cultured cotyledons (Fig. S3B), OPS peptides could be detected in liquid chromatography–mass spectrometry (LC-MS/MS) phosphoproteomics after trypsin digestion in the denaturing gel area cut out around the size of full-length protein (Fig. S3C). For OPS, 84 peptides that covered 399 aa of the 685-aa sequence could be detected (58% coverage) (Fig. S3D), whereas, for OPSE319K, 47 peptides that covered 226 amino acids (33% coverage) were found (Fig. S3E). In the OPS sample, four phosphorylated peptides were found, all at serines (S318, S372, S582, S605), confirming the S318 phosphosite (Fig. S3D). A second peptide covering S318 was not phosphorylated, and S318 was not covered in the OPSE319K sample (Fig. S3E). However, the E319K substitution creates a novel trypsin site, which would be cut if S318 were not phosphorylated, giving rise to a small peptide that would not have been detected in LC-MS/MS. Therefore, we repeated the analysis of the OPSE319K sample with a chymotrypsin digest. In this LC-MS/MS we could detect one peptide that covered the site but in which S318 was not phosphorylated (Fig. S3F). Although this provided circumstantial evidence that the E319K substitution might interfere with S318 phosphorylation, the data were far from quantitative. We thus decided to investigate the effects of differential S318 phosphorylation genetically.
Fig. 4.
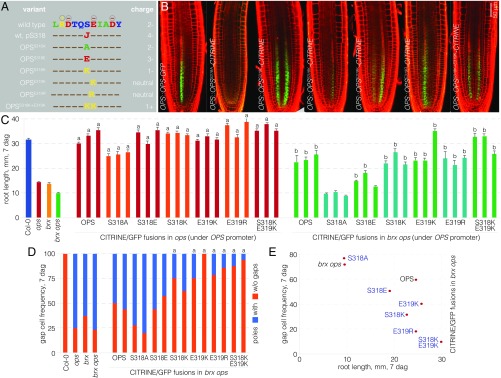
Activity of OPS S318 phosphosite variants. (A) Schematic presentation of the conserved domain around the S318 phosphosite of OPS, the point mutant variants investigated in this study, and the predicted charge. (B) Representative confocal microscopy images of PI-stained (red) root meristems for indicated genotypes, expressing fluorescently tagged OPS variants (green). (C) Root length of indicated genotypes at 7 dag with three independent transgenic lines per construct (n ≥ 15 per line). Statistically significant differences (Student’s t test) as indicated for P < 0.001 with a = vs. ops; b = vs. brx ops; mean ± SEM. (D) Gap-cell frequency of indicated genotypes at 7 dag with two independent transgenic lines per construct (n ≥ 16 per line). Statistically significant differences (Fisher’s exact test) as indicated for P < 0.01 with a = vs. brx ops. (E) Root length plotted vs. gap-cell frequency for brx ops double-mutant background and corresponding transgenic lines expressing different OPS variants (average of three to five independent transgenic lines per construct; n ≥ 15 per line).
Fig. S3.
Proteomics analysis of OPS fusion proteins. (A) Microscopy images of cotyledons cultured in the VISUAL assay, illustrating transdifferentiation into xylem vessels (white signal, bright field) and sieve elements [marked by GUS expression (blue) under control of the OPS promoter] upon inductive conditions, but not in mock conditions. (B) Western blot detection of indicated fusion proteins with anti-GFP antibody after immunoprecipitation from VISUAL assays. Green arrowhead indicates expected size of fusion proteins; red arrowhead indicates signal from degraded protein and/or primary antibody contamination. (C) Silver-stained protein gel of immunoprecipitates; the approximate gel regions cut out for LC-MS/MS are boxed in red. (D–F) Overview of LC-MS/MS phosphoproteomics analysis results for indicated OPS variants after trypsin (D and E) or chymotrypsin (F) digest.
Positive Charge at the S318 Phosphosite Amplifies OPS Activity.
To investigate the functional relevance of the S318 phosphosite, we generated a number of transgenes in which OPS point mutants were expressed as CITRINE fusions under the control of the OPS promoter: a phosphosite knockout, i.e., an S318A mutation (OPSS318A); a phosphosite mimic, i.e., an S318E mutation (OPSS318E); a recreation of the E319K mutation (OPSE319K); an E319K mimic, E319R (OPSE319R); a charge reversal of S318, S318K (OPSS318K); and a double charge reversal of S318 and E319, S318K E319K (OPSS318K+E319K) (Fig. 4A). All of these OPS variants retained the plasma membrane localization of wild-type OPS, displayed comparable abundance (Fig. 4B) (Fig. S2 K–O), and also complemented the ops mutant (Fig. 4C). The only exception was the OPSS318A-CITRINE fusion, which was barely detectable in all of the independent transgenic lines produced, but nevertheless largely complemented ops (Fig. 4C). However, unlike the other variants, OPSS318A-CITRINE could not even partially rescue brx ops double mutants (Fig. 4 C and D). These observations indicate that the S318 site might play a role in OPS stability.
For the other OPS variants, clearly differential activity became apparent once they were introduced into the brx ops background, and again the extent of root growth rescue (Fig. 4C) correlated with the frequency of gap cells (Fig. 4D). Some variation was observed between independent transgenic lines for each construct, which likely reflected expression differences that apparently could arise from concatenated T-DNA insertions or the genomic context of individual insertion sites. However, the expression variation between lines of the same construct was comparable for different constructs, and overall the extent of rescue apparently depended on the OPS variant. For example, in an experiment with two sets of lines where we compared the one in which OPSS318E-CITRINE was most abundant with the one in which OPSS318K+E319K-CITRINE was least abundant, OPSS318E-CITRINE still displayed weaker rescue than OPSS318K+E319K-CITRINE (29.3% gap-cell frequency versus 8.3% with n = 58 and n = 46, respectively). Thus, a robust picture emerged with activity in the following order from lowest to highest: OPSS318A-CITRINE < OPSS318E-CITRINE < OPS-CITRINE < OPSS318K-CITRINE ∼ OPSE319K-CITRINE < OPSE319R-CITRINE < OPSS318K+E319K-CITRINE (Fig. 4E). This series correlated with an increasingly positive charge in the phosphosite, especially under the assumption that an E319K/R switch would also interfere with S318 phosphorylation (Fig. 4A). The most positively charged version, OPSS318K+E319K-CITRINE, was hyperactive to a degree that, in many lines in a brx ops double-mutant background, both root growth and protophloem development were practically rescued to wild-type levels (Fig. 4 C–E).
OPSS318K+E319K Can Trigger an OPS Overexpression Phenotype.
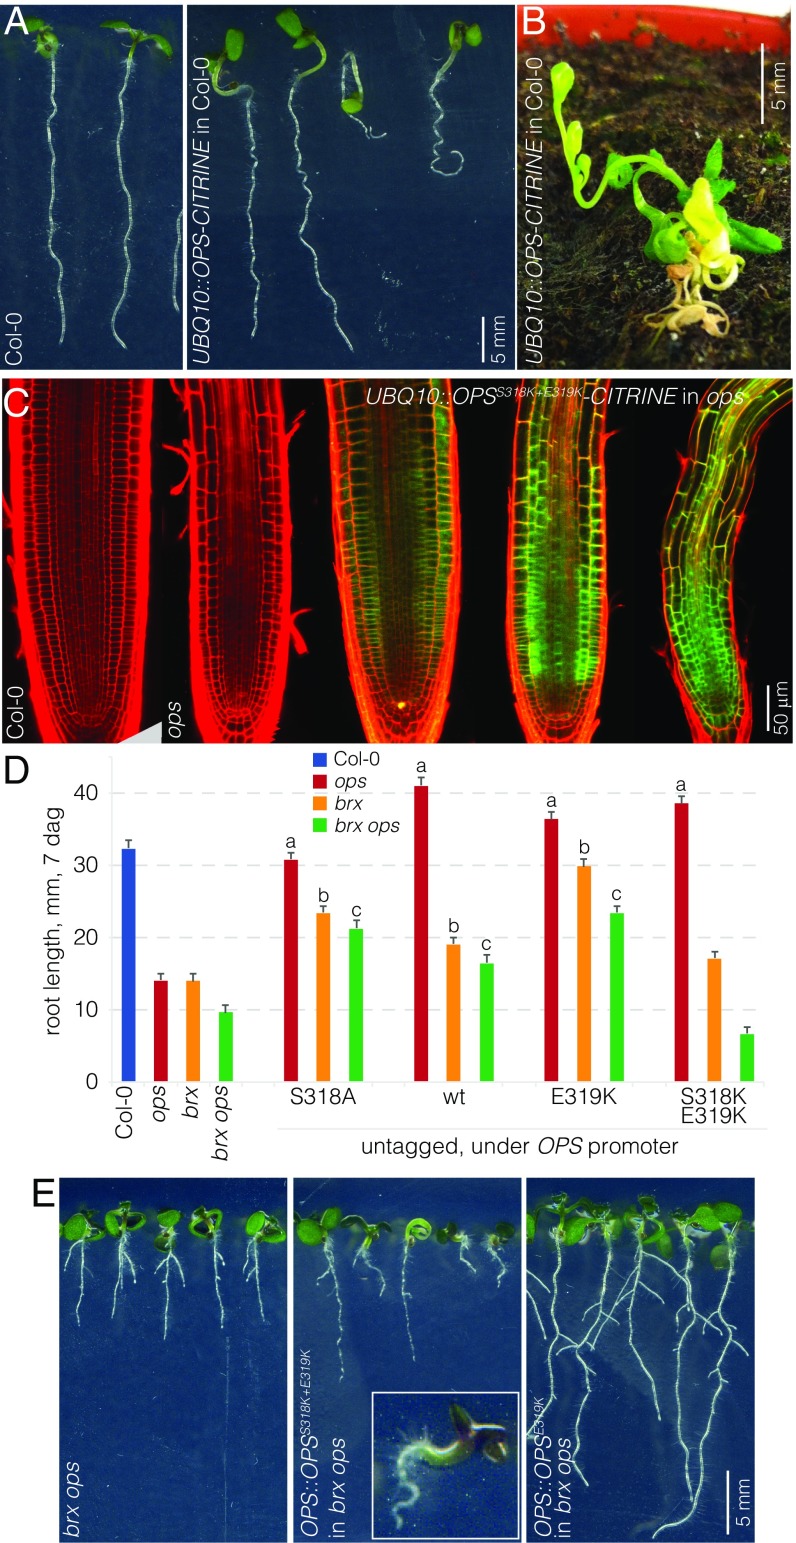
The dosage-sensitive action of OPS is also reflected in the phenotype that is triggered by ectopic OPS-GFP overexpression under control of the constitutive 35S promoter (27). Such 35S::OPS-GFP plants display morphological hallmarks of constitutive BR response, most notably reduced, wavy root growth; elongated hypocotyls; and epinastic cotyledons. We could recreate the same effect with OPS-GFP expression under control of the strong constitutive UBQ10 promoter (Fig. 5 A and B). Variation of phenotypic severity between independent lines correlated with expression level, as exemplified in UBQ10::OPSS318K+E319K-CITRINE lines (Fig. 5C), once more corroborating the strong dosage dependence of OPS activity. To monitor whether the fluorescent tags had an impact on our OPS variants when expressed under control of the native promoter, we recloned selected key variants, i.e., wild-type OPS, OPSS318A, OPSE319K, and OPSS318K+E319K without the CITRINE fusions. All four transgenes fully rescued the ops single mutant (Fig. 5D), and OPS::OPSE319K also completely rescued the brx single mutant, thereby corroborating the effect of the original semidominant ops allele (15). Moreover, OPS::OPSE319K substantially complemented the brx ops double mutant (Fig. 5 D and E). Further, compared with its tagged version, OPS::OPSS318A was considerably more active, about as much as wild-type OPS::OPS (Fig. 5D). By contrast, the OPSS318K+E319K construct differed substantially from its CITRINE-tagged counterpart in terms of root growth, which was not fully rescued in brx single mutants and even further repressed in brx ops double mutants (Fig. 5D). However, these plants also displayed a gain-of-function phenotype, marked by the frequent occurrence of seedlings with elongated hypocotyls and an apparent root growth arrest (Fig. 5E). Although this resembled in part an OPS overexpression phenotype, it was also distinct from it in particular because, in the most extreme cases, seedling development was severely suppressed (Fig. 5E). This phenotype was never observed in the overexpression lines. In summary, these results suggest that the fluorescent tags attenuate OPS activity and that OPSS318K+E319K is a strongly hyperactive OPS protein variant that can impart gain-of-function phenotypes even when expressed at the native low and tissue-specific levels.
Fig. 5.
The OPSS318K+E319K variant is strongly hyperactive. (A) Representative seedlings of indicated genotypes, 7 dag. (Right) The phenotypic range observed in OPS ectopic overexpression lines. (B) A 28-d-old plant that ectopically overexpresses an OPS-CITRINE fusion protein. (C) Representative confocal microscopy images of PI-stained (red) root meristems for indicated genotypes, ectopically overexpressing fluorescently tagged OPSS318K+E319K (green). Note the correlation of phenotypic severity with expression level. (D) Root length of indicated genotypes at 7 dag (average of 6–12 independent transgenic lines per construct; n = 15 per line). Statistically significant differences (Student’s t test) as indicated for P < 0.001 with a = vs. ops; b = vs. brx; c = vs. brx ops; mean ± SEM. (E) Representative seedlings of indicated genotypes, 7 dag, showing the phenotypic range observed in indicated genotypes. (Inset) Close-up of the most severe phenotype frequently observed in lines expressing the untagged OPSS318K+E319K variant in a brx ops background.
Hyperactive OPS Does Not Display Altered Plasma Membrane Recruitment of BIN2.
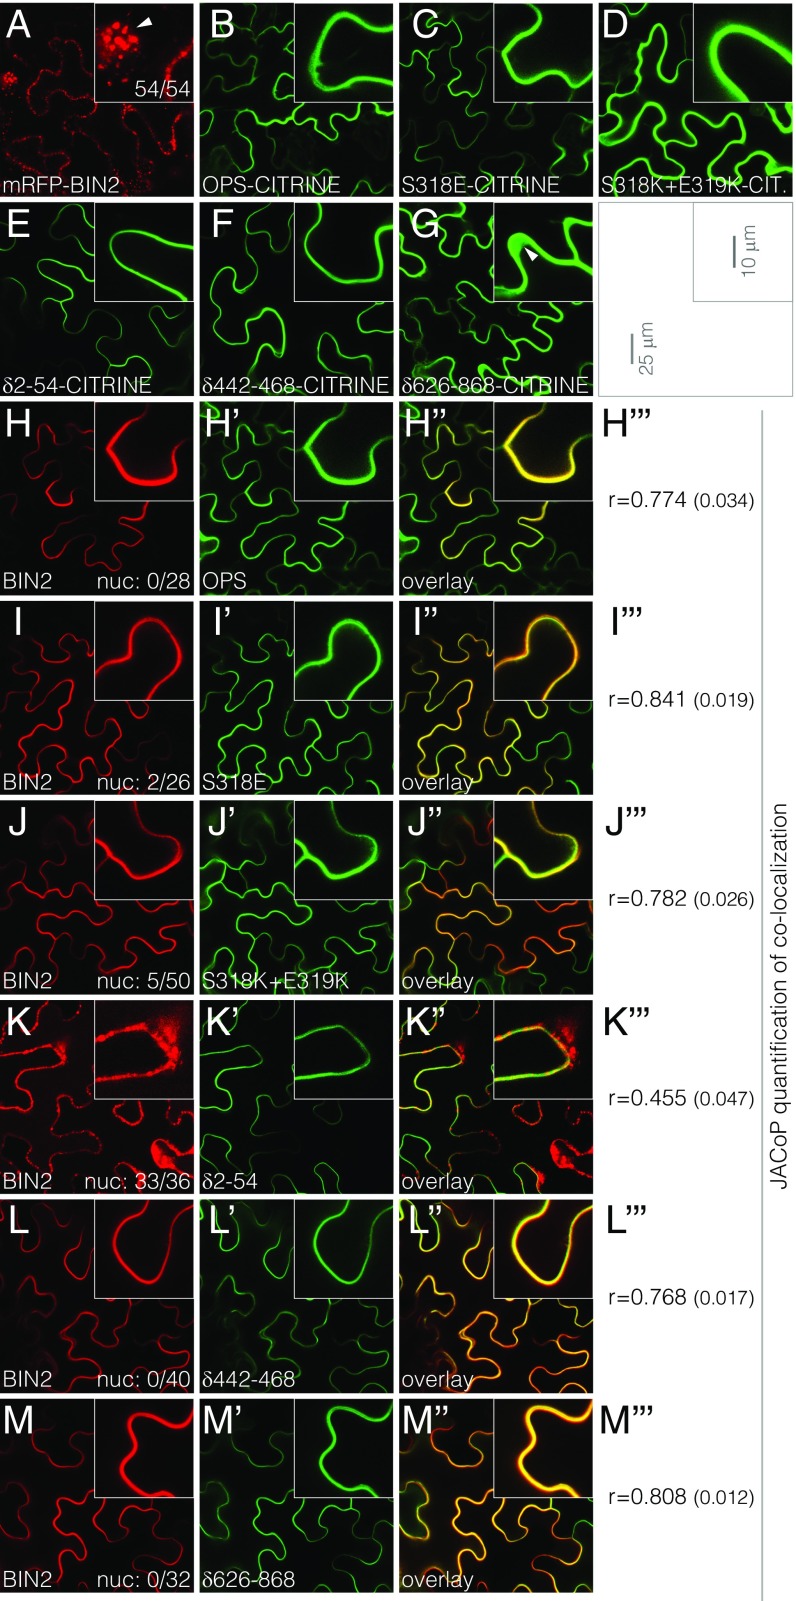
The gain-of-function phenotype triggered by ectopic OPS overexpression, which resembles a constitutive BR response, has been attributed to interaction of OPS with BIN2 (27) because BIN2 is inactivated by BR signaling (26). The idea put forward poses that excess OPS sequesters and thereby inhibits BIN2 at the plasma membrane, leading to activation of nuclear BR effectors. However, none of our phosphosite variants, including OPSS318K+E319K, displayed any apparently altered subcellular localization or stronger plasma membrane association in planta (Fig. S2 K–O). Moreover, in a transient tobacco (Nicotiana benthamiana) expression system, we observed equally efficient plasma membrane association of wild-type OPS, OPSS318E, and OPSS318K+E319K CITRINE fusions (Fig. 6 A–D). By contrast, an mRFP-BIN2 fusion protein displayed spotty cytoplasmic as well as nuclear localization (Fig. 6A), corroborating earlier results (27). Also confirming published data (27), coexpression of OPS and BIN2 fusion proteins resulted in recruitment of BIN2 to the plasma membrane (Fig. 6H). In parallel experiments with OPSS318E-CITRINE or OPSS318K+E319K-CITRINE, colocalization with mRFP-BIN2 was quantitatively not different from the wild-type fusion (Fig. 6 I and J).
Fig. 6.
Colocalization of BIN2 with different OPS variants. (A–G) Transient expression of indicated mRFP (red fluorescence) or CITRINE (green fluorescence) fusion proteins in tobacco (N. benthamiana) leaf epidermal cells under the control of the 35S constitutive promoter (confocal microscopy). (A, Inset) Arrowhead points out nuclear localization. (H–M) Transient coexpression of mRFP-BIN2 with indicated CITRINE fusions of OPS variants (H′–M′) in tobacco leaf epidermal cells. Red fluorescent and green fluorescent channels are shown separately and in overlay (H′′-M′′). The number of cells that displayed the nuclear mRFP-BIN2 signal among all cotransformed cells is indicated in the lower right corner of H–M [compare with A; no combination behaved significantly differently from BIN2 + OPS, except BIN2 + OPSδ2−54 (P < 0.001), which, unlike all other combinations, was not significantly different from the BIN2 control (Fisher’s exact test)]. (H′′′–M′′′) Pearson’s r of colocalization (±SEM) (n ≥ 15 per combination). Expression levels (mean intensity value of transformed cells) of BIN2 or OPS variant fusion proteins were not significantly different within experiments (one-way ANOVA; point variants experiment: F = 0.21, P = 0.81 for OPS variants; F = 0.57, P = 0.56 for BIN2; deletion variants experiment: F = 2.357, P = 0.10 for OPS variants; F = 1.61, P = 0.21 for BIN2).
Efficient BIN2 Plasma Membrane Recruitment Is Not Required for OPS Function.
In a similar experiment, we also investigated selected OPS deletion versions, OPSδ2−54-CITRINE, OPSδ442−468-CITRINE, and OPSδ626−868-CITRINE. Again all three proteins associated with the plasma membrane (Fig. 6 E–G). However, corroborating the observations in the root (Fig. 3B and Fig. S2J), OPSδ626−868-CITRINE also showed strong cytoplasmic localization (Fig. 6G). Moreover, BIN2 recruitment to the plasma membrane was substantially reduced if not even absent with OPSδ2−54-CITRINE (Fig. 6K), whereas BIN2 colocalization with OPSδ442−468-CITRINE and OPSδ626−868-CITRINE was as efficient as with wild-type OPS-CITRINE (Fig. 6 L and M). Considering that both OPSδ442−468-CITRINE and OPSδ626−868-CITRINE displayed reduced activity in planta compared with other deletion constructs, and considering that OPSδ2−54-CITRINE could complement ops but was the least active deletion construct (Fig. 3 C and D), these results indicate that BIN2 interaction is not essential for OPS function, but could still modulate OPS activity.
Functional BRX-OPS Fusion Proteins Are Polarized Rootward in Developing Protophloem.
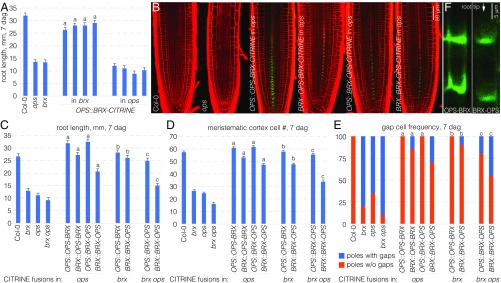
To investigate whether the activity of OPS protein depends not only on the S318 phosphosite charge, but also on its polar localization within developing protophloem cells, we sought to manipulate OPS polarity. To this end, we created tagged fusion proteins between OPS and BRX in the hope that this might change OPS localization. First, considering that increased OPS dosage can rescue brx, we sought to exclude that the inverse is true by expressing a BRX-CITRINE fusion protein under control of the OPS promoter in the ops mutant background. Although this OPS::BRX-CITRINE transgene largely rescued brx, no complementation of the ops phenotype was observed (Fig. 7A). However, both OPS-BRX-CITRINE and BRX-OPS-CITRINE fusion proteins fully complemented the ops phenotype when expressed in the same regulatory context (Fig. 7 B–E). Qualitatively similar observations were made with OPS-BRX-CITRINE or BRX-OPS-CITRINE when expressed under the control of the BRX promoter instead (Fig. 7 B–E). However, overall the rescue was not as perfect as with the OPS promoter, which was likely due to the comparatively lower expression level of BRX. These observations extended to the rescue of brx single or brx ops double mutants, which was yet very efficient in all cases (Fig. 7 B–E).
Fig. 7.
Activity and localization of BRX-OPS fusion proteins. (A) Root length of indicated genotypes at 7 dag with four independent transgenic lines per construct (n = 16 per line). Statistically significant differences (Student’s t test) as indicated for P < 0.001 with a = vs. brx; mean ± SEM. (B) Representative confocal microscopy images of PI-stained (red) root meristems for indicated genotypes, expressing fluorescently tagged BRX-OPS fusions (green). (C) Root length of indicated genotypes at 7 dag with representative transgenic lines (n = 15). Statistically significant differences (Student’s t test) as indicated for P < 0.001 with a = vs. ops; b = vs. brx; c = vs. brx ops; mean ± SEM. (D) Meristem size of indicated genotypes at 7 dag with representative transgenic lines (n = 10). Statistically significant differences (Student’s t test) as indicated for P < 0.001 with a = vs. ops; b = vs. brx; c = vs. brx ops; mean ± SEM. (E) Gap-cell frequency of indicated genotypes at 7 dag with representative transgenic lines (n = 20). Statistically significant differences (Fisher’s exact test) as indicated for P < 0.01 with a = vs. ops; b = vs. brx; c = vs. brx ops. (F) Confocal microscopy images of BRX-OPS-CITRINE and OPS-BRX-CITRINE fusion proteins (green), a close-up on developing protophloem sieve elements.
Compared with OPS fusion proteins, both OPS-BRX-CITRINE and BRX-OPS-CITRINE appeared to be stronger plasma membrane-associated and displayed very little cytoplasmic signal, thus resembling BRX localization overall (Fig. 7B). Moreover, both from the mesoscopic visual impression and upon closer inspection, OPS-BRX-CITRINE as well as BRX-OPS-CITRINE were found to localize to the rootward end of developing protophloem cells, which was particularly evident in lines with stronger expression levels (Fig. 7F). Therefore, our data suggest that exclusive shootward localization of OPS is not an absolute prerequisite for its function.
Discussion
The evolution of plant vasculature has had a crucial impact on earth history and the biosphere because it enabled plants to effectively colonize land (30). The phloem as the crucial connection between sink and source organs must have had a particularly important role in this process because its adaptive transport capacity creates a synergy between the shoot and root system. Shoot-delivered photoassimilates sustain expansion of the root system, thereby enabling continued extraction of edaphic nutrients, which in turn are limiting for shoot growth. Two types of phloem conductive cells are observed in extant lineages: the more primitive sieve cells of ferns and gymnosperms, which lack sieve plates and are not associated with companion cells, and the sieve elements of angiosperms, which are interconnected through sieve plates to form continuous sieve tubes and are supported by companion cells (30, 31). Our results indicate that the presence of OPS family genes [originally dubbed “DUF (Domain of Unknown Function) 740” genes] correlates with the evolutionary appearance of sieve elements because they are found only in angiosperms. Moreover, our finding that an Amborella OPS-LIKE protein can complement the Arabidopsis ops mutant suggests that OPS function has been conserved since its emergence in early angiosperms. Supporting this idea, it is also of interest that all of the OPS-LIKE genes that we could identify display the same simple structural organization with a single exon. This might mean that OPSL genes are under strong selective pressure, which would be an interesting subject for future phylogenetic analyses of OPS-LIKE genes.
Given the level of conservation, it is even more surprising that various highly conserved domains of OPS are apparently not strictly necessary for its function, as indicated by complementation of the ops mutant. Nevertheless, differential activity of deletion variants became apparent when they were expressed in a brx or brx ops background. One explanation for these observations would be a combination of genetic redundancy and homotypic interaction. In such a scenario, complex formation of partially functional OPS variants with fully active homologs, such as AtOPSL1, would suffice to restore a wild-type phenotype in ops single mutants. Future analyses of the OPS variants investigated in this study in pertinent higher-order ops opsl mutant backgrounds could clarify whether this is indeed the case. Such studies might also lead to an understanding of the relevance of BIN2 interaction for OPS activity. The observation that an OPS variant with strongly reduced BIN2 interaction capacity can still complement ops single mutants, but is practically inefficient compared with other OPS variants in brx or brx ops background, suggests that on the one hand OPS–BIN2 interaction is not essential for OPS activity, but on the other hand is still a structural feature that can amplify it. However, the combined data from this and other studies (22, 27) therefore also indicate that BIN2 inactivation through its sequestration at the plasma membrane is likely not the primary output of OPS function.
In an alternative interpretation, the OPS–BIN2 interaction could also mean that OPS is regulated by BIN2, rather than the other way around. This would fit with the observed significant yet quantitatively minor positive role of BR signaling in protophloem differentiation (22). Knockout of the three BR receptors in Arabidopsis leads to a decrease in its intermediate signaling output, BIN2 inhibition (26), and is associated with a comparatively mild protophloem gap-cell phenotype (22). The latter could reflect decreased OPS or OPSL activity through an increase in inhibitory phosphorylation, for example, in the S318 site. Unfortunately, at present we are not in a position to experimentally verify such a scenario because of the inherent difficulty associated with biochemical investigation of OPS. So far the VISUAL assay was the only system in which we were able to isolate sufficient OPS protein for proteomic analyses, but even then abundance of individual OPS-derived peptides was low, precluding quantitative evaluation of a differential OPS phosphorylation state. In addition, the VISUAL transdifferentiation process, including OPS induction, is strictly dependent on the presence of bikinin (29, 32), a GSK3/BIN2 inhibitor (33). Therefore, it is at present not possible to create differential BIN2 activity states in this system that would then allow quantitative assessment of OPS phosphorylation status.
In our phosphoproteomics LC-MS/MS, we could identify four OPS phosphorylation sites. In this study, we focused on the S318 site because we had genetic evidence for its potential importance in vivo through the previously isolated opsE319K gain-of-function allele (15). Indeed, modification of S318 and the neighboring E319 corroborated this notion and suggests that the charge in this site has a strong impact on OPS activity. Increasingly positive charge amplifies OPS activity to the point that it becomes strongly hyperactive and thereby capable of fully rescuing the severe phenotype of brx ops double mutants and eventually even trigger a gain-of-function phenotype despite its low, tissue-specific expression level. What this activity increase means in mechanistic terms remains unclear at this point, but it does not appear to involve significant changes in subcellular localization or protein turnover. However, given the exquisite dosage action of OPS, as exemplified by between-line variation as a function of transgene expression level, it is conceivable that already small variations in protein localization or turnover could have a relatively strong effect, even though such variations might be difficult to quantify directly in developing protophloem cells in situ. In this context it is surprising that the shootward polar localization of OPS does not appear to be very important for OPS function. In the BRX-OPS and OPS-BRX fusion proteins, BRX localization apparently prevailed over OPS localization, leading to both rootward polarity and comparatively less cytoplasmic abundance. However, these fusion proteins complemented ops as well as brx and brx ops mutants very efficiently. We cannot completely exclude that a small amount of the fusion proteins, or possibly their (undetectable) OPS degradation intermediate, could have localized shootward in sufficient quantity to fulfill the role of OPS in its native compartment. However, against the background of the many other OPS variants investigated in this study, this appears unlikely. For example, the nuclear-localized OPS variant could not at all complement ops. And although the barely detectable S318A fusion protein partially complemented ops single mutants, it was absolutely ineffective in the rescue of brx ops double mutants, unlike the BRX-OPS or OPS-BRX fusions. Notably, the observation that rootward-localized OPS fulfills its function in protophloem differentiation could also mean that OPS polarity is still necessary as long as it is apicobasal. For example, if OPS would contribute to the interpretation or generation of some apoplastic cue, it might not matter whether it is localized rootward or shootward as long as it is polar. In summary, the most parsimonious interpretation of our data at this point is that shootward polar localization is indeed not a major determinant of OPS activity, unlike the charge in its S318 phosphosite.
Materials and Methods
Plant Materials, Growth Conditions, and β-Glucuronidase Assay.
The Arabidopsis wild-type line used in this study was Col-0, which was also the genetic background for the mutants and transgenic lines. The null mutant alleles brx-2 and ops-2 were used throughout. Mutant genotyping was performed as previously described (15). For plant tissue culture, seeds were surface-sterilized, germinated, and grown vertically on half-strength Murashige and Skoog agar media under continuous light at 22 °C. For visualization of β-glucuronidase assay (GUS) reporter activity, 5‐d‐old seedlings or cultured cotyledons were incubated in X‐gluc staining buffer solution at 37 °C for 2 h in darkness.
Constructs and Generation of Transgenic Lines.
Reporter transgenes for plant transformation were created in suitable binary vectors and produced through standard molecular biology procedures and/or Gateway Cloning Technology. The OPS::OPS-GFP line has been described previously (15). The OPSE319K fragment was cloned from genomic DNA template isolated from the brx-2 suppressor line 1.3.4.a (20). For OPSS318K, OPSS318E, OPSE319R, OPSS318K+E319K, OPSδ107−149, OPSδ351−379, OPSδ442−468, OPSδ583−614, and OPSδ626−868, a site-directed mutagenesis approach (Kapa Biosystems) was used. In all cases, the template was the previously described plasmid containing the OPS coding sequence (15). For OPSmyr, OPSL1, and BdOPSL1, corresponding fragments were obtained by direct amplification of genomic DNA. For AmOPSL1 and AmOPSL2, Arabidopsis codon-optimized fragments were obtained by gene synthesis (GeneArt) (Dataset S2). For OPSmutNES, OPSNES2NLS, and OPSS318A, corresponding fragments were obtained by gene synthesis (GeneArt) as well. For both OPS-BRX and BRX-OPS fusions, individual coding sequences were fused by standard cloning procedures. All DNA fragments described above were introduced into the pH7m24GW binary vector or the pH7mGW34 binary vector to obtain CITRINE fusion proteins. For the OPS and BRX promoters, the described 1.9-kb and 3-kb fragments, respectively, upstream of the start codon were used (15). All binary constructs were introduced into Agrobacterium tumefaciens strain GV3101 pMP90 and transformed into Arabidopsis using the floral dip method. Oligonucleotide sequences for amplification of the various DNA fragments are listed in Dataset S2.
Microscopy.
To visualize fluorescent fusion proteins, seedlings were stained with propidium iodide (PI) and examined under a Zeiss LSM700 inverted confocal microscope with excitation at 488 nm and detection with a 490- to 500-nm band path filter for GFP and CITRINE and excitation at 555 nm and detection with a 560-nm long‐path filter for PI. PI staining of 7-d-old seedlings was also used for quantification of protophloem gaps and meristem size. For colocalization experiments, dual-color images were acquired by sequential line switching, allowing the separation of channels by both excitation and emission. For transverse sections, roots were embedded in plastic resin, sectioned, stained with 0.1% toluidine blue, and visualized using a Leica DM5500 compound microscope, essentially as described (15). For presentation, composite images had to be assembled in various instances.
VISUAL, Protein Isolation, Immunoprecipitation, and Western Blotting.
VISUAL was performed as described (29) with the following modifications: Plants were grown for 6 d before their dissected cotyledons were incubated in induction media for 3 d. Cotyledons were subsequently ground in sample buffer [400 mM sucrose, 50 mM Tris⋅HCl, pH 7.5, 2.5 mM EDTA, 0.5% Triton, proteinase inhibitor mixture (Roche), 5 mM PMSF]. Cell debris was removed by centrifugation at 4 °C and 13,000 × g for 30 min. Supernatant (3 mg of total protein extract) was incubated with anti-GFP beads (GFP-Trap_MA, Chromotek) for 1 h with rotation at 4 °C. Beads were magnetically separated and protein was eluted in SDS sample buffer at 95 °C for 10 min. Samples were loaded on an SDS/PAGE gel for electrophoresis and subsequently Western-blotted with anti-GFP antibodies or analyzed by LC-MS/MS.
Transient Expression in Tobacco and Colocalization Analysis.
For transient expression experiments, the fourth to sixth leaves of tobacco plants (N. benthamiana) were used for infiltration as described (34). The transgenes were expressed under the control of the constitutive 35S promoter. To enhance transgene expression levels, the coinfiltration expression system boosted by the AMCV-P19 gene-silencing suppressor was used. For all colocalization experiments, three replications were performed, and four to six areas were analyzed each time. Colocalization was quantified with the JACoP tool in Image J (35). For each combination of BIN2 and OPS variants, Pearson’s coefficients were calculated in ≥15 randomized images acquired at the same settings.
Supplementary Material
Acknowledgments
We thank Dr. Yeon Hee Kang for starting materials and Dr. P. Anne for comments on the manuscript. This work was supported by the Swiss National Science Foundation (Schweizerischer Nationalfonds zur Förderung der Wissenschaftlichen Forschung) (Grants 31003A_166394 and SXPHI0_142000 to C.S.H.).
Footnotes
The authors declare no conflict of interest.
This article is a PNAS Direct Submission.
This article contains supporting information online at www.pnas.org/lookup/suppl/doi:10.1073/pnas.1703258114/-/DCSupplemental.
References
- 1.Nance J, Zallen JA. Elaborating polarity: PAR proteins and the cytoskeleton. Development. 2011;138:799–809. doi: 10.1242/dev.053538. [DOI] [PMC free article] [PubMed] [Google Scholar]
- 2.Benková E, et al. Local, efflux-dependent auxin gradients as a common module for plant organ formation. Cell. 2003;115:591–602. doi: 10.1016/s0092-8674(03)00924-3. [DOI] [PubMed] [Google Scholar]
- 3.Benjamins R, Scheres B. Auxin: The looping star in plant development. Annu Rev Plant Biol. 2008;59:443–465. doi: 10.1146/annurev.arplant.58.032806.103805. [DOI] [PubMed] [Google Scholar]
- 4.Zourelidou M, et al. Auxin efflux by PIN-FORMED proteins is activated by two different protein kinases, D6 PROTEIN KINASE and PINOID. eLife. 2014;3:3. doi: 10.7554/eLife.02860. [DOI] [PMC free article] [PubMed] [Google Scholar]
- 5.Barbosa IC, et al. Phospholipid composition and a polybasic motif determine D6 PROTEIN KINASE polar association with the plasma membrane and tropic responses. Development. 2016;143:4687–4700. doi: 10.1242/dev.137117. [DOI] [PubMed] [Google Scholar]
- 6.Swarup R, et al. Localization of the auxin permease AUX1 suggests two functionally distinct hormone transport pathways operate in the Arabidopsis root apex. Genes Dev. 2001;15:2648–2653. doi: 10.1101/gad.210501. [DOI] [PMC free article] [PubMed] [Google Scholar]
- 7.Pfister A, et al. A receptor-like kinase mutant with absent endodermal diffusion barrier displays selective nutrient homeostasis defects. eLife. 2014;3:e03115. doi: 10.7554/eLife.03115. [DOI] [PMC free article] [PubMed] [Google Scholar]
- 8.Takano J, et al. Polar localization and degradation of Arabidopsis boron transporters through distinct trafficking pathways. Proc Natl Acad Sci USA. 2010;107:5220–5225. doi: 10.1073/pnas.0910744107. [DOI] [PMC free article] [PubMed] [Google Scholar]
- 9.Alassimone J, et al. Polarly localized kinase SGN1 is required for Casparian strip integrity and positioning. Nat Plants. 2016;2:16113. doi: 10.1038/nplants.2016.113. [DOI] [PubMed] [Google Scholar]
- 10.Dong J, MacAlister CA, Bergmann DC. BASL controls asymmetric cell division in Arabidopsis. Cell. 2009;137:1320–1330. doi: 10.1016/j.cell.2009.04.018. [DOI] [PMC free article] [PubMed] [Google Scholar]
- 11.Scacchi E, et al. Dynamic, auxin-responsive plasma membrane-to-nucleus movement of Arabidopsis BRX. Development. 2009;136:2059–2067. doi: 10.1242/dev.035444. [DOI] [PubMed] [Google Scholar]
- 12.Truernit E, Bauby H, Belcram K, Barthélémy J, Palauqui JC. OCTOPUS, a polarly localised membrane-associated protein, regulates phloem differentiation entry in Arabidopsis thaliana. Development. 2012;139:1306–1315. doi: 10.1242/dev.072629. [DOI] [PubMed] [Google Scholar]
- 13.Mouchel CF, Briggs GC, Hardtke CS. Natural genetic variation in Arabidopsis identifies BREVIS RADIX, a novel regulator of cell proliferation and elongation in the root. Genes Dev. 2004;18:700–714. doi: 10.1101/gad.1187704. [DOI] [PMC free article] [PubMed] [Google Scholar]
- 14.Bonke M, Thitamadee S, Mähönen AP, Hauser MT, Helariutta Y. APL regulates vascular tissue identity in Arabidopsis. Nature. 2003;426:181–186. doi: 10.1038/nature02100. [DOI] [PubMed] [Google Scholar]
- 15.Rodriguez-Villalon A, et al. Molecular genetic framework for protophloem formation. Proc Natl Acad Sci USA. 2014;111:11551–11556. doi: 10.1073/pnas.1407337111. [DOI] [PMC free article] [PubMed] [Google Scholar]
- 16.Furuta KM, et al. Plant development. Arabidopsis NAC45/86 direct sieve element morphogenesis culminating in enucleation. Science. 2014;345:933–937. doi: 10.1126/science.1253736. [DOI] [PubMed] [Google Scholar]
- 17.Truernit E, et al. High-resolution whole-mount imaging of three-dimensional tissue organization and gene expression enables the study of phloem development and structure in Arabidopsis. Plant Cell. 2008;20:1494–1503. doi: 10.1105/tpc.107.056069. [DOI] [PMC free article] [PubMed] [Google Scholar]
- 18.Rodriguez-Villalon A, Gujas B, van Wijk R, Munnik T, Hardtke CS. Primary root protophloem differentiation requires balanced phosphatidylinositol-4,5-biphosphate levels and systemically affects root branching. Development. 2015;142:1437–1446. doi: 10.1242/dev.118364. [DOI] [PubMed] [Google Scholar]
- 19.Scacchi E, et al. Spatio-temporal sequence of cross-regulatory events in root meristem growth. Proc Natl Acad Sci USA. 2010;107:22734–22739. doi: 10.1073/pnas.1014716108. [DOI] [PMC free article] [PubMed] [Google Scholar]
- 20.Depuydt S, et al. Suppression of Arabidopsis protophloem differentiation and root meristem growth by CLE45 requires the receptor-like kinase BAM3. Proc Natl Acad Sci USA. 2013;110:7074–7079. doi: 10.1073/pnas.1222314110. [DOI] [PMC free article] [PubMed] [Google Scholar]
- 21.Kang YH, Hardtke CS. Arabidopsis MAKR5 is a positive effector of BAM3-dependent CLE45 signaling. EMBO Rep. 2016;17:1145–1154. doi: 10.15252/embr.201642450. [DOI] [PMC free article] [PubMed] [Google Scholar]
- 22.Kang YH, Breda A, Hardtke CS. Brassinosteroid signaling directs formative cell divisions and protophloem differentiation in Arabidopsis root meristems. Development. 2017;144:272–280. doi: 10.1242/dev.145623. [DOI] [PMC free article] [PubMed] [Google Scholar]
- 23.Li J, Chory J. A putative leucine-rich repeat receptor kinase involved in brassinosteroid signal transduction. Cell. 1997;90:929–938. doi: 10.1016/s0092-8674(00)80357-8. [DOI] [PubMed] [Google Scholar]
- 24.Li J, Nam KH. Regulation of brassinosteroid signaling by a GSK3/SHAGGY-like kinase. Science. 2002;295:1299–1301. doi: 10.1126/science.1065769. [DOI] [PubMed] [Google Scholar]
- 25.Yin Y, et al. BES1 accumulates in the nucleus in response to brassinosteroids to regulate gene expression and promote stem elongation. Cell. 2002;109:181–191. doi: 10.1016/s0092-8674(02)00721-3. [DOI] [PubMed] [Google Scholar]
- 26.Zhu JY, Sae-Seaw J, Wang ZY. Brassinosteroid signalling. Development. 2013;140:1615–1620. doi: 10.1242/dev.060590. [DOI] [PMC free article] [PubMed] [Google Scholar]
- 27.Anne P, et al. OCTOPUS negatively regulates BIN2 to control phloem differentiation in Arabidopsis thaliana. Curr Biol. 2015;25:2584–2590. doi: 10.1016/j.cub.2015.08.033. [DOI] [PubMed] [Google Scholar]
- 28.Sugiyama N, et al. Large-scale phosphorylation mapping reveals the extent of tyrosine phosphorylation in Arabidopsis. Mol Syst Biol. 2008;4:193. doi: 10.1038/msb.2008.32. [DOI] [PMC free article] [PubMed] [Google Scholar]
- 29.Kondo Y, et al. Vascular cell induction culture system using Arabidopsis leaves (VISUAL) reveals the sequential differentiation of sieve element-like cells. Plant Cell. 2016;28:1250–1262. doi: 10.1105/tpc.16.00027. [DOI] [PMC free article] [PubMed] [Google Scholar]
- 30.Ohtani M, Akiyoshi N, Takenaka Y, Sano R, Demura T. Evolution of plant conducting cells: Perspectives from key regulators of vascular cell differentiation. J Exp Bot. 2017;68:17–26. doi: 10.1093/jxb/erw473. [DOI] [PubMed] [Google Scholar]
- 31.Liesche J, Martens HJ, Schulz A. Symplasmic transport and phloem loading in gymnosperm leaves. Protoplasma. 2011;248:181–190. doi: 10.1007/s00709-010-0239-0. [DOI] [PMC free article] [PubMed] [Google Scholar]
- 32.Kondo Y, Fujita T, Sugiyama M, Fukuda H. A novel system for xylem cell differentiation in Arabidopsis thaliana. Mol Plant. 2015;8:612–621. doi: 10.1016/j.molp.2014.10.008. [DOI] [PubMed] [Google Scholar]
- 33.De Rybel B, et al. Chemical inhibition of a subset of Arabidopsis thaliana GSK3-like kinases activates brassinosteroid signaling. Chem Biol. 2009;16:594–604. doi: 10.1016/j.chembiol.2009.04.008. [DOI] [PMC free article] [PubMed] [Google Scholar]
- 34.Bracha-Drori K, et al. Detection of protein-protein interactions in plants using bimolecular fluorescence complementation. Plant J. 2004;40:419–427. doi: 10.1111/j.1365-313X.2004.02206.x. [DOI] [PubMed] [Google Scholar]
- 35.Bolte S, Cordelières FP. A guided tour into subcellular colocalization analysis in light microscopy. J Microsc. 2006;224:213–232. doi: 10.1111/j.1365-2818.2006.01706.x. [DOI] [PubMed] [Google Scholar]
Associated Data
This section collects any data citations, data availability statements, or supplementary materials included in this article.


