Significance
When we grasp an object, thousands of tactile nerve fibers become activated and inform us about its physical properties (e.g., shape, size, and texture). Although the properties of individual fibers have been described, our understanding of how object information is encoded in populations of fibers remains primitive. To fill this gap, we have developed a simulation of tactile fibers that incorporates much of what is known about skin mechanics and tactile nerve fibers. We show that simulated fibers match biological ones across a wide range of conditions sampled from the literature. We then show how this simulation can reveal previously unknown ways in which populations of nerve fibers cooperate to convey sensory information and discuss the implications for bionic hands.
Keywords: mechanoreceptor, tactile afferent, somatosensory periphery, skin mechanics, computational model
Abstract
When we grasp and manipulate an object, populations of tactile nerve fibers become activated and convey information about the shape, size, and texture of the object and its motion across the skin. The response properties of tactile fibers have been extensively characterized in single-unit recordings, yielding important insights into how individual fibers encode tactile information. A recurring finding in this extensive body of work is that stimulus information is distributed over many fibers. However, our understanding of population-level representations remains primitive. To fill this gap, we have developed a model to simulate the responses of all tactile fibers innervating the glabrous skin of the hand to any spatiotemporal stimulus applied to the skin. The model first reconstructs the stresses experienced by mechanoreceptors when the skin is deformed and then simulates the spiking response that would be produced in the nerve fiber innervating that receptor. By simulating skin deformations across the palmar surface of the hand and tiling it with receptors at their known densities, we reconstruct the responses of entire populations of nerve fibers. We show that the simulated responses closely match their measured counterparts, down to the precise timing of the evoked spikes, across a wide variety of experimental conditions sampled from the literature. We then conduct three virtual experiments to illustrate how the simulation can provide powerful insights into population coding in touch. Finally, we discuss how the model provides a means to establish naturalistic artificial touch in bionic hands.
The human hand is endowed with thousands of mechanoreceptors of different types distributed across the skin, each innervated by one or more large myelinated nerve fibers (1). These fibers convey detailed information about contact events and provide us with an exquisite sensitivity to the form and surface properties of grasped objects (2, 3). During object manipulation and tactile exploration, the glabrous skin of the hand undergoes complex spatiotemporal mechanical deformations, which in turn, drive very precise spiking responses in individual afferents. Coarse object features, such as edges and corners, are reflected in spatial patterns of activation in slowly adapting type I (SA1) and rapidly adapting (RA) fibers, which are densely packed in the fingertip (3, 4). At the same time, interactions with objects and surfaces elicit high-frequency, low-amplitude surface waves that propagate across the skin of the finger and palm and excite vibration-sensitive Pacinian (PC) afferents all over the hand (5–8).
Recording the activity of tactile nerve fibers in monkeys or humans is technically difficult, is slow, and generally yields responses from a single unit at a time (9, 10). Although such recordings have yielded powerful insights into the neural basis of touch, they provide a limited window into the information that the hand conveys to the brain, which is distributed over thousands of responding fibers.
To fill this gap, we have developed a model with which we can simulate the responses of all mechanoreceptive afferents that innervate the palmar surface of the hand to arbitrary spatiotemporal patterns of skin stimulation, taking into account skin biomechanics and receptor biophysics. Model parameters are derived from spiking data obtained from monkeys and validated by reproducing both the strength of and temporal patterning in the responses of afferents to a wide range of stimuli, measured independently in monkeys and humans by several research groups, including our own. With the model, we can simulate in real time the responses of hundreds of afferents to stimuli of arbitrary complexity. We anticipate that the model will be an important tool in somatosensory research to characterize the peripheral representation of tactile stimuli. The model will also be useful in providing somatosensory feedback through interfaces with the peripheral nerve for use in neuroprosthetic devices by converting the output of touch sensors on the prosthesis into biomimetic afferent responses, which can then be implemented through electrical stimulation (11–13).
Results
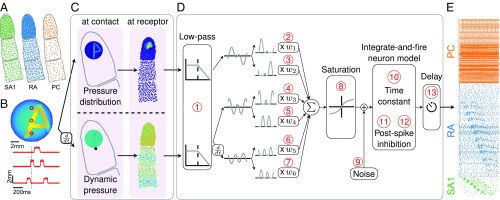
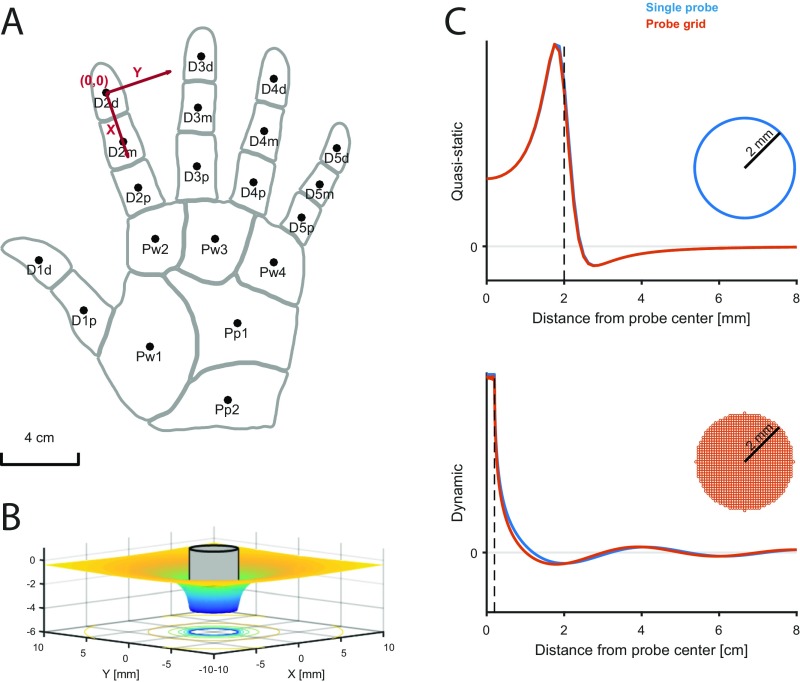
The objective is to simulate the responses of tactile afferents across the glabrous skin of the hand to arbitrary spatiotemporal deformations of the skin. To this end, we randomly terminate SA1, RA, and PC afferents over the palmar surface of the hand according to their respective innervation densities, which vary across locations (14) (Fig. 1A). When a given stimulus is applied passively to the hand, the model estimates the spiking response of those afferents through two sequential stages, mimicking the mechanotransduction process (Methods): a skin mechanics stage and a spike generation stage. In the first stage, the stresses resulting from the stimulus are estimated at the receptor location as two distinct components: a quasistatic component caused by the redistribution of pressure applied to the surface of the skin and a dynamic component resulting from the variations of this pressure with time (Fig. 1 B and C). The quasistatic component confers to tactile fibers response properties resulting from contact mechanics, such as edge enhancement and surround suppression (15, 16). The dynamic component propagates through the skin surface as a wave and confers to afferents the ability to respond to vibration at a distance from the contact point (5). In the second stage, the resulting stresses are used as inputs to integrate-and-fire (IF) models (Fig. 1D)—with parameters separately derived for each afferent—that produce as output the spiking responses of individual afferents to the stimulus (Fig. 1E). Each spiking model comprises up to 13 free parameters (Methods) and is fit to each fiber individually, so that the population simulations incorporate within-class differences in response properties, which play a role in neural coding (17). We extensively tested the model architecture to verify that each component and free parameter was required to achieve accurate and precise response predictions and avoid overfitting (Methods).
Fig. 1.
Overview of the model. (A) Receptors are distributed across the skin given the known innervation densities of SA1, RA, and PC afferents. (B) The stimulus—in this case, a vibrating embossed letter A scanned across the skin—is defined as the time-varying depth at which each small patch of skin (here dubbed a pin) is indented (with a spatial resolution of 0.1 mm). The traces in Lower show the time-varying depth at the three locations on the skin indicated by the red dots in Upper. (C) The mechanics model relies on two parts: (Upper) modeling the distribution of stresses using a quasistatic elastic model and (Lower) modeling dynamic pressure and surface wave propagation. Left shows the surface deformation of the skin, and Right shows the resulting pattern of stresses at the location of the receptors. (D) The spiking responses are determined by leaky IF models using different sets of up to 13 parameters (marked in red numbers) for individual SA1, RA, and PC afferents fit based on peripheral recordings to skin vibrations. Adapted from ref. 71. (E) The output of the model is the spike train of each afferent in the population. Raster of the response of the afferent population sampled as in A to the stimulus shown in B (only active afferents are included). Note that the SA1s (in contact) only encode the spatial aspect of the stimulus, that the PCs encode from the whole finger phase-lock with the 200-Hz vibration, and that the RAs show mixed spatial and vibration responses.
Model Fitting and Validation.
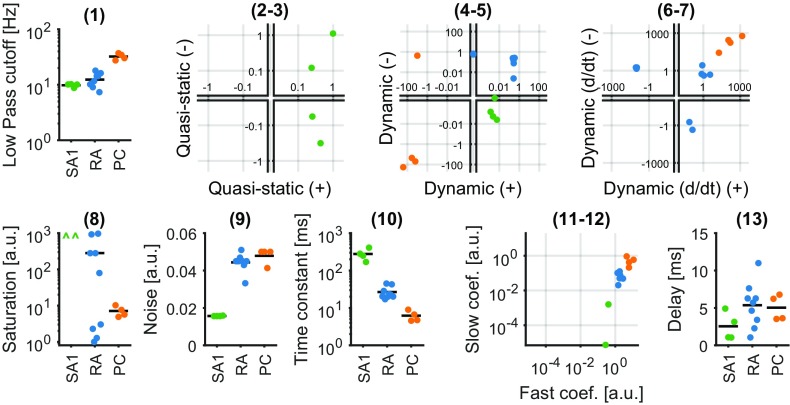
Three neurophysiological datasets (from ref. 18) were used to fit and validate the model, each consisting of afferent responses (recorded from rhesus macaques) to a different class of vibrations imposed on the skin: sinusoidal, bandpass noise, and diharmonic vibrations. First, responses to sinusoids and bandpass noise, spanning the tangible range of frequencies (1–1,000 Hz), were used as the training data to find the best fitting parameters for each afferent (Methods). The fitted parameters for individual IF models were clustered by afferent class, reflecting differences in the response properties of the different classes (Fig. S1). Second, responses to diharmonic stimuli (with components spanning a wide range of frequencies), simulated using the previously fitted parameters, were compared with their measured counterparts to validate the models. To this end, we compared both the firing rates and precise spike timing of the measured and simulated responses. In total, four SA1, nine RA, and four PC provided sufficiently complete and reliable training and validation data to be used as a basis for model fitting.
Fig. S1.
Parameters for individual afferent models by type. Values generally cluster by afferent type, reflecting the observed differences in response properties across afferent classes and similarities within class. (1) Low-pass filter cutoff frequency. (2 and 3) Weights for positive and negative components of quasistatic stress (set to zero for RA and PC). (4 and 5) Weights for positive and negative components of dynamic stress. (6 and 7) Weights for positive and negative components of dynamic stress derivative (set to zero for SA1). (8) Saturation parameter (no saturation for SA1). (9) Gaussian noise added to the membrane potential (resting potential is zero, and a spike is triggered at one). (10) Membrane potential time constant. (11 and 12) Weights for the fast and slow components of the postspike inhibitory kernels. (13) Delay parameter accounting for conduction velocity.
Firing rates.
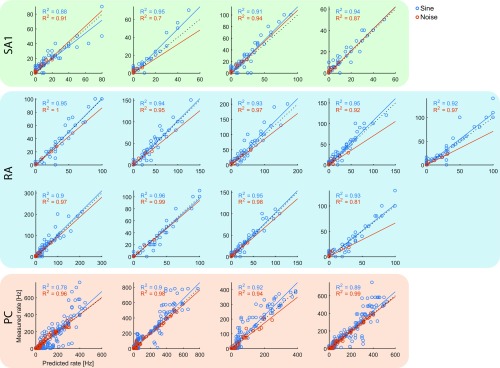
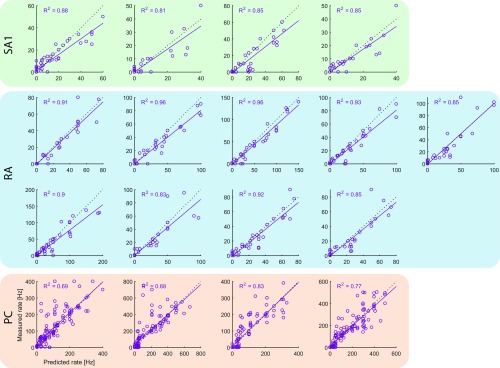
We found that the firing rates of simulated neurons closely match their measured counterparts [training data: (SD) and for sinusoidal and noise vibrations, respectively (Fig. S2); validation data: for diharmonic vibrations] (Fig. S3 and Table S1).
Fig. S2.
Measured vs. predicted firing rates for all fitted models on the training data (blue, sinusoidal; red, noise). Dotted lines denote unity, whereas solid lines denote best fits. Table S1 shows slopes, intercepts, and a breakdown of the total error.
Fig. S3.
Measured vs. predicted firing rates for all fitted models on the test data (diharmonic vibrations). Dotted lines denote unity, whereas solid lines denote best fits. Table S1 shows slopes, intercepts, and a breakdown of the total error.
Table S1.
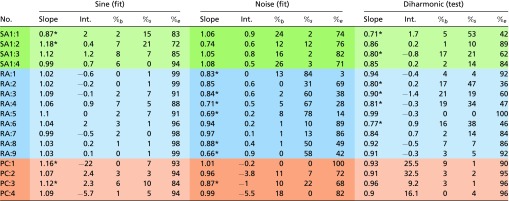 |
Lighter shaded columns on the left correspond to sinusoidal fits, darker shaded columns in the middle correspond to the noise fits, and lighter shaded columns on the right correspond to the diharmonic (validation) set. Slope columns contain best fits for predicted vs. measured firing rates. Intercept (Int.) columns contain intercepts for the best fit. Significance level was set at 0.05 and Bonferroni-corrected according to all tests run in the table; %b, %s , and %e denote the percentages of the variance unaccounted for by the fits that are attributable to bias (wrong intercepts), attributable to inconsistency (wrong slopes), or unexplainable, respectively. As evident from the table, bias is generally negligible, and some fits are mildly inconsistent but not systematically so across datasets.
*Instances where the slopes deviate significantly from one.
Spike timing precision.
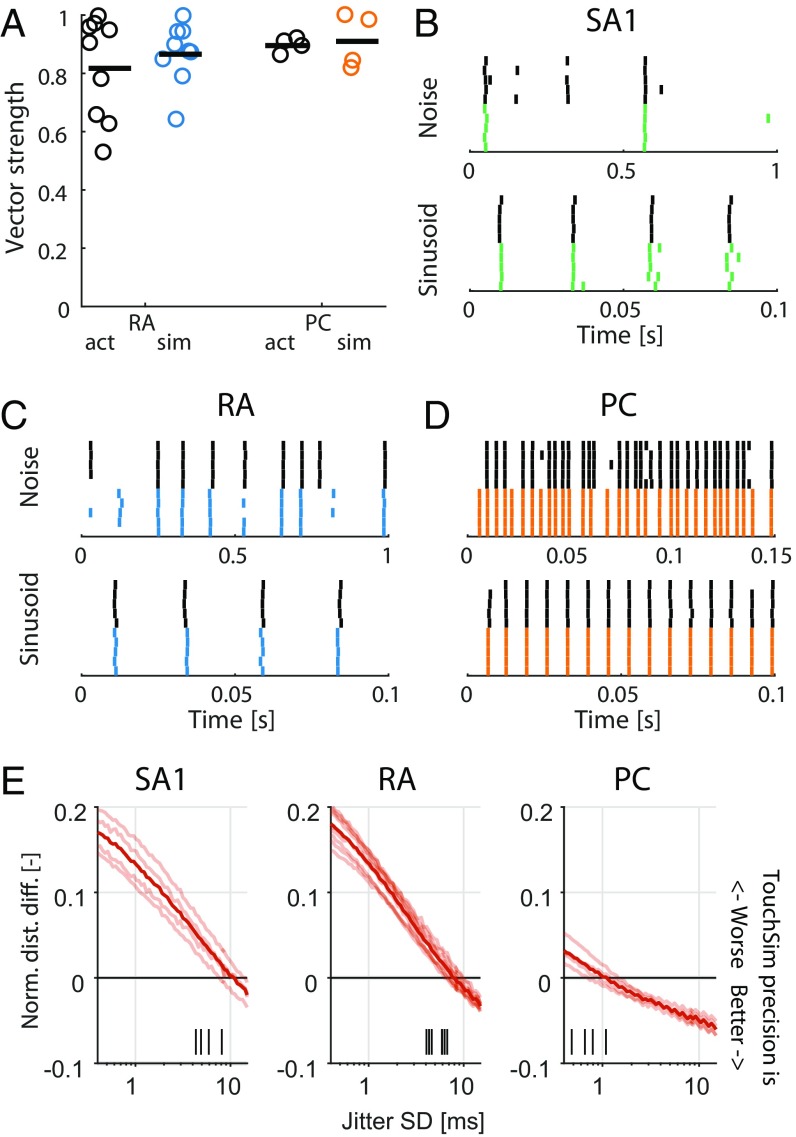
In early neurophysiological experiments investigating tactile coding in the nerve, Mountcastle and coworkers (9) observed that cutaneous mechanoreceptive afferents exhibit very precise and repeatable timed responses to vibratory stimuli. The importance of spike timing in tactile coding has since been established across a variety of sensory continua, including vibratory frequency, surface texture, surface curvature, and direction of tangentially applied forces (19–22). With these observations in mind, we tested the degree to which simulated responses reproduced the fine temporal structure of afferent responses, particularly those of RA and PC fibers, which are precise down to single-digit milliseconds. First, as the amplitude of a sinusoid increases, the phase of each spike advances and then stabilizes around the tuning point (i.e., at the amplitude that elicits one spike per cycle), a phenomenon that is also exhibited by simulated RA and PC afferents (examples are in Fig. S4 A and B). Second, at the tuning point, both real and simulated RA and PC afferents respond with precisely timed spikes as evidenced by vector strengths—a metric of phase-locking (23)—near one (Fig. 2A). Third, simulated responses to complex stimuli match their measured counterparts with high temporal precision (Fig. 2 B–D). To quantify the precision of the match, we computed the distance between simulated and measured responses to diharmonic vibrations (the validation dataset) at different time scales, ranging from submilliseconds to tens of milliseconds, using spike distance as a metric (Methods). We then compared the temporal imprecision in the simulated responses with that resulting from jittering spikes. That is, we computed the spike distance between measured and jittered spikes with different amounts of jitter at different timescales. We could then determine how much we need to jitter the measured spike trains to achieve the level of temporal imprecision of our simulated responses. We found that all models achieved a temporal precision better than 8 ms (Fig. 2E). PC models were the most precise, down to submillisecond precision, whereas SA1 and RA models achieved precisions ranging from 3 to 8 ms. Note that the temporal precision of the simulated responses is well within the behaviorally relevant range. Indeed, PC responses are most informative at a temporal resolution of 2 ms, RA responses are most informative at a temporal resolution of about 5 ms, and SA1 responses are most informative at even coarser timescales (20, 24).
Fig. S4.
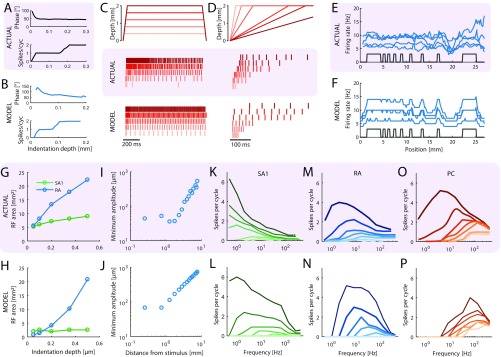
Additional response properties. (A and B) Examples of (Upper) phase advance and (Lower) entrainment plateaus exhibited by a (A) recorded and (B) simulated RA afferent at a vibratory frequency of 40 Hz. A was reproduced from ref. 30. (C) Responses of a recorded (75) and modeled SA1 afferent to ramp-and-hold indentations at different depths. (D) Responses of a recorded (26) and modeled RA afferent to different ramp speeds. For both C and D, Top shows the indentation depth of the probe over time, Middle shows actual responses of afferents recorded in humans, and Bottom shows the responses of simulated afferents. (E and F) Edge enhancement. Firing rates for (E) recorded and (F) simulated RA afferents as a function of their location with respect to bar stimuli (shown in gray). Recorded and simulated RA fibers exhibit little spatial modulation; overall firing rates are also lower than for SA1 afferents. E was reproduced from ref. 33. (G and H) RF size vs. indentation depth for (G) actual and (H) simulated afferents. Although RF sizes are relatively independent of indentation depth for SA1 fibers, those of RA fibers grow with increasing depth, a property also exhibited by simulated afferents. G was reproduced from ref. 29. (I and J) Minimum amplitude required to elicit a response as a function of distance from the RF hot spot for (I) actual and (J) modeled RA afferents. The minimum amplitude begins to rise sharply at about 1 mm distance in both actual and modeled afferents. I was reproduced from ref. 30. (K–P) Mean population response strength for recorded (77) and simulated (K and L) SA1, (M and N) RA, and (O and P) PC afferents to sinusoidal stimulation at different amplitudes and frequencies. The darkest lines correspond to the highest amplitudes used (1 mm peak to peak), and every lighter shade corresponds to a decrease in amplitude by 6 dB, down to –36 dB.
Fig. 2.
Spike timing. (A) Vector strength for actual (black) and modeled (blue and orange) RA afferents at 40 Hz and PC afferents at 300 Hz. Horizontal lines denote averages. (B–D) Recorded (black tick marks) and simulated (colored) spike trains for example (B) SA1, (C) RA, and (D) PC afferents in response to a noise and a sinusoidal stimulus. (E) Normalized difference in the spike distance between modeled and jittered spike trains to measured spike trains for the three afferent classes as a function of jitter level. Shaded lines show means for individual afferent, and dark lines show means across afferents. Vertical black ticks indicate the points at which the models become significantly worse than the jittered data.
Response Properties Captured by the Model.
In the following section, we systematically compare simulated afferent responses with published data from the literature across a variety of well-established response properties and examine the extent to which the model, fit to measured responses to vibrations, accounts for afferent responses observed in various other experimental contexts. Although some response properties are built into the model—such as edge enhancement, which falls out of the mechanics model—and others are specifically targeted in the fitting process—such as phase-locking to sinusoidal stimuli—we also test a number of properties that are not explicitly built in. These properties include receptive field (RF) size, response to ramp-and-hold stimuli, and responses to spatial patterns (such as letters or dots) scanned across the skin. The extent to which the model captures these properties is indicative of how well it captures the underlying mechanisms and thereby, generalizes to new stimulus spaces.
Adaptation.
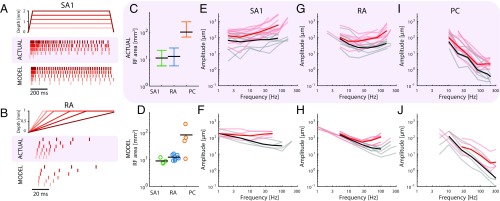
One of the most striking differences between afferent types is their response to ramp-and-hold indentations: whereas SA1 afferents respond to the onset and hold phase (but not its offset), RA afferents respond strongly to onset and offset but not the hold phase. Simulated afferents also exhibit these canonical properties, a phenomenon that is not explicitly built into the model (Fig. 3 A and B and Fig. S4 C and D). Furthermore, the responses of simulated afferents to ramp-and-hold indentations match those of their biological counterparts in two other ways: SA1 firing rates increase linearly as indentation depth increases (25), and RA firing rates increase monotonically with indentation rate (26).
Fig. 3.
Basic response properties of simulated afferents. (A) Measured responses of an SA1 afferent to ramp-and-hold indentations at different depths (from ref. 75) and simulated responses of an SA1 fiber to those same stimuli. (B) Measured responses of an RA afferent to ramps at different speeds (from ref. 26) and simulated responses of an RA fiber to the same stimuli. In A and B, Top shows the indentation depth of the probe over time, Middle shows actual responses of afferents recorded in humans, and Bottom shows the responses of simulated afferents. (C) RF sizes (black, median; error bars, 25th and 75th percentiles) measured for SA1, RA, and PC afferents (27). (D) RF sizes of simulated afferents when stimulated and estimated in the same way as in C. The models exhibit the property that RA fibers tend to have larger RFs than SA1 fibers and that PC fibers have by far the largest RFs. (E, G, and I) Measured absolute (black) and tuning (red) thresholds for (E) SA1, (G) RA, and (I) PC afferents at different frequencies (76). (F, H, and J) Modeled absolute (black) and tuning (red) thresholds, corresponding to data shown in E, G, and I.
RF size.
A second well-known difference across afferent classes is in the size of their RFs. First, we measured the RF size of simulated afferents at a fixed amplitude relative to threshold (as is typically done) and reproduced published results (27, 28): SA1 afferents had the smallest RFs (around 10 ), RA afferents had slightly larger ones, and PC RFs were roughly an order of magnitude larger still (Fig. 3 C and D). Second, we investigated how RF size changes with indentation depth. As is the case with recorded afferents (29), the RFs of simulated RA fibers grow roughly linearly with indentation depth, but the size of SA1 RFs is independent of indentation depth (Fig. S4 G and H). Third, we examined how threshold amplitude grows with distance from the RF center for RA afferents. Indeed, threshold increases sharply as one proceeds outward from the RF center (30), a phenomenon that is also observed in the simulated responses (Fig. S4 I and J). Fourth, simulated PC fibers that innervate the palm respond to light touch on the fingertip (31), whereas SA1 and RA afferents only respond to local stimulation, mirroring their biological counterparts.
Frequency response.
A third well-documented difference in the response properties of mechanoreceptive afferents is in their frequency sensitivity profile. First, we examined how absolute thresholds—the minimum amplitude that elicits a spike—vary with frequency (tested with sinusoids). We found that the threshold–frequency functions of simulated afferents closely track those reported in the literature. SA1 afferents have high thresholds across all frequencies (Fig. 3 E and F); RA afferents exhibit their lowest thresholds at frequencies below 100 Hz, yielding minimum thresholds of around 10 m (Fig. 3 G and H); and PC afferents are most responsive at 200–300 Hz, where submicrometer amplitudes are sufficient to elicit spikes (Fig. 3 I and J). Second, we found that the frequency dependence of the tuning thresholds of simulated fibers—the minimum amplitude at which they fired at least one spike per cycle—mirrored their measured counterparts closely (red traces in Fig. 3 E–J). Third, we tested model predictions of rate intensity functions across a wide range of frequencies and found that, again, these closely matched their experimentally derived counterparts (Fig. S4 K–P).
Spatial representations.
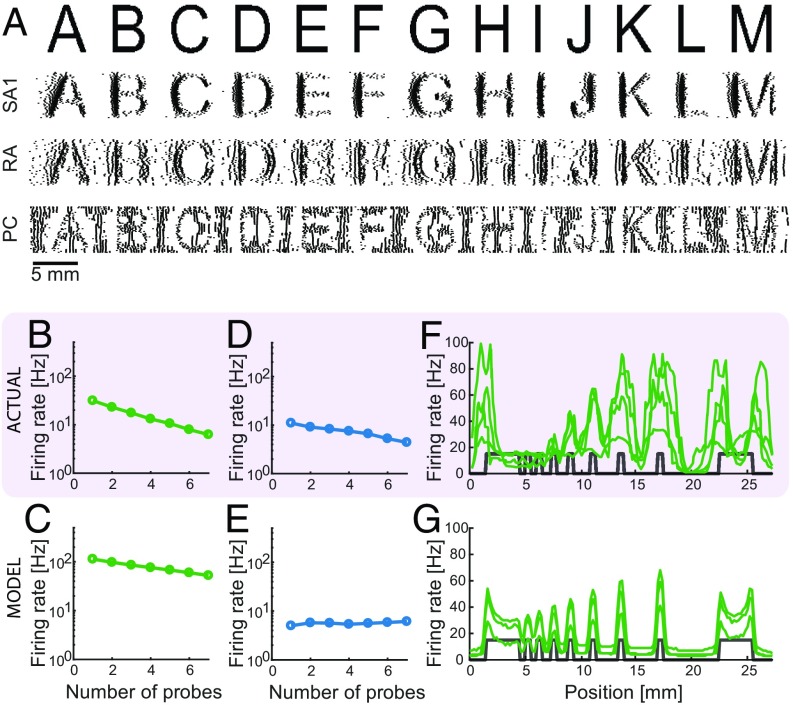
SA1 and RA afferents have been shown to carry information about the shape of objects in the spatial pattern of their activity (4). That is, the spatial configuration of stimuli applied to the surface of the skin is reflected in the spatial pattern of activation in these two afferent populations, drawing analogies to visual representations in the retina (32). Furthermore, spatial representations carried by SA1 fibers are sharper than those carried by RA fibers. Simulated SA1 and RA responses exhibit spatial patterning, with SA1 responses yielding sharper images than their RA counterparts (Fig. 4A). The responses of SA1 and RA fibers to spatial patterns also differ in their susceptibility to spatial interactions. SA1 responses are enhanced for edges and suppressed for spatially extended flat stimuli, whereas RA afferents exhibit little to no surround suppression and edge enhancement (33–35). In agreement with these findings, simulated SA1 but not RA afferents exhibit substantial surround suppression (Fig. 4 B–E) and edge enhancement (Fig. 4 F and G and Fig. S4 E and F).
Fig. 4.
Spatial representation. (A) Reconstruction of the SA1, RA, and PC signals for various letters scanned across the skin (4). (B–E) Surround suppression. Average firing rates for (B and D) recorded (34) and (C and E) simulated (B and C) SA1 and (D and E) RA afferents as a function of the number of probes that are contacting the skin. Both recorded and simulated SA1 afferents exhibit stronger surround suppression than their RA counterparts. (F and G) Edge enhancement. Firing rates for (F) recorded (33) and (G) simulated SA1 afferents as function of their location with respect to bar stimuli (shown in gray). Edges of bars evoke higher firing rates for both recorded and simulated afferents.
Insights from Simulated Populations.
As summarized above, simulated tactile fibers exhibit many response properties that have been documented over the last half-century (we did not test them all). Indeed, the match between simulated and measured responses is nearly perfect, down to millisecond spike timing. Next, we wished to simulate entire populations of afferents and examine their responses to a few classes of stimuli. Indeed, unlike electrophysiological experiments, which are limited to recording from a single mechanoreceptive fiber or tiny fractions of all fibers at a time, this stimulation allows for detailed view of the entirety of the sensory signals that the hand sends the brain. In the model, the palmar surface of the hand is innervated by around 12,500 afferents with measured densities that depend on location and afferent type. Overall, SA1 fibers outnumber PC fibers by a factor of two, and RA fibers, in turn, outnumber SA1 fibers by a factor of two. Furthermore, each fingertip contains just under 1,000 fibers, whereas the much more expansive palm contains only 4,000 in total.
Population statistics for basic tactile stimuli.
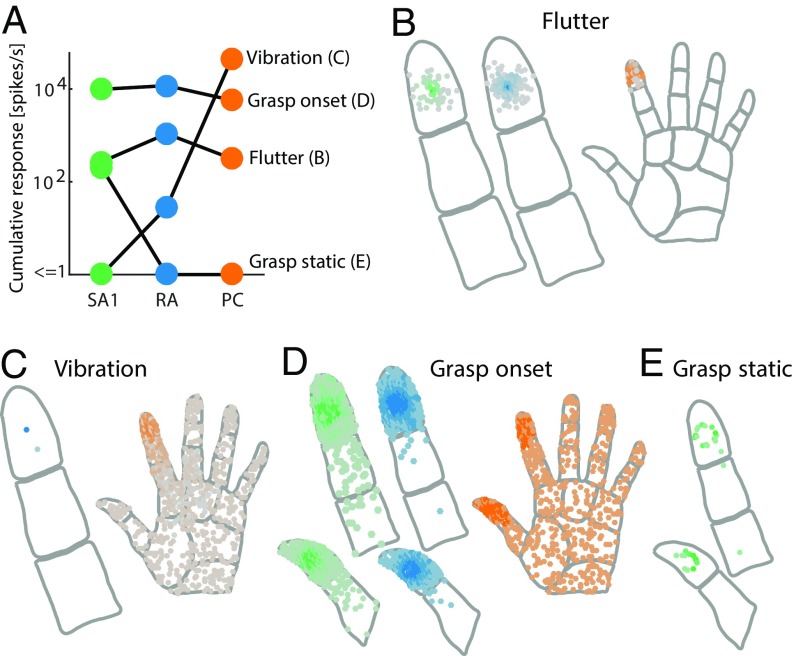
We simulated the responses of the somatosensory nerves to different tactile stimuli: two skin vibrations (one low-frequency flutter and one high-frequency vibration), which are commonly used in experiments on touch, and the onset and hold phase of a two-fingered grasp. First, we found that almost all tactile experiences elicit responses in more than one and typically all afferent populations (Fig. 5A).Second, the total number of spikes per second varied over several orders of magnitude across different stimuli and afferent populations. For example, tactile flutter of moderate intensity will generally evoke hundreds of spikes per second in the SA1 or RA populations (Fig. 5B), whereas a high-frequency vibration can evoke up to 100,000 spikes per second across the PC population (Fig. 5C). Third, only a tiny fraction of the total number of SA1 and RA fibers (up to 3%) is active for any stimulus, and the responding fibers are all tightly clustered around the contact location(s); however, some stimuli, such as the high-frequency vibration and the onset of a grasp, activate almost all PC fibers on the glabrous skin, and these fibers are distributed over the entire surface of the hand (Fig. 5D and Movies S1 and S2). In general, then, the total number of active PC fibers dwarfs that of active SA1 or RA fibers, although PC fibers innervate the skin only sparsely. Fourth, dynamic stimuli, such as vibrations, or rapid force changes, such as during grasp onset, will elicit many more spikes than static ones, such as the hold period during a grasp, which only excites SA1 afferents and does so only weakly (Fig. 5E).
Fig. 5.
Population responses for different tactile experiences. (A) Total number of spikes per second across simulated SA1, RA, and PC populations for four different types of tactile stimuli, the response distributions of which are shown in B–E. Spike counts across different afferent populations and stimuli vary by several orders of magnitude. Generally, all afferent types respond to a given stimulus, but in rare cases, a whole afferent population might be silent. (B) Spatial distribution of afferent responses (green, SA1; blue, RA; orange, PC) to a flutter stimulus (15 Hz) applied to the D2 fingertip through a small circular probe. Movie S1 shows a representation of the response over time. (C) Spatial distribution of responses for a 300-Hz vibration. Note that PC afferents located all over the hand respond to this stimulus. (D) Spatial distribution of responses during the onset of a two-finger grasp executed with D1 and D2. The sudden contact and fast ramp up of the contact force cause PC afferents all over the hand to respond, whereas only SA1 and RA afferents close to the contact locations respond. (E) Spatial distribution of responses during the static (hold) period of a two-finger grasp. RA and PC afferents are silent, whereas the SA1 afferent directly at the contact location responds weakly. Movie S2 shows a representation of the grasp response over time.
Next, we conducted two more simulated experiments: one in which edges were indented into the skin at different orientations and one in which textured surfaces were scanned across the skin in different directions. We then estimated the degree to which the afferent population activity conveyed information about edge orientation or motion direction and characterized the time course over which this information evolved.
Decoding edge orientation.
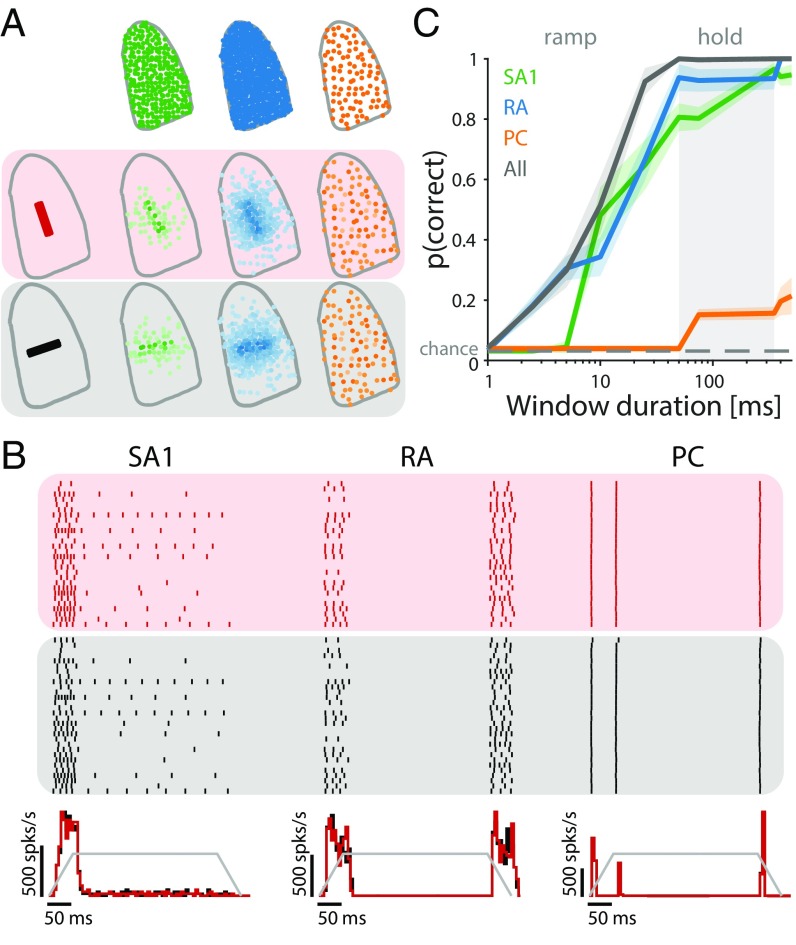
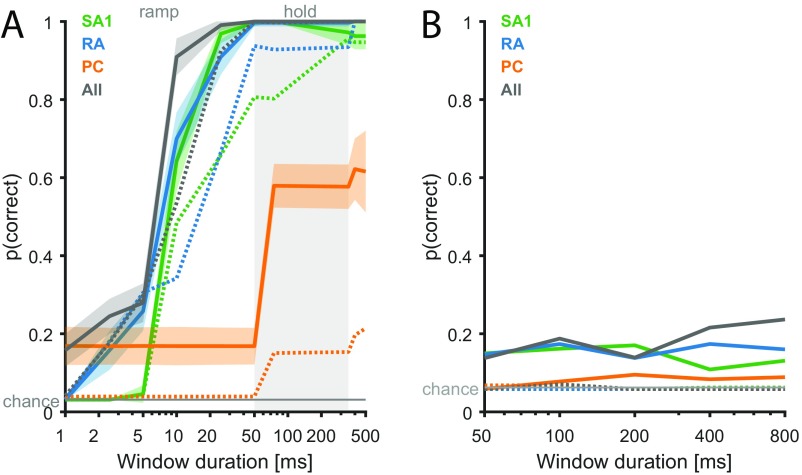
We simulated the responses of the entire afferent population to edges indented into the fingertip at 32 different orientations (Fig. 6A). We wished to examine the extent to which edge orientation could be decoded from afferent responses, either solely from the spatial layout of their response (36, 37) or from temporal spiking patterns as well (24, 38). As expected, SA1 fibers responded strongly at the onset of the indentation and tended to maintain their response through the hold period (albeit weakly), whereas RA and PC fibers responded during the onset and offset ramps only (Fig. 6B). The spatial distribution and strength of the response depended on orientation for SA1 and RA but not PC fibers (Fig. 6A). We then attempted to classify the orientation of a bar based on the responses that it evoked either based on spike counts alone or taking the temporal spiking patterns into consideration (Methods). First, we found that we could decode edge orientation from the RA and SA1 but not PC population responses (independently) within a few tens of milliseconds solely based on spike count distributions over the entire population (Fig. 6C). Critically, the observed discrimination latencies (∼40–50 ms to reach perfect discrimination) are comparable with those observed in a similar experiment carried out in humans using microneurography. The latency to reach perfect discrimination of curvature based on the timing of the first couple of spikes in ensembles of afferents was found to be around 40 ms (21). This match in timing further corroborates the claim that the temporal precision of the models, this time measured at the population level, is similar to that of measured afferent populations. Interestingly, SA1 and RA populations carry signals that are equally informative about orientation, contrary to what might be expected based on their single-unit responses (33, 39). Indeed, individual SA1 fibers tend to convey more precise information about spatial form, but this advantage at the single-cell level seems to be compensated for by the greater number of RA fibers. Second, taking the timing of spikes evoked in the afferent populations into account (19, 20, 24, 38) only slightly improved classification performance, suggesting that the orientation information conveyed in the spatial pattern of activation dwarfs that conveyed in the timing of spikes (Fig. S5A). Third, combining responses from the populations led to a significant boost in performance after 10 ms. Signals from the two populations of afferents thus have a cooperative effect, an observation only made possible by examining population responses.
Fig. 6.
Insights from population responses: decoding the orientation of an indented edge. (A, Upper) Sampled afferent populations (SA1 in green, RA in blue, and PC in orange). (A, Lower) Their response strengths to indented edges at 2 of 32 orientations tested (0° and 90°). Darker colors indicate higher firing rates. (B, Upper) Responses of 30 selected SA1 and RA fibers to edge indented at two different orientations depicted in red and black. (B, Lower) Peri-stimulus time histogram (PSTH) of the afferent population response for each type to the two orientations, with the temporal profile of the stimulus superimposed in gray. (C) Classification performance for each afferent type as well as the total population for different window durations using spike count. Lines are means, and shaded areas show the SDs; the dashed lines denote chance level.
Fig. S5.
Classification of edge orientation and motion direction. (A) Edge orientation classification accuracy (over 32 orientations) for each afferent type and different window durations using a 2-ms temporal resolution ( 500). Dotted lines show the performance for 0 for comparison (as in Fig. 6C). Lines are means, and shaded areas show SDs over afferents. (B) Motion direction classification accuracy (over 16 directions) for each afferent type and different window durations using raw spike trains. Solid lines show performance based on spike count ( 0), whereas dotted lines are based on a 2-ms temporal resolution ( 500). Shaded areas show SD across afferents.
Decoding direction of motion.
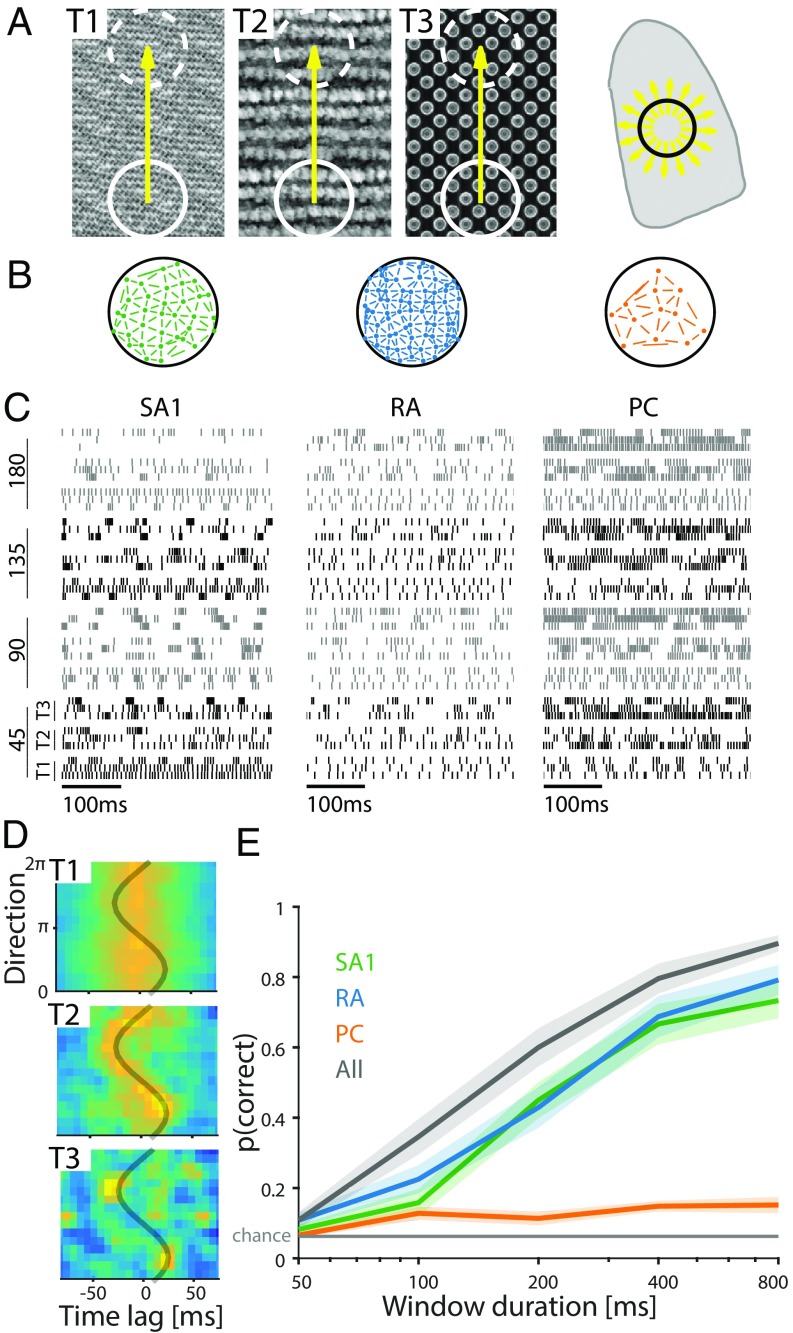
We simulated afferent responses to three textured surfaces scanned across the skin in 16 different directions at a speed of 20 mm/s (Methods and Fig. 7 A and B). We wished to assess the degree to which information about motion direction could be extracted from the responses of populations of afferents independent of texture, which also strongly modulates afferent responses (20, 40, 41). As might be expected, simulated responses differed markedly across classes and textures but perhaps less obviously, across scanning directions (Fig. 7C). First, we attempted to decode motion direction (across textures) based on spike counts and temporal spiking patterns (as we had done with orientation). We found that classification performance based on spike counts was only slightly above chance, and taking spike timing into consideration only made it worse (Fig. S5B). As expected, both firing rates and spike patterning of individual afferent responses are strongly impacted by the texture itself (20, 40, 41) and much less so by motion direction. Second, we sought to examine whether the correlated activity across pairs of neurons was informative about direction. Indeed, adjacent neurons along the scanning direction experience the same stimulus at different times, and therefore, in principle, direction of motion can be inferred from correlated patterns of afferent activation. However, afferents are not identical, and therefore, their response to the same stimulus will not be identical; it remains to be elucidated whether the responses are sufficiently similar to yield discernible correlations. To test this possibility, we selected pairs of adjacent neurons within the contact area (Fig. 7B) and computed the cross-correlogram of the most responsive pairs (Fig. 7D shows an example). We found that we could classify movement direction based on these correlograms with high accuracy (Fig. 7E). Again, combining responses from the three afferent populations led to improved performance, suggesting a cooperative effect of direction signals carried by the different populations of nerve fibers. These results suggest that a coincidence detection mechanism is likely required to extract information about motion direction from afferent responses (in the absence of shear force) (42).
Fig. 7.
Insights from population responses: decoding the direction of textured surfaces scanned across the finger. (A, Left) Three textured surfaces were scanned along the direction indicated by the yellow arrow over a patch of fingertip (denoted by the circle superimposed on the fingertip in A, Right) in 16 directions (shown with arrows on the fingertip). (B) Location of sampled afferents over the contact area for each class. Segments between afferents show pairs selected to compute cross-correlations. (C) Responses of three example afferents to different textures (labeled T1–T3 in A) scanned in four directions (angles on the left are relative to distal direction). (D) Cross-correlogram of a selected RA pair in response to 16 different directions. The gray trace shows the expected peak in the cross-correlogram given a pair of identical neurons responding to a sinusoidal grating. The resulting trace is a cosine with amplitude that is determined by distance between the RFs divided by the stimulus speed and phase that depends on their relative orientation. (E) Performance of the direction classifier (across textures) using correlograms for each afferent type and different window durations. Solid lines denote means, and shaded areas are SEMs.
These experiments yielded three findings about neural coding in the somatosensory nerves that would not have been possible without population-level analysis. (i) The advantage of individual SA1 fibers in spatial processing seems to be largely compensated for at the population level by the greater number of RA fibers. (ii) Orientation can be accurately decoded from population spike counts within a short period (10 ms), which may obviate the need for fast computations based on spike timing that were thought to be necessary to guide object manipulation (21) but require more sophisticated neural circuitry to achieve. (iii) The signals carried by different populations of afferents complement one another and together, are more informative than the signals carried by any one population. This third observation has important implications for neural coding in touch. Indeed, the tactile coding of any one stimulus feature (shape, motion, texture, etc.) has historically been ascribed to a single population, deemed a specialist for extracting information about that feature. Although this dogma has recently been called into question based on results from single units (3), this analysis shows that some forms of interplay between submodalities can only be observed at the population level.
The objective of the two simulated experiments was not to yield a definitive conclusion as to the peripheral neural code for orientation or motion direction. Rather, we wished to illustrate the potential of the model to address fundamental questions about sensory coding in neural populations by allowing us to quickly test hypotheses and perform complex analyses on a huge amount of tactile responses without having to carry out a single experiment.
Discussion
Limitations of the Model.
Although the model faithfully reproduces key response properties of tactile afferents, it is also subject to a number of limitations. First, we are able to simulate SA1, RA, and PC but not slowly adapting type II (SA2) fibers. Indeed, the models are based on electrophysiological data obtained from rhesus macaques, which are devoid of SA2 afferents (43).
Second, the models were derived from responses to stimuli that were indented into the skin and therefore, do not incorporate lateral sliding and the concomitant shear forces. Rather, scanning is mimicked by moving an “image” of the indentation pattern across the skin frame by frame. Note, however, that tangential forces are often highly correlated with normal ones during sliding (44), and therefore, this approximation is sufficient under most circumstances. The model also does not incorporate the effect of fingerprints on texture responses (7) or the onset of slip (45). Tangential sliding and its onset are governed by the friction between the skin and object surface, which is a complex mechanical problem that is not yet fully understood (46). As our understanding of how tangential forces shape afferent responses improves, this aspect can be incorporated into the model.
Third, the skin mechanics model treats the skin as a flat surface, when in reality, it is not. The 3D shape of the skin matters during large deformations of the fingertip. For example, pressing the fingerpad on a flat surface causes the skin on the side of the fingertip to bulge out, which in turn, causes receptors located there to respond (47, 48). Such complicated mechanical effects can be replicated using finite element mechanical models (49) but not using the continuum mechanics (CM) model adopted here. To the extent that friction is a critical feature of a stimulus—for example, when sliding a finger across a smooth, sticky surface—or that the finger geometry plays a critical role in the interaction between skin and stimulus—as in the example of high-force loading described above—the accuracy is compromised. Under most circumstances, the model will capture the essential elements of the nerves’ response.
Fourth, SA1 and RA afferents have been shown to exhibit complex RFs with multiple hotspots (24, 50), because single afferents innervate multiple mechanoreceptors (43, 51). Afferent branching is not currently implemented in the model; rather, RFs comprise a single hotspot and are isotropic. However, the model can be readily elaborated to accommodate afferent branching, particularly when we better understand the mechanisms by which input from the various mechanoreceptors is integrated to drive the afferent response (52).
Applications.
The proposed model can be a powerful tool to investigate the sense of touch. Indeed, recording the responses of human or monkey afferents is technically challenging and only yields responses from a single fiber at a time. Even multielectrode arrays only yield responses from a sparse sample of afferents (53) or the aggregate activity of a large number of fibers (54, 55). The model allows us to simulate the responses of entire populations of afferents to arbitrarily complex stimuli. These simulated responses can be used to (i) test peripheral neural codes (as illustrated above with the two simulated experiments), (ii) assess the degree to which the results from psychophysical experiments can be accounted for based on population response (56), and (ii) investigate how sensory representations are transformed as one ascends the somatosensory neuraxis (cf. ref. 57).
Also, the model will be valuable in neuroprosthetic applications that aim to restore the sense of touch through peripheral nerve interfaces (58–60). Indeed, the output of sensors on the prosthesis during object contact can be used as input to the simulated afferents, which then provide an accurate representation of how the nerve from an intact hand would respond to object contact. This biomimetic pattern can then be effected in the residual nerve of an amputee by delivering spatially and temporally patterned stimulation pulse trains designed to evoke the desired nerve activation (11, 12, 17). The implementation is computationally efficient and can run in real time (SI Methods). In the context of neuroprosthetics, the model can also be used as a benchmark against which to compare simpler encoding algorithms and determine the circumstances under which their behavior diverges from that of nerves in an intact arm.
Methods
The model of peripheral afferents is structured in two distinct sequential stages to capture the structure of the mechanotransduction process (Fig. 1). In the first stage, we compute the deformations experienced by individual receptors given a stimulus applied to the surface of the skin. In the second stage, we compute based on this receptor deformation the spiking response of the nerve fiber using an IF mechanism.
Stimulus.
A stimulus is defined as the time-varying positions of a set of pins indented into the skin in the direction orthogonal to the skin surface. Each pin makes contact with the skin over a circular area of adjustable radius and can move up and down independent of the other pins. The location of a pin with respect to where it will touch the hand is fixed over time using a coordinate system centered on the fingertip of the index finger (Fig. S6A). A stimulus can be defined by a single pin (corresponding to a circular probe indented into the skin) or multiple pins, which together form a shape (say an edge, a letter, or a curved surface). Pin indentations are independent of each other and can, therefore, form arbitrary spatiotemporal patterns of indentation.
Fig. S6.
Skin mechanics model. (A) Schematic of the hand used in the model. The reference coordinate system is centered on the center of the index fingertip. Different hand regions are defined that determine the innervation densities of the different afferent types. (B) Skin deflection profile resulting from the indentation of a circular pin (shown in gray; radius mm). (C, Upper) Quasistatic and (C, Lower) dynamic components resulting from a 200-Hz vibration exerted with a single pin (radius 2 mm; blue trace) or a grid of evenly spaced pins (spacing 0.1 mm; radius 0.05 mm). Receptor depth was set to 0.5 mm.
Skin Mechanics.
The skin of the fingers and palm is known to have complex, nonlinear mechanics (61–63), with properties that vary widely over different spatial and temporal scales (64, 65). Modeling the precise skin deformation resulting from a given stimulus requires advanced models (66, 67), measurements of individual skin properties (68), many parameters, and considerable computing power. Because we aimed to simulate the responses of whole populations of afferents in quasireal time, we did not attempt to estimate the exact deformation state of the finger but instead, simplified the problem by evaluating mechanical quantities that have been shown to be highly predictive of afferent responses. Accordingly, we focused on two quantities that are strongly associated with neural responses but over different frequency ranges: (i) the local vertical stress based on a quasistatic elastic model of the skin, mainly affecting receptor responses at low frequencies (<100 Hz) (16) and (ii) dynamic variations in pressure propagated across the skin as surface waves, mainly affecting receptor responses at higher frequencies (5, 6). These two quantities are then combined in the spiking model and differentially weighted depending on afferent type. For instance, SA1 afferents are most sensitive to statically indented spatial patterns, and therefore, the quasistatic component is strongly weighted in SA1 models. Conversely, PC afferents do not respond to static indentations but are extremely sensitive to high-frequency vibrations even far away from the center of their RF; therefore, PC models will feature a strong dynamic component.
Quasistatic component.
The quasistatic component of the model is inspired by an existing CM model of afferent responses (15, 16). CM offers two important benefits: (i) it provides analytical solutions and is, therefore, fast to compute, and (ii) it provides very accurate predictions of the responses of type I afferents (SA1 and RA) to spatial patterns indented into the skin (16). In the CM model, the skin is assumed to be a homogeneous, isotropic, elastic half-space, and the stimulus (i.e., the spatiotemporal pattern of indentations) is applied at the free border of this half-space. The surface of the object is considered to be frictionless and therefore, produce load only in the direction perpendicular to the skin. In the original version of the model, each stimulus pin was described as punctate (that is, with infinitely small diameter). We modified this by defining each pin as a circular punch. This modification has the benefit that large circular pins indenting the skin (i.e., circular probes as commonly used in tactile experiments) can be modeled using a single pin rather than a large number of them, speeding up computation considerably. The deflection produced by a single pin is calculated as follows (Fig. S6B) (69):
| [1] |
| [2] |
| [3] |
where r is the distance from the center of the pin, u is the vertical skin deflection at distance r, p is the force acting on the pin, is the radius of the pin, k is the stiffness of the skin viewed by this pin, is Young’s modulus, and denotes Poisson’s ratio. This expression was later generalized to multiple pins (15), adopting the following matrix form:
| [4] |
| [5] |
| [6] |
where n is the total number of pins, x and y are the coordinates of each pin, u is a vector containing the indentation depth of each pin, and p is a vector containing the force exerted by each pin. R is a matrix containing the Euclidian distances between pins ( is the distance between pin i and pin j).
The stresses acting on each receptor are then obtained in a two-step procedure. First, the indentation depth profile (i.e., the indentation depth of each pin, which constitutes the input of the model) is converted to an indentation force profile (i.e., the force applied by each pin to the surface of the skin). This conversion is achieved by solving the linear system presented in Eq. 6 for p. Because pins can only push into the skin but not pull on it, all pins exerting a negative force (pulling) are removed (because they would not actually be in contact with the skin). The subsystem is then iteratively resolved until all remaining pins exert a positive force (i.e., pushing into the skin) as done in earlier models (16). Second, the stresses acting on a receptor are obtained independently for each pin, and then, their effects are summed by applying the superposition principle. This calculation is made by using the analytical expression of the stresses resulting from the indentation of a circular pin by a force p in the elastic half-space as obtained by Harding and Sneddon (69). The analytical expressions are reported in SI Methods. Note that these expressions assume a particular pressure distribution, and this assumption is not valid when two pins are very close to each other. Nevertheless, the error is negligible if the pin radius is sufficiently small compared with the afferent depth (Fig. S6C). The afferent depth was set according to the literature (51) and is the same for all afferent models (SA1 depth is 0.3 mm, RA is 0.2 mm, and PC is 2 mm). Most stress components have been shown to be highly correlated with afferent responses (16). Here, we chose the vertical component of the stress tensor (i.e., the stress perpendicular to the skin surface), because this component was previously shown to be a very good predictor of both SA1 and RA responses, and it is consistent with the dynamic component described below.
Dynamic component.
High-frequency vibrations applied to the fingertip, elicited, for example, during making and breaking contact with objects or scanning the finger across a textured surface, travel across the finger and palm and have been recorded as far away as the wrist (5, 6, 8). In the model, we wished to incorporate such surface waves resulting from pin movement. First, the indentation velocity profile is converted into a force variation profile using Eq. 6 as above but after replacing the stiffness coefficient k (Eq. 2) with a viscous coefficient c (c is arbitrarily set to one because of the lack of consistent measurement; therefore, the dynamic component has no unit). Second, the force variation of each pin is propagated to the receptor as a surface wave, with a decay of 1/r (5) and a propagation speed (group velocity) of 8 m/s (as measured in ref. 5 but constant across frequencies for simplicity). As in the quasistatic part, the stress acting on the receptor is obtained by summing the contribution of each pin.
IF Model.
The output of the skin mechanics model at all receptor locations is fed into IF models that generate spiking responses for each afferent. We fit the parameters of these models on electrophysiological recordings obtained previously (18). These models were similar to earlier ones (57, 70, 71), with some key differences. First, rather than simply using skin indentation depth (along with derivatives) as IF model input, we used the static and dynamic pressure as calculated from the skin mechanics model. This choice of input allowed us to reproduce response properties driven by skin mechanics, such as edge enhancement and surround suppression (Results), as well as effects caused by the propagation of dynamic pressure waves. Second, the models were fit on a wide variety of vibrotactile frequencies, ranging from 1 to 1,000 Hz, in contrast to earlier models, which were fit on much narrower stimulus sets (i.e., either low or high frequencies).
Each IF model works as follows (Fig. 1D). The mechanical input (both quasistatic and dynamic) is passed through a low-pass filter (parameter 1) (Fig. 1D) to accommodate the fact that afferents become nonresponsive above a certain (afferent type-specific) stimulation frequency. Then, the dynamic component is differentiated to obtain three signals (quasistatic, dynamic, and differentiated dynamic). Those three inputs can be interpreted as the three terms of a “lumped” mass–spring–damper model, with the quasistatic term being associated with the elastic stress, the dynamic term being associated with the damping, and the differentiated dynamic term being associated with the mass. Next, the three signals are split into positive and negative contributions and rectified, yielding six time-varying inputs (Fig. 1D), which are each multiplied by a weight (parameters 2–7) and summed. Then, the resulting time-varying trace is passed through a saturating nonlinearity, reflecting the fact that afferents’ responses saturate at high intensities (parameter 8). Next, Gaussian noise is added (parameter 9) to mimic the observed stochasticity in afferent responses, which is particularly evident for perithreshold stimuli (72). The resulting trace constitutes the input to a leaky IF model, with “membrane potential” that decays to zero with a characteristic time constant (parameter 10). When the potential hits one, a spike is triggered, the membrane potential is reset, and a postspike inhibitory kernel is added to the potential to build in refractoriness (parameters 11 and 12). The kernel consists of two parts: a fast component, which decays completely within 4 ms, and a slow component, which contributes maximally 8 ms after a spike is triggered and decays within 36 ms (a similar model is shown in ref. 71). In all fitted models, the first component was weighted more heavily than the second component, leading to initially strong but lingering weak inhibition after each spike. Finally, spikes are shifted in time by a small amount to mimic conduction delays (parameter 13), which are largely determined by where the recording was made (proximal vs. distal). An individual IF model, therefore, possesses 13 parameters: the low-pass cutoff frequency, the six weights, the saturation parameter, the noise term, the membrane leak time constant, two parameters to determine postspike inhibition, and the conduction delay. Not all parameters were required for all afferent models. SA1 models did not include a weight for the derivative of the dynamic pressure, because these afferents do not respond to high frequencies. SA1 models also did not include a saturation parameter. RA and PC models did not include weights for the static stress component, because these afferent types do not respond to constant indentations. Thus, SA1 models used 10 parameters, whereas RA and PC models were fit using 11 parameters each.
Fitting Procedure.
For model fitting, we used as a cost function the van Rossum spike distance (73), which yielded a measure of difference between the recorded and model-predicted spiking responses at a given temporal resolution (set by a time constant). We then optimized the model parameters (apart from the noise term, parameter 9; see below) using the patternsearch function in Matlab (The Mathworks, Inc.) using different starting positions. We used a time constant of 50 ms for the computation of the cost for SA1 and RA afferents and 20 ms for PC afferents. The parameters were both fit on responses to sinusoidal stimuli and bandpass noise traces (18). PC models were fit on all frequencies used in the stimulus set (ranging from 1 to 1,000 Hz). SA1 and RA models were only fit on frequencies between 1 and 150 Hz. After we had zeroed in on good parameter values, we further optimized the parameters using genetic algorithms (ga in Matlab) until they did not improve further. To fit the noise parameter, we first calculated the average spike distance between all pairwise combinations of the five recorded trials for each stimulus in the training data. We then adjusted the noise parameter, such that five simulated runs of the model on the same inputs resulted in the same average pairwise spike distance. In total, we fit single-afferent models to four SA1, nine RA, and four PC afferents.
Model Architecture Validation.
Our goal was to create a model that could recreate most afferent response properties described in the literature but that was simple enough to allow for fast computation. Furthermore, we wished to avoid overfitting and ensure that the parameters contributed to prediction accuracy. We, therefore, tested a number of simpler models, and we examined which response properties they could successfully recreate and where they failed. Additionally, these tests provide insights about which specific afferent response properties are driven by which model component.
Skin mechanics.
First, as shown previously in a number of studies (15, 16, 33, 35), the spatial profile of afferent response strength is not accurately predicted by the profile of the skin indentation. Indeed, as predicted by contact mechanics, the distribution of pressure (and therefore, the distribution of stresses inside the skin) is influenced, for example, by edges and the size of the contact area. A contact mechanics component is, therefore, required to incorporate all spatial response properties, such as edge enhancement, surround suppression, and RF sizes. Second, PC fibers are known to respond to vibration far away from their locations, which requires the wave propagation (dynamic) component of the model. However, incorporating skin mechanics is not necessary to achieve high spiking precision (for stimuli located directly above the receptor location), because previous models were able to reproduce precise spiking patterns evoked by vibrating probes without implementing a skin mechanics model (70, 71).
Frequency selectivity of different afferent types.
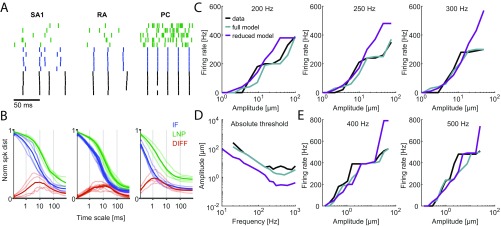
Selective weighting of the quasistatic, dynamic, and dynamic derivative inputs will yield models that differ in their frequency response and could, in principle, account for the SA1, RA, and PC frequency response profiles. To test whether a simple model using these inputs might be sufficient to model afferent response properties or whether a more complex spike initiation model is required, we implemented a linear–nonlinear–Poisson (LNP) model (SI Methods has details on the fitting process). This model assumes that spikes are generated by a nonhomogeneous Poisson process and does not include leakage, a spiking threshold, or refractoriness. We found that the LNP model was indeed able to fit and predict firing rates of the vibration datasets, although less accurately than the IF models [training data: (SD) and for sinusoidal and noise vibrations, respectively; validation data: for diharmonic vibrations] (Results has details on the IF fits). However, the precise spike timing was consistently much worse as shown using metric–space analysis of spikes trains at different timescales (from 0.1 to 100 ms) (Fig. S7 A and B). In particular, we found that the timing precision of the IF models surpassed that of the LNP models at the timescales that have been shown to be particularly informative for the different afferent classes (10 ms for SA1, 5 ms for RA, and 1 ms for PC) (19, 20, 24). An example of this timing precision is the ability of an afferent to phase-lock to sinusoidal stimuli at different frequencies and mechanical noise with different bandpass frequencies (Fig. 2).
Fig. S7.
Model validation. (A) Comparison of spike timing precision between the IF and LNP models. Shown are raster plots of spikes evoked in the three afferent classes by five repetitions of one of the diharmonic stimuli (Left, SA1; Center, RA; Right, PC). Both measured (black) and simulated spikes (IF in blue and LNP in green) are shown. (B) Normalized spike distance between measured and simulated spike trains as a function of timescale (1/). IF actual distance is in blue; LNP actual distance is in green. Shaded lines show the average distance across all conditions in the diharmonic vibration dataset for each afferent model. Dark lines show averages across afferents. Red traces (DIFF) show the difference between predictions of the two models: the IF model is better than LNP at all timescales but especially at the timescales that have been shown to be most informative for the different afferent classes (10 ms for SA1, 5 ms for RA, and 1 ms for PC). (C–E) Reduced model fits. Removing or clamping IF model parameters during the fitting process leads to impaired accuracy in reproducing well-known afferents response properties as illustrated in C–E. (C) Missing entrainment plateaus for a PC model at three different frequencies when the model was refit without postspike inhibition (parameters 11 and 12). (D) Absolute thresholds that were roughly one-half an order of magnitude too low when a PC model was refit with the decay variable clamped. (E) Excessive firing rates when a PC model was fit without a saturation term.
Individual IF parameters.
After verifying that the IF model yields more accurate predictions than a simpler spike generation model does, we next evaluated the contribution of individual IF model parameters. Indeed, some of these parameters (for example, the low-pass cutoff, the saturation, and the membrane leak time constant) affect model responses in similar and overlapping ways. To test whether these parameters were necessary to reproduce precise spiking, we fit models that either lacked one of these parameters or had the parameter “clamped” to a certain value during the fitting process (SI Methods). We found that removing any of these parameters considerably reduced the model’s ability to reproduce key response properties; the most notable problems were missing entrainment plateaus (Fig. S7C shows a model with no postspike inhibition), thresholds off by an order of magnitude (Fig. S7D, clamped membrane leak time constant), and excessively high firing rates (Fig. S7E, no saturation). These effects can be explained by the fact that we are fitting complex, frequency-dependent response properties, and precisely matching those properties requires several parameters.
Spike Timing.
Metric space analysis.
To measure the degree to which simulated responses matched their measured counterparts, we used a spike distance metric with an adjustable temporal resolution (74), which we have previously done (19, 20). In this metric, the distance between two spike trains is obtained by computing the lowest possible cost for transforming one train into the other. Adding or deleting a spike incurs a cost of one, whereas moving a spike costs q per unit time. Therefore, by varying the parameter q, we can assess the degree to which the timing of the spikes matches at different levels of temporal precision. Specifically, when q is set to zero, distance is determined solely by the difference in spike count. At higher values of q, moving spikes becomes more costly than adding or removing them, and therefore, the timing of individual spikes increasingly determines spike distance, which remains low if timing is precise. Therefore, the distance increases with q and converges to the sum of spike count in the two spike trains when q tends to infinity (which is equivalent to removing all spikes from the first train and then inserting the spikes from the second train). In all of our timing analyses, the distances between the measured spike trains and the simulated spike trains were measured at 50 log-spaced timescales ranging from 0.1 ms to 1 s (corresponding to q values ranging from 10,000 to 1). The distances obtained were then normalized by the sum of spike counts in the two spike trains, yielding normalized distances that ranged from zero to one, to make them comparable with each other (Figs. S7B and S8 show examples).
Fig. S8.
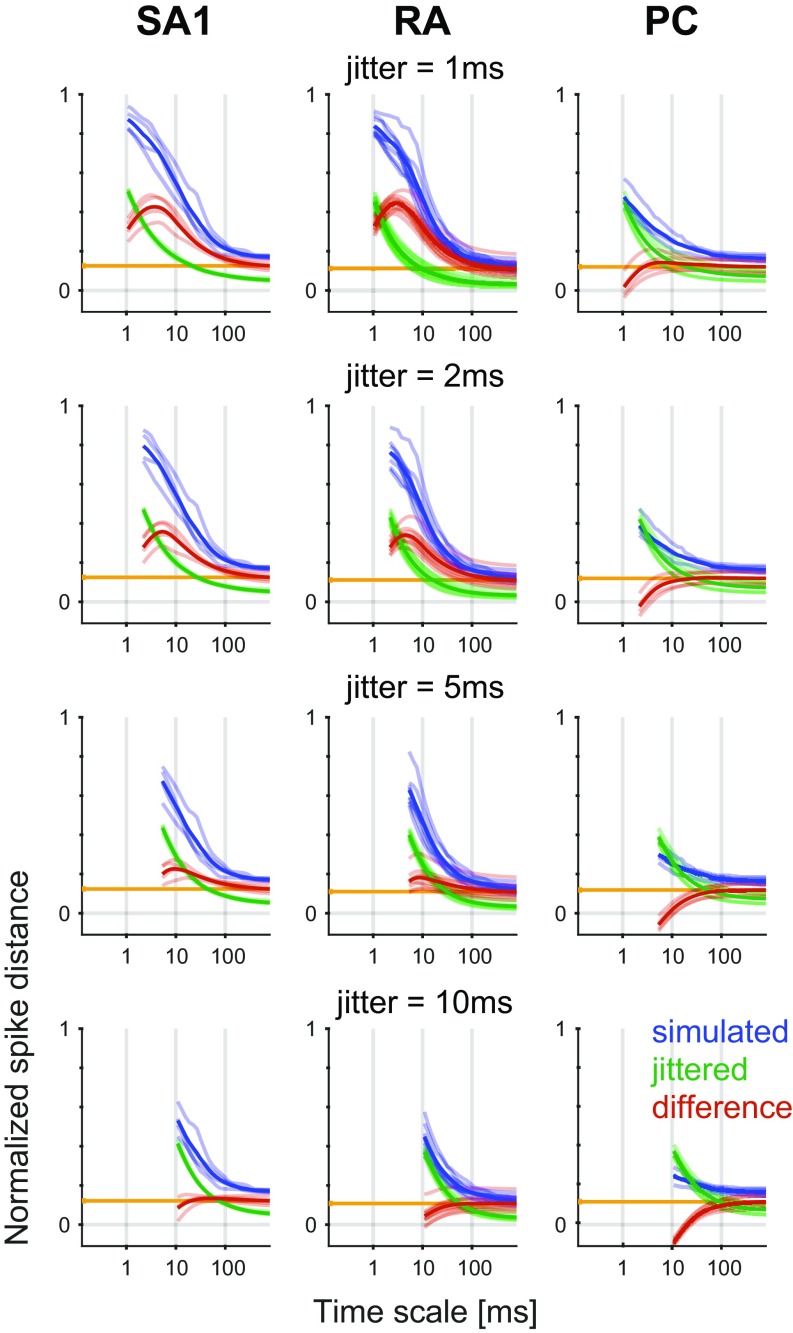
Spike timing precision. Difference in normalized distance between simulated (blue) and jittered (green) spike trains to measured spike trains for three afferent classes as a function of temporal resolution. The pairwise difference between the two distances is shown in red. Each row corresponds to a different jitter SD value (1, 2, 5, and 10 ms). Shaded lines show means for individual afferents, and dark lines show means across afferents. The orange vertical lines correspond to the mean distance differences caused by difference in spike count. The red line being below the orange line indicates that the simulated responses are closer to the measured response than the jittered ones.
Timing precision of the model.
For each experimental condition (from a total of 138 different diharmonic stimuli) and each afferent, pairs of spike trains were used to obtain a distance at every time scale. Pairs consisted of either measured and simulated spike trains or measured responses from two different repetitions with temporal jitter added to the second repetition. Jitter was sampled randomly from a zero-mean Gaussian distribution with a given SD and added to each spike. We tested SDs ranging from 0.5 to 50 ms. The resulting two distances, measured/modeled (shown in blue in Fig. S8) and measured/measured + jittered (shown in green in Fig. S8), were then subtracted to yield a measure of which comparison spike train is closer to the measured data (shown in red in Fig. S8). A positive value indicates that jittered trains are closer, and a negative value indicates that simulated trains are closer. This difference in spike distance was averaged across all timescales above the jitter SD value and computed for each jitter SD value (shown in Fig. 2E). We used a t test to determine whether this averaged difference (corrected for the spike count error) (shown in orange in Fig. S8) was statistically greater than zero, meaning that the model was worse (one-tailed t test, alpha = 0.05). The lowest jitter value for which no significant effect was observed was defined as the precision of the model.
Simulated Experiments.
Procedures.
Edge indentation.
Simulated edges (8-mm length and 1.6-mm width) were indented at the center of the index fingertip to a depth of 1 mm for 400 ms, including a 50-ms on ramp, a 300-ms hold phase, and a 50-ms off ramp; 32 equally spaced orientations were tested, each repeated 10 times. In addition to the intrinsic noise in the afferent spiking model, we added experimental variability in the form of Gaussian noise in the exact stimulus position (isotropic with 0.5 mm SD) to mimic jitter in the stimulus presentation as well as small movements of the fingertip.
Texture scanning.
Three different texture samples were selected from a previously used dataset (7, 20): one fine texture (wool gabardine), one coarse texture (upholstery), and a dot pattern (2-mm interdot spacing). Texture profiles (obtained by profilometry) were used as inputs to the model (with surfaces approximated as rigid). The contact area was defined as circular (with a radius of 4 mm), and the resolution (pin spacing) was set to 0.1 mm. The skin contact area moved across the texture at a speed of 20 mm/s for 0.8 s. The indentation depth was set to 1 mm at the center of contact and followed a circular profile toward the border of contact. Sixteen equally spaced directions were tested, each repeated five times. Gaussian noise was added to the stimulus position (isotropic with 0.5 mm SD) to mimic experimental noise.
Data analysis.
We used linear discriminant analysis (LDA) to classify orientation or scanning direction (using fitcdiscr in Matlab) using a leave one out cross-validation procedure. We used a spike distance measure (as described above) to compare spike trains at different timescales. The distances between spike trains of different repetition and different orientation were computed for each afferent. The distances were then summed across afferents (by taking the root of the sum of square distances). The final distance matrix was then converted back to Euclidean coordinates. Those coordinates were used as feature vector for the LDA-based classification. The classification analyses were performed over different response time windows, starting after the first spike elicited across the whole population and ending at different times (logarithmically spaced) (Figs. 6C and 7E, x axis tick marks). Two different temporal resolutions were tested (q = 0 and ).
SI Methods
LNP Model.
To test whether an IF mechanism was required to reproduce afferent responses, we implemented LNP models and compared them with the full model. The six components from the IF model (rectified quasistatic, dynamic, and dynamic derivative) served as inputs to these models. The same procedure was followed as that described for the IF model (in the text): models were fitted on two datasets (sines plus noise) and then tested on a third (diharmonic). We used a standard sequential method to fit the models. First, a set of six linear filters was obtained using the spike-triggered average computed over a 25-ms window. Second, the linear estimate obtained by filtering and summing six components was passed through a nonlinearity to best fit the actual firing rate (obtained by convolving the spike trains with a 40-ms Gaussian kernel). We found that a nonlinearity of the form (with denoting rectification) gave the best results. Third, Poisson spikes were generated and then binned at 5 kHz. We used the same metric space analysis as described in Methods to compare the distance between the measured spike trains and the simulated spike train (IF or LNP) at different timescales ranging from 0.1 ms to 1 s. The results are shown in Fig. S7 A and B.
Validation of Individual IF Parameters.
To avoid overfitting and ensure robust parameter estimates, we verified that individual IF model parameters—specifically, the low-pass cutoff (parameter 1), the saturation level (parameter 8), the time constant/decay (parameter 10), and the postspike inhibition (parameters 11 and 12)—were necessary to improve model accuracy. We removed or clamped individual parameters and then refit the IF models. For this analysis, we focused on PC afferents, because these fibers have the widest frequency sensitivity. The results are shown in Fig. S7 C–E.
Benchmarks.
The model is computationally efficient enough that a simplified version can be run in real time. Fast runtime is especially important in neuroprosthetic applications, where tactile feedback from a sensorized prosthetic hand would need to be converted into realistic spike trains in quasireal time to be useful to the user. How many pins (defining the complexity of the stimulus) and how many afferents (defining the complexity of the feedback) the model can support in real time depends on the chosen sampling rate for the afferent models. On an Intel i5 quad core running at 3.50 GHz using Matlab 2015b, the model runs in real time with 30 pins and 30 receptors at a sampling rate of 10 kHz, 100 pins and 100 receptors at a sampling rate of 3 kHz, and 300 pins and 300 receptors at a rate of 300 Hz. The model can thus support hundreds of pins and receptors at relatively high temporal resolution in real time.
Stresses at the Receptor Caused by a Circular Probe.
This section adapts equations from ref. 69.
Definitions.
is the probe radius.
is the vertical force applied by the probe.
is the Young modulus (set to kPa), and is Poisson’s ratio (set to ).
are coordinates on the skin surface, and is the depth of the receptors.
Stresses at the receptors caused by probe p.
-
•Geometry:
-
•
Definitions:
-
•Intermediate integrals:
-
•Stresses:
with the following if :
-
•In Cartesian coordinates:
Supplementary Material
Acknowledgments
We thank Ezra Zigmund for programing help on an earlier version of the model. This work was supported by National Science Foundation Grant IOS 1150209 and the Kimberly Clark Corporation. B.C.R. was supported, in part, by the Conte Center for Computational Neuropsychiatric Genomics (NIH Grant P50MH94267) and the Chicago Biomedical Consortium (L004).
Footnotes
The authors declare no conflict of interest.
This article is a PNAS Direct Submission.
This article contains supporting information online at www.pnas.org/lookup/suppl/doi:10.1073/pnas.1704856114/-/DCSupplemental.
References
- 1.Johansson RS, Vallbo AB. Tactile sensibility in the human hand: Relative and absolute densities of four types of mechanoreceptive units in glabrous skin. J Physiol. 1979;286:283–300. doi: 10.1113/jphysiol.1979.sp012619. [DOI] [PMC free article] [PubMed] [Google Scholar]
- 2.Johansson RS, Flanagan JR. Coding and use of tactile signals from the fingertips in object manipulation tasks. Nat Rev Neurosci. 2009;10:345–359. doi: 10.1038/nrn2621. [DOI] [PubMed] [Google Scholar]
- 3.Saal HP, Bensmaia SJ. Touch is a team effort: Interplay of submodalities in cutaneous sensibility. Trends Neurosci. 2014;37:689–697. doi: 10.1016/j.tins.2014.08.012. [DOI] [PubMed] [Google Scholar]
- 4.Phillips JR, Johnson KO, Hsiao SS. Spatial pattern representation and transformation in monkey somatosensory cortex. Proc Natl Acad Sci USA. 1988;85:1317–1321. doi: 10.1073/pnas.85.4.1317. [DOI] [PMC free article] [PubMed] [Google Scholar]
- 5.Manfredi LR, et al. The effect of surface wave propagation on neural responses to vibration in primate glabrous skin. PLoS One. 2012;7:e31203. doi: 10.1371/journal.pone.0031203. [DOI] [PMC free article] [PubMed] [Google Scholar]
- 6.Delhaye BP, Hayward V, Lefèvre P, Thonnard J-L. Texture-induced vibrations in the forearm during tactile exploration. Front Behav Neurosci. 2012;6:37. doi: 10.3389/fnbeh.2012.00037. [DOI] [PMC free article] [PubMed] [Google Scholar]
- 7.Manfredi LR, et al. Natural scenes in tactile texture. J Neurophysiol. 2014;111:1792–1802. doi: 10.1152/jn.00680.2013. [DOI] [PubMed] [Google Scholar]
- 8.Shao Y, Hayward V, Visell Y. Spatial patterns of cutaneous vibration during whole-hand haptic interactions. Proc Natl Acad Sci USA. 2016;113:4188–4193. doi: 10.1073/pnas.1520866113. [DOI] [PMC free article] [PubMed] [Google Scholar]
- 9.Talbot WH, Darian-Smith I, Kornhuber HH, Mountcastle VB. The sense of flutter-vibration: Comparison of the human capacity with response patterns of mechanoreceptive afferents from the monkey hand. J Neurophysiol. 1968;31:301–334. doi: 10.1152/jn.1968.31.2.301. [DOI] [PubMed] [Google Scholar]
- 10.Vallbo AB, Hagbarth K-E. Activity from skin mechanoreceptors recorded percutaneously in awake human subjects. Exp Neurol. 1968;21:270–289. doi: 10.1016/0014-4886(68)90041-1. [DOI] [PubMed] [Google Scholar]
- 11.Saal HP, Bensmaia SJ. Biomimetic approaches to bionic touch through a peripheral nerve interface. Neuropsychologia. 2015;79:344–353. doi: 10.1016/j.neuropsychologia.2015.06.010. [DOI] [PubMed] [Google Scholar]
- 12.Kim SS, et al. Conveying tactile feedback in sensorized hand neuroprostheses using a biofidelic model of mechanotransduction. IEEE Trans Biomed Circuits Syst. 2009;3:398–404. doi: 10.1109/TBCAS.2009.2032396. [DOI] [PMC free article] [PubMed] [Google Scholar]
- 13.Delhaye BP, Saal HP, Bensmaia SJ. Key considerations in designing a somatosensory neuroprosthesis. J Physiol. November 1, 2016 doi: 10.1016/j.jphysparis.2016.11.001. [DOI] [PubMed] [Google Scholar]
- 14.Vallbo AB, Johansson RS. Properties of cutaneous mechanoreceptors in the human hand related to touch sensation. Hum Neurobiol. 1984;3:3–14. [PubMed] [Google Scholar]
- 15.Phillips JR, Johnson KO. Tactile spatial resolution. III. A continuum mechanics model of skin predicting mechanoreceptor responses to bars, edges, and gratings. J Neurophysiol. 1981;46:1204–1225. doi: 10.1152/jn.1981.46.6.1204. [DOI] [PubMed] [Google Scholar]
- 16.Sripati AP, Bensmaia SJ, Johnson KO. A continuum mechanical model of mechanoreceptive afferent responses to indented spatial patterns. J Neurophysiol. 2006;95:3852–3864. doi: 10.1152/jn.01240.2005. [DOI] [PMC free article] [PubMed] [Google Scholar]
- 17.Kim S, Mihalas S, Russell A, Dong Y, Bensmaia SJ. Does afferent heterogeneity matter in conveying tactile feedback through peripheral nerve stimulation? IEEE Trans Neural Syst Rehabil Eng. 2011;19:514–520. doi: 10.1109/TNSRE.2011.2160560. [DOI] [PubMed] [Google Scholar]
- 18.Muniak MA, Ray S, Hsiao SS, Dammann JF, Bensmaia SJ. The neural coding of stimulus intensity: Linking the population response of mechanoreceptive afferents with psychophysical behavior. J Neurosci. 2007;27:11687–11699. doi: 10.1523/JNEUROSCI.1486-07.2007. [DOI] [PMC free article] [PubMed] [Google Scholar]
- 19.Mackevicius EL, Best MD, Saal HP, Bensmaia SJ. Millisecond precision spike timing shapes tactile perception. J Neurosci. 2012;32:15309–15317. doi: 10.1523/JNEUROSCI.2161-12.2012. [DOI] [PMC free article] [PubMed] [Google Scholar]
- 20.Weber AI, et al. Spatial and temporal codes mediate the tactile perception of natural textures. Proc Natl Acad Sci USA. 2013;110:17107–17112. doi: 10.1073/pnas.1305509110. [DOI] [PMC free article] [PubMed] [Google Scholar]
- 21.Johansson RS, Birznieks I. First spikes in ensembles of human tactile afferents code complex spatial fingertip events. Nat Neurosci. 2004;7:170–177. doi: 10.1038/nn1177. [DOI] [PubMed] [Google Scholar]
- 22.Saal HP, Wang X, Bensmaia SJ. Importance of spike timing in touch: An analogy with hearing? Curr Opin Neurobiol. 2016;40:142–149. doi: 10.1016/j.conb.2016.07.013. [DOI] [PMC free article] [PubMed] [Google Scholar]
- 23.Goldberg J, Brown P. Response of binaural neurons of dog superior olivary complex to dichotic tonal stimuli: Some physiological mechanisms of sound localization. J Neurophysiol. 1969;32:613–636. doi: 10.1152/jn.1969.32.4.613. [DOI] [PubMed] [Google Scholar]
- 24.Pruszynski JA, Johansson RS. Edge-orientation processing in first-order tactile neurons. Nat Neurosci. 2014;17:1404–1409. doi: 10.1038/nn.3804. [DOI] [PubMed] [Google Scholar]
- 25.Mountcastle VB, Talbot WH, Kornhuber HH. The neural transformation of mechanical stimuli delivered to the monkey’s hand. In: de Reuck AVS, Knight J, editors. Ciba Foundation Symposium—Touch, Heat and Pain. John Wiley & Sons, Ltd.; Chichester, UK: 1966. pp. 325–345. [Google Scholar]
- 26.Knibestöl M. Stimulus-response functions of rapidly adapting mechanoreceptors in human glabrous skin area. J Physiol. 1973;232:427–452. doi: 10.1113/jphysiol.1973.sp010279. [DOI] [PMC free article] [PubMed] [Google Scholar]
- 27.Johansson RS, Vallbo AB. Spatial properties of the population of mechanoreceptive units in the glabrous skin of the human hand. Brain Res. 1980;184:353–366. doi: 10.1016/0006-8993(80)90804-5. [DOI] [PubMed] [Google Scholar]
- 28.Sripati AP, Yoshioka T, Denchev P, Hsiao SS, Johnson KO. Spatiotemporal receptive fields of peripheral afferents and cortical area 3b and 1 neurons in the primate somatosensory system. J Neurosci. 2006;26:2101–2114. doi: 10.1523/JNEUROSCI.3720-05.2006. [DOI] [PMC free article] [PubMed] [Google Scholar]
- 29.Vega-Bermudez F, Johnson KO. SA1 and RA receptive fields, response variability, and population responses mapped with a probe array. J Neurophysiol. 1999;81:2701–2710. doi: 10.1152/jn.1999.81.6.2701. [DOI] [PubMed] [Google Scholar]
- 30.Johnson KO. Reconstruction of population response to a vibratory stimulus in quickly adapting mechanoreceptive afferent fiber population innervating glabrous skin of the monkey. J Neurophysiol. 1974;37:48–72. doi: 10.1152/jn.1974.37.1.48. [DOI] [PubMed] [Google Scholar]
- 31.Westling G, Johansson RS. Responses in glabrous skin mechanoreceptors during precision grip in humans. Exp Brain Res. 1987;66:128–140. doi: 10.1007/BF00236209. [DOI] [PubMed] [Google Scholar]
- 32.Yau JM, Kim SS, Thakur PH, Bensmaia SJ. Feeling form: The neural basis of haptic shape perception. J Neurophysiol. 2016;115:631–642. doi: 10.1152/jn.00598.2015. [DOI] [PMC free article] [PubMed] [Google Scholar]
- 33.Phillips JR, Johnson KO. Tactile spatial resolution. II. Neural representation of Bars, edges, and gratings in monkey primary afferents. J Neurophysiol. 1981;46:1192–1203. doi: 10.1152/jn.1981.46.6.1192. [DOI] [PubMed] [Google Scholar]
- 34.Vega-Bermudez F, Johnson KO. Surround suppression in the responses of primate SA1 and RA mechanoreceptive afferents mapped with a probe array. J Neurophysiol. 1999;81:2711–2719. doi: 10.1152/jn.1999.81.6.2711. [DOI] [PubMed] [Google Scholar]
- 35.Johansson RS, Landström U, Lundström R. Sensitivity to edges of mechanoreceptive afferent units innervating the glabrous skin of the human head. Brain Res. 1982;244:27–35. doi: 10.1016/0006-8993(82)90900-3. [DOI] [PubMed] [Google Scholar]
- 36.Khalsa PS, Friedman RM, Srinivasan MA, LaMotte RH. Encoding of shape and orientation of objects indented into the monkey fingerpad by populations of slowly and rapidly adapting mechanoreceptors. J Neurophysiol. 1998;79:3238–3251. doi: 10.1152/jn.1998.79.6.3238. [DOI] [PubMed] [Google Scholar]
- 37.Dodson MJ, Goodwin AW, Browning AS, Gehring HM. Peripheral neural mechanisms determining the orientation of cylinders grasped by the digits. J Neurosci. 1998;18:521–530. doi: 10.1523/JNEUROSCI.18-01-00521.1998. [DOI] [PMC free article] [PubMed] [Google Scholar]
- 38.Suresh AK, Saal HP, Bensmaia SJ. Edge orientation signals in tactile afferents of macaques. J Neurophysiol. 2016;116:2647–2655. doi: 10.1152/jn.00588.2016. [DOI] [PMC free article] [PubMed] [Google Scholar]
- 39.Bensmaia SJ, Denchev PV, Dammann JF, 3rd, Craig JC, Hsiao SS. The representation of stimulus orientation in the early stages of somatosensory processing. J Neurosci. 2008;28:776–786. doi: 10.1523/JNEUROSCI.4162-07.2008. [DOI] [PMC free article] [PubMed] [Google Scholar]
- 40.Connor CE, Hsiao SS, Phillips JR, Johnson KO. Tactile roughness: Neural codes that account magnitude estimates for psychophysical magnitude estimates. J Neurosci. 1990;10:3823–3836. doi: 10.1523/JNEUROSCI.10-12-03823.1990. [DOI] [PMC free article] [PubMed] [Google Scholar]
- 41.Connor CE, Johnson KO. Neural coding of tactile texture: Comparison of spatial and temporal mechanisms for roughness perception. J Neurosci. 1992;12:3414–3426. doi: 10.1523/JNEUROSCI.12-09-03414.1992. [DOI] [PMC free article] [PubMed] [Google Scholar]
- 42.Gardner EP, Costanzo RM. Neuronal mechanisms underlying direction sensitivity of somatosensory cortical neurons in awake monkeys. J Neurophysiol. 1980;43:1342–1354. doi: 10.1152/jn.1980.43.5.1342. [DOI] [PubMed] [Google Scholar]
- 43.Paré M, Smith AM, Rice FL. Distribution and terminal arborizations of cutaneous mechanoreceptors in the glabrous finger pads of the monkey. J Comp Neurol. 2002;445:347–359. doi: 10.1002/cne.10196. [DOI] [PubMed] [Google Scholar]
- 44.Yoshioka T, Bensmaia SJ, Craig JC, Hsiao SS. Texture perception through direct and indirect touch: An analysis of perceptual space for tactile textures in two modes of exploration. Somatosens Mot Res. 2007;24:53–70. doi: 10.1080/08990220701318163. [DOI] [PMC free article] [PubMed] [Google Scholar]
- 45.Delhaye BP, Barrea A, Edin BB, Lefèvre P, Thonnard J-L. Surface strain measurements of fingertip skin under shearing. J R Soc Interface. 2016;13:20150874. doi: 10.1098/rsif.2015.0874. [DOI] [PMC free article] [PubMed] [Google Scholar]
- 46.Adams MJ, et al. Finger pad friction and its role in grip and touch. J R Soc Interface. 2012;10:20120467. doi: 10.1098/rsif.2012.0467. [DOI] [PMC free article] [PubMed] [Google Scholar]
- 47.Bisley JW, Goodwin AW, Wheat HE. Slowly adapting type I afferents from the sides and end of the finger respond to stimuli on the center of the fingerpad. J Neurophysiol. 2000;84:57–64. doi: 10.1152/jn.2000.84.1.57. [DOI] [PubMed] [Google Scholar]
- 48.Saal HP, Vijayakumar S, Johansson RS. Information about complex fingertip parameters in individual human tactile afferent neurons. J Neurosci. 2009;29:8022–8031. doi: 10.1523/JNEUROSCI.0665-09.2009. [DOI] [PMC free article] [PubMed] [Google Scholar]
- 49.Dandekar K, Raju BI, Srinivasan MA. 3-D finite-element models of human and monkey fingertips to investigate the mechanics of tactile sense. J Biomech Eng. 2003;125:682–691. doi: 10.1115/1.1613673. [DOI] [PubMed] [Google Scholar]
- 50.Johansson RS. Tactile sensibility in the human hand: Receptive field characteristics of mechanoreceptive units in the glabrous skin area. J Physiol. 1978;281:101–125. doi: 10.1113/jphysiol.1978.sp012411. [DOI] [PMC free article] [PubMed] [Google Scholar]
- 51.Nolano M, et al. Quantification of myelinated endings and mechanoreceptors in human digital skin. Ann Neurol. 2003;54:197–205. doi: 10.1002/ana.10615. [DOI] [PubMed] [Google Scholar]
- 52.Lesniak DR, et al. Computation identifies structural features that govern neuronal firing properties in slowly adapting touch receptors. Elife. 2014;3:e01488. doi: 10.7554/eLife.01488. [DOI] [PMC free article] [PubMed] [Google Scholar]
- 53.Clark GA, Ledbetter NM, Warren DJ, Harrison RR. Proceedings of the Annual International Conference of the IEEE Engineering in Medicine and Biology Society. IEEE; Piscataway, NJ: 2011. Recording sensory and motor information from peripheral nerves with Utah Slanted Electrode Arrays; pp. 4641–4644. [DOI] [PubMed] [Google Scholar]
- 54.Haugland MK, Hoffer JA, Sinkjaer T. Skin contact force information in sensory nerve signals recorded by implanted cuff electrodes. IEEE Trans Rehabil Eng. 1994;2:18–28. [Google Scholar]
- 55.Yoo PB, Durand DM. Selective recording of the canine Hypoglossal nerve using a multicontact flat interface nerve electrode. IEEE Trans Biomed Eng. 2005;52:1461–1469. doi: 10.1109/TBME.2005.851482. [DOI] [PubMed] [Google Scholar]
- 56.Goodman JM, Bensmaia SJ. A variation code accounts for the perceived roughness of coarsely textured surfaces. Sci Rep. 2017;7:46699. doi: 10.1038/srep46699. [DOI] [PMC free article] [PubMed] [Google Scholar]
- 57.Saal HP, Harvey MA, Bensmaia SJ. Rate and timing of cortical responses driven by separate sensory channels. Elife. 2015;4:e10450. doi: 10.7554/eLife.10450. [DOI] [PMC free article] [PubMed] [Google Scholar]
- 58.Tan DW, et al. A neural interface provides long-term stable natural touch perception. Sci Transl Med. 2014;6:257ra138. doi: 10.1126/scitranslmed.3008669. [DOI] [PMC free article] [PubMed] [Google Scholar]
- 59.Raspopovic S, et al. Restoring natural sensory feedback in real-time bidirectional hand prostheses. Sci Transl Med. 2014;6:222ra19. doi: 10.1126/scitranslmed.3006820. [DOI] [PubMed] [Google Scholar]
- 60.Clark GA, et al. Using multiple high-count electrode arrays in human median and ulnar nerves to restore sensorimotor function after previous transradial amputation of the hand. Conf Proc IEEE Eng Med Biol Soc. 2014;2014:1977–1980. doi: 10.1109/EMBC.2014.6944001. [DOI] [PubMed] [Google Scholar]
- 61.Serina ER, Mockensturm E, Mote CD, Rempel D. A structural model of the forced compression of the fingertip pulp. J Biomech. 1998;31:639–646. doi: 10.1016/s0021-9290(98)00067-0. [DOI] [PubMed] [Google Scholar]
- 62.Srinivasan MA, Gulati RJ, Dandekar K. In vivo compressibility of the human fingertip. ASME Adv Bioeng. 1992;22:573–576. [Google Scholar]
- 63.Pawluk DT, Howe RD. Dynamic contact of the human fingerpad against a flat surface. J Biomech Eng. 1999;121:605–611. doi: 10.1115/1.2800860. [DOI] [PubMed] [Google Scholar]
- 64.Wiertlewski M, Hayward V. Mechanical behavior of the fingertip in the range of frequencies and displacements relevant to touch. J Biomech. 2012;45:1869–1874. doi: 10.1016/j.jbiomech.2012.05.045. [DOI] [PubMed] [Google Scholar]
- 65.van Kuilenburg J, Masen MA, van der Heide E. Contact modelling of human skin: What value to use for the modulus of elasticity? Proc Inst Mech Eng Part J. 2012;227:349–361. [Google Scholar]
- 66.Wu JZ, Dong RG, Rakheja S, Schopper AW, Smutz WP. A structural fingertip model for simulating of the biomechanics of tactile sensation. Med Eng Phys. 2004;26:165–175. doi: 10.1016/j.medengphy.2003.09.004. [DOI] [PubMed] [Google Scholar]
- 67.Gerling GJ. SA-I mechanoreceptor position in fingertip skin may impact sensitivity to edge stimuli. Appl Bionics Biomech. 2010;7:19–29. [Google Scholar]
- 68.Tada M, Yoshida H, Mochimaru M, Kanade T. Generating subject-specific FE models of fingertip with the use of MR volume registration. Proc Eurohaptics. 2006;2006 [Google Scholar]
- 69.Harding JW, Sneddon IN. The elastic stresses produced by the indentation of the plane surface of a semi-infinite elastic solid by a rigid punch. Math Proc Cambridge Philos Soc. 1945;41:16–26. [Google Scholar]
- 70.Kim SS, Sripati AP, Bensmaia SJ. Predicting the timing of spikes evoked by tactile stimulation of the hand. J Neurophysiol. 2010;104:1484–1496. doi: 10.1152/jn.00187.2010. [DOI] [PMC free article] [PubMed] [Google Scholar]
- 71.Dong Y, et al. A simple model of mechanotransduction in primate glabrous skin. J Neurophysiol. 2013;109:1350–1359. doi: 10.1152/jn.00395.2012. [DOI] [PMC free article] [PubMed] [Google Scholar]
- 72.Freeman AW, Johnson KO. Cutaneous mechanoreceptors in macaque monkey: Temporal discharge patterns evoked by vibration, and a receptor model. J Physiol. 1982;323:21–41. doi: 10.1113/jphysiol.1982.sp014059. [DOI] [PMC free article] [PubMed] [Google Scholar]
- 73.van Rossum MC. A novel spike distance. Neural Comput. 2001;13:751–763. doi: 10.1162/089976601300014321. [DOI] [PubMed] [Google Scholar]
- 74.Victor JD, Purpura KP. Metric-space analysis of spike trains: Theory, algorithms and application. Netw Comput Neural Syst. 1997;8:127–164. [Google Scholar]
- 75.Knibestöl M. Stimulus-response functions of slowly adapting mechanoreceptors in the human glabrous skin area. J Physiol. 1975;245:63–80. doi: 10.1113/jphysiol.1975.sp010835. [DOI] [PMC free article] [PubMed] [Google Scholar]
- 76.Freeman AW, Johnson KO. A model accounting for effects of vibratory amplitude on responses of cutaneous mechanoreceptors in macaque monkey. J Physiol. 1982;323:43–64. doi: 10.1113/jphysiol.1982.sp014060. [DOI] [PMC free article] [PubMed] [Google Scholar]
- 77.Johansson RS, Landström U, Lundström R. Responses of mechanoreceptive afferent units in the glabrous skin of the human hand to sinusoidal skin displacements. Brain Res. 1982;244:17–25. doi: 10.1016/0006-8993(82)90899-x. [DOI] [PubMed] [Google Scholar]
Associated Data
This section collects any data citations, data availability statements, or supplementary materials included in this article.


