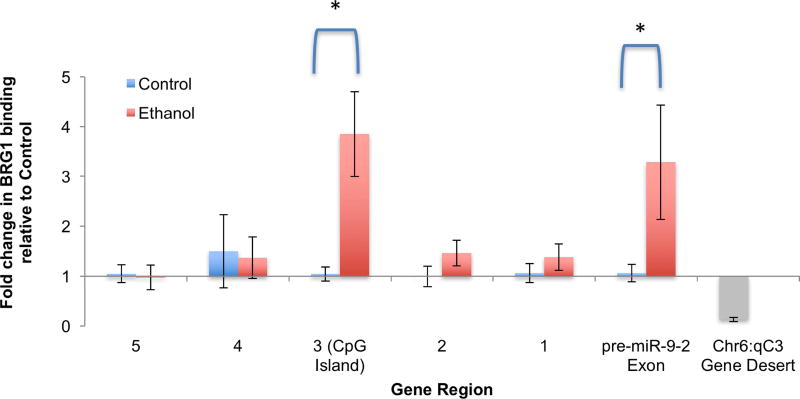
Figure 5. ChIP analysis indicates that ethanol exposure increases BRG1 binding to DNAse I-resistant/CpG island containing region 3 and the pre-miR-9-2 coding exon.
Bar graph shows the effect of ethanol on BRG1-association with regions 1 to 5 and the pre-miR-9-2 exon-coding region of the primary (pri)-miR-9-2 coding locus. Primers for a gene desert on chromosome 6 (not predicted to bind any transcription factors) shows the specificity of the immuno-precipitation. Vertical axis shows the fold change of the specific associated DNA region to BRG1 in ethanol treated group relative to control group. Error bars indicate standard error of the mean.

