Abstract
A 2715 ft2 (252 m2), two story, residential home of the style typical of the Gaithersburg, Maryland area was constructed in 2012 to demonstrate technologies for net-zero energy (NZE) homes (or ZEH). The NIST Net-Zero Energy Residential Test Facility (NZERTF) functions as a laboratory to support the development and adoption of cost-effective NZE designs, technologies, construction methods, and building codes. The primary design goal was to meet the comfort and functional needs of the simulated occupants. The first annual test period began on July 1, 2013 and ended June 30, 2014. During the first year of operation, the home's annual energy consumption was 13039 kWh (4.8 kWh ft-2, 51.7 kWh m-2), and the 10.2 kW solar photovoltaic system generated an excess of 484 kWh. During this period the heating and air conditioning of the home was performed by a novel air-source heat pump that utilized a reheat heat exchanger to allow hot compressor discharge gas to reheat the supply air during a dedicated dehumidification mode. During dedicated dehumidification, room temperature air was supplied to the living space until the relative humidity setpoint of 50% was satisfied. The heat pump consumed a total of 6225 kWh (2.3 kWh ft-2, 24.7 kWh m-2) of electrical energy for cooling, heating, and dehumidification. Annual cooling efficiency was 10.1 Btu W-1h-1 (2.95 W W-1), relative to the rated SEER of the heat pump of 15.8 Btu W-1h-1 (4.63 W W-1). Annual heating efficiency was 7.10 Btu W-1h-1 (2.09 W W-1), compared with the unit's rated HSPF of 9.05 Btu W-1h-1 (2.65 W W-1). These field measured efficiency numbers include dedicated dehumidification operation and standby energy use for the year. Annual sensible heat ratio was approximately 70%. Standby energy consumption was 5.2 % and 3.5 % of the total electrical energy used for cooling and heating, respectively.
Introduction
Buildings consumed 41% of all energy used in the United States in 2010, with residential buildings and commercial buildings accounting for 22% and 19%, respectively. In addition to consuming more energy than the transportation or industrial sectors, buildings represent the fastest growing sector of energy usage (DOE 2010). In order to support reductions building energy consumption, many buildings have been designed, constructed and monitored throughout the world to demonstrate the feasibility of achieving net-zero energy.
Parker (2009) presents a history of low energy homes and presents annual performance data from a dozen very low energy homes in North America. In Washington D.C. in 2001, a 2885 ft2 (268 m2) modular ZEH called the “Solar Patriot” or Hathaway home was built to demonstrate a ZEH in a mixed humid climate. An advanced geothermal heat pump was used for space conditioning. A 6 kW photovoltaic (PV) system was installed with the objective of reaching zero energy on an annual basis. The Hathaway home is in the same weather region as the NIST home and offers some electric energy use comparisons.
Musall et al. (2010) summarizes the research of the International Energy Agency's Annex 52 “Towards Net Zero Energy Buildings” and states that “during the last 20 years more than 200 reputable projects with the claim of a netzero energy budget have been realized all over the world.”
Sherwin et al. (2010) present the performance of four near net-zero energy homes in Florida instrumented to provide data on electrical consumption and generation, indoor conditions, and outdoor weather. NZEH#2 used a 19 SEER air conditioner (AC) for cooling and averaged 216 kWh month-1 for cooling alone while maintaining an average dry-bulb temperature of 78.3°F (25.7°C) and 52.2% RH; standby power was 55 W. NZEH#3 used a ground-source heat pump (GSHP) and averaged 453 kWh in September of 2008 for cooling in a northern Florida climate. NZEH#4 used a 18.4 SEER two-speed air source heat pump with 9.1 HSPF using 3444 kWh, 24% of the total electric use, for cooling and heating while operating at low speed 85% of the time with indoor conditions averaging 75.7°F (23.7 °C) and 54.5% RH. Appliance loads were not separately measured for any of these NZEH sites.
Test House
The net-zero energy residential test facility, NZERTF, is a unique facility that resembles a residence yet is truly a laboratory (Figure 1). The house is two stories having 2715 ft2 (252 m2) of living area, a 1453 ft2 (135 m2) fully conditioned basement, and an 1162 ft2 (108 m2) conditioned but unoccupied attic (Petit et. al 2015). The water, lights, and appliance usage utilized by a family of four were simulated in the NZERTF according to occupancy schedules, which can be found in Omar and Bushby (2013) and Kneifel (2012). Sensible heat energy generated by occupants was simulated in various rooms, but internal latent load simulation was concentrated in the kitchen. Though natural gas could be supplied to the house, during the first year of operation all of the equipment and appliances were powered by electricity either from the site's 10.2 kW (DC) solar photovoltaic (PV) system or the main power grid. The building envelope was constructed using a continuous air barrier system to minimize infiltration, and ventilation was provided by a heat recovery ventilator, HRV. A whole house pressurization or blower door test conducted after the house was complete yielded a leakage rate of 472 cfm (802 m3/h) at 0.20 in H2O (50 Pa) corresponding to 0.63 air changes per hour. HVAC operations consumed 51% of all electrical energy used on the site.
Figure 1.
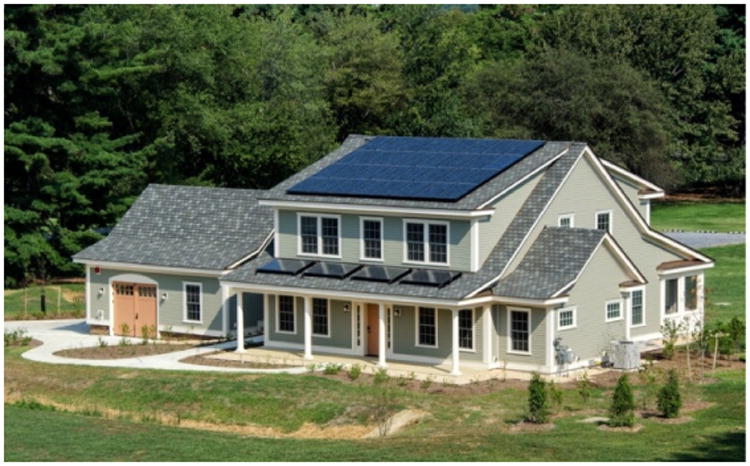
Net-zero energy residential test facility.
Air-To-Air Heat Pump System
The heating and air conditioning system used for the first year of operation in the NZERTF consisted of a HP system that incorporates a dedicated dehumidification cycle (Figure 2). The air distribution duct system was designed for less than 0.5 in H2O (124.5 Pa) external static pressure drop at the air handler with supply and return duct airflow rates of 1200 cfm (2039 m3 h-1) with all registers fully open. The outdoor unit incorporates a two-speed scroll compressor with two modulated hot gas valves on the compressor discharge that send hot refrigerant gas through a third pipe to the indoor reheat heat exchanger during active dehumidification. A supply air temperature sensor provides the control signal used to proportionally modulate the flow of hot refrigerant gas to maintain a preset supply temperature during dedicated dehumidification. The indoor air handler unit contains a variable-speed indoor fan. At the Air-Conditioning, Heating, and Refrigeration Institute (AHRI) rating condition (AHRI 2008), the A-Test cooling capacity is 26 kBtu h-1 (7.60 kW) and the EER (COP) is 13.05 Btu W-1 h-1 (3.82 W W-1). In the heating mode at AHRI rating condition, the unit has a heating capacity of 26.6 kBtu h-1 (7.80 kW). The unit has a seasonal energy efficiency ratio (SEER) of 15.8 Btu W-1 h-1 (4.63 W W-1) and a heating seasonal performance factor (HSPF Region IV) of 9.05 Btu W-1 h-1 (2.65 W W-1).
Figure 2.
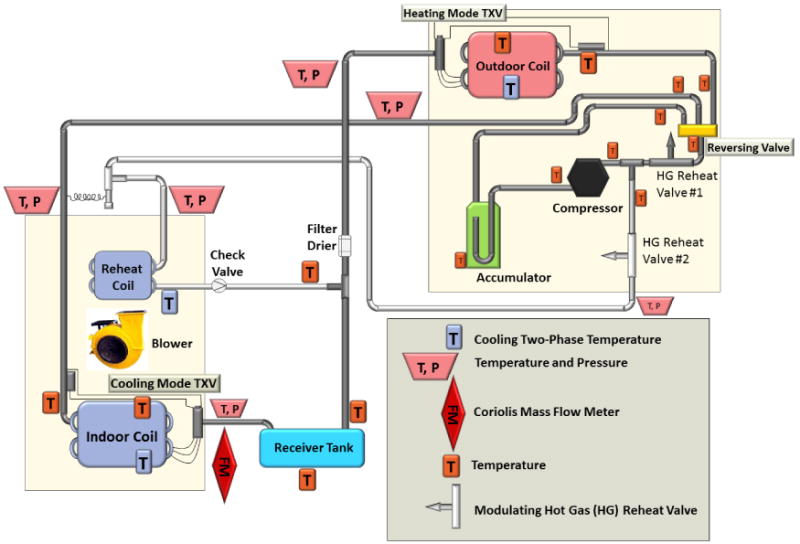
Heat pump refrigerant circuiting and instrumentation.
Instrumentation and Uncertainty
The heat pump system was instrumented to monitor operational parameters and efficiency. The refrigerant circuit is shown in Figure 2 with temperature, pressure, and refrigerant mass flow sensors identified. The HP has its own dedicated data acquisition system that continuously monitors both refrigerant and air side conditions. Air side capacity (sensible and latent) and component power demand are continuously measured to give instantaneous values of efficiency (COP). The heat pump instrumentation, data acquisition system, and measurement uncertainty, as well as all other electrical/mechanical subsystems within the NZERTF are described in Davis et al. (2014).
Cooling and Heating Season Performance
The heat pump was operated as a single zone system with a thermostat located in the living room area on the first floor. During heating mode or defrost mode operations, the indoor unit controller could energize up to 10 kW of electric resistance heat. The thermostat setpoints in the cooling and heating modes were 75.0°F (23.8°C) and 70.0°F (21.1°C), respectively, without setback.
Measured cooling and heating thermal energy for the heat pump can be seen in Table 2. For the entire cooling season the heat pump produced a seasonal COP of 10.07 Btu W-1 h-1 (2.95 W W-1) (Figure 3a). Although not directly comparable, this seasonal COP was 36% lower than the rated SEER of the system. The measured performance was lower than the rated SEER value due in part to different indoor setpoint conditions than the standardized tests, as well as differences in the cumulative outdoor temperature conditions, ventilation thermal loads, and standby power demand. Heating thermal loads are also shown in Table 2 with their associated monthly COP in Figure 3b. For the entire heating season COP of the system was 6.96 Btu W-1 h-1 (2.04 W W-1), a value that was 23% lower than the rated HSPF. The resistance heat operated more frequently than anticipated in the heating season due to the inherent control logic of the thermostat. The thermostat heating configuration allows the installer or homeowner to prescribe differential temperatures relative to the current setpoint temperature and to prescribe delay times (the maximum amount of time a given stage is allowed to operate) before energizing the next higher stage. The delay time control logic appears to be effective in the cooling mode, but produced unnecessary usage of electric resistance heat in the heating mode. By limiting the 2nd stage delay time to a maximum of 40 min, the thermostat required 3rd stage electric heat even though 2nd stage heating was increasing the temperature in the house.
Table 2. Cooling and Heating Thermal Loads.
| Cooling, kWh | ||||||
| Jul-2013 | Aug-2013 | Sep-2013 | Oct-2013 | Apr-2014 | May-2014 | Jun-2014 |
|
| ||||||
| 2123 | 1621 | 937 | 306 | 67 | 603 | 1560 |
| Heating, kWh | ||||||
|
| ||||||
| Oct-2013 | Nov-2013 | Dec-2013 | Jan-2014 | Feb-2014 | Mar-2014 | Apr-2014 |
| 56 | 832 | 1351 | 2157 | 1635 | 1423 | 253 |
Figure 3.
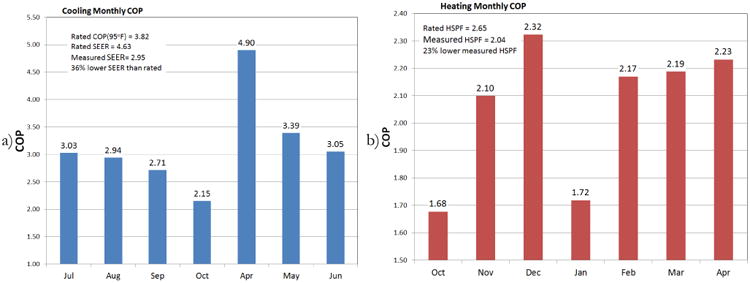
Cooling (a) and heating (b) season COP.
Dedicated Dehumidification Performance
In the cooling mode, the thermostat was set such that the dedicated dehumidification mode of the HP unit was engaged if the relative humidity (RH) reached 50%. Studies of high performance homes with mechanical ventilation showed that the HVAC systems were generally able to maintain the conditioned space below 60% RH (Rudd et al. 2014). An RH setpoint of 50% was selected for the NZERTF to be more restrictive and more comfortable.
Dedicated dehumidification control consists of two distinct stages: stage 1 lowers the indoor blower speed for approximately 15 min or until the RH setpoint is reached; stage 2 begins after 15 min of stage 1 operation by modulation of the two outdoor unit hot gas bypass valves to control indoor supply air temperatures to a pre-selected “room neutral” temperature. Table 3 shows the operating times and electrical energy use during active dehumidification. Active dehumidification consumed approximately 892 kWh of electrical energy, or 6.8 % of all the house electrical energy used during the first year of operation. Figure 4a shows the operational dehumidification efficiency (or energy factor) in units of liters per kilowatt hour. The U.S. Environmental Protection Agency issues Energy Star ratings for dehumidifiers (< 75 pints day-1 or 35.5 liter day-1) with efficiencies of 1.85 L kWh-1 or greater (EPA 2015). While the HP dedicated dehumidification efficiency was lower than Energy Star, this mode of dehumidification does not add heat to the conditioned space as do most portable dehumidifiers.
Table 3. Active Dehumidification Mode Runtimes.
| Active Dehumidification with Reheat Runtime (min) | ||||||
| Jul-2013 | Aug-2013 | Sep-2013 | Oct-2013 | Apr-2014 | May-2014 | Jun-2014 |
|
| ||||||
| 9891 | 9510 | 4198 | 2280 | 0 | 829 | 7989 |
| Active Dehumidification Electrical Energy (kWh) | ||||||
| 246 | 246 | 114 | 60 | 0 | 22 | 204 |
Figure 4.
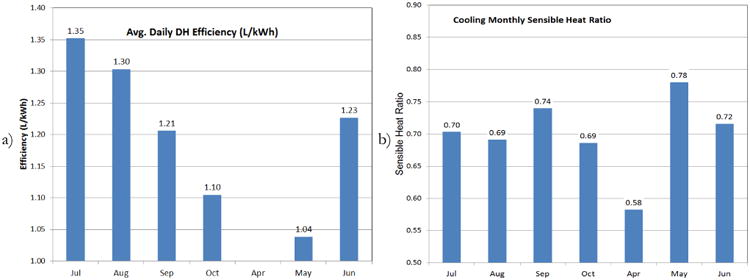
Dedicated dehumidification mode efficiency (a) and sensible heat ratio while maintaining 50% RH (b).
A key feature of the NIST net-zero home that most contributes to its low energy consumption is the tight and highly insulated envelope. This tight envelope requires the use of mechanical ventilation to comply with outdoor air ventilation requirements, which, in the summer months, introduces moisture into the space (ASHRAE 2013). This moisture was removed by the HP to hold humidity levels at the 50% RH setpoint. The heat pump operated normally and in the dedicated dehumidification mode to produce a sensible heat ratio (SHR) of approximately 70% (Figure 4b), which was the SHR needed to maintain a 50% indoor RH and support occupant comfort.
Effect of Standby Energy on Performance
Cooling and heating annual energy efficiency were affected by the HP's standby power demand. Table 4 shows the electrical energy consumed by the heat pump and the percentage of standby time during the cooling and heating modes. Overall the standby energy consumption was 5.2% and 3.5% of the total electrical energy used for cooling and heating, respectively.
Table 4. Standby Energy Use.
| Cooling Standby Energy (kWh) and Percentage of Time in Standby Mode | ||||||
| Jul-2013 | Aug-2013 | Sep-2013 | Oct-2013 | Apr-2014 | May-2014 | Jun-2014 |
|
| ||||||
| 12.6, 34% | 17.2, 46% | 23.4, 64% | 25.6, 87% | 3.1, 99% | 30.5, 82% | 16.2, 45% |
|
| ||||||
| 128.6 kWh standby cooling, 5.2% of total cooling electrical energy | ||||||
| Heating Standby Energy (kWh) and Percentage of Time in Standby Mode | ||||||
|
| ||||||
| Oct-2013 | Nov-2013 | Dec-2013 | Jan-2014 | Feb-2014 | Mar-2014 | Apr-2014 |
|
| ||||||
| 6.8, 98% | 25.2, 72% | 21.3, 59% | 14.3, 38% | 14.9, 45% | 21.5, 59% | 29.4, 93% |
|
| ||||||
| 133.2 kWh, 3.5% of total heating electrical energy | ||||||
Heat Recovery Ventilator Impact
Ventilating the house using an HRV resulted in a 7% savings in heat pump energy use on average over the year compared with ventilating without heat recovery. The impact on the heat pump energy use ranged from a 5% increase in cooling months to a 36% savings in heating months (Figure 5). However, in this climate, the annual savings in heat pump energy were offset by the increased power consumption of the HRV compared to a supply fan without heat recovery. These findings are consistent with the literature studies, which were conducted using simulations (Rudd et al. 2013).
Figure 5.
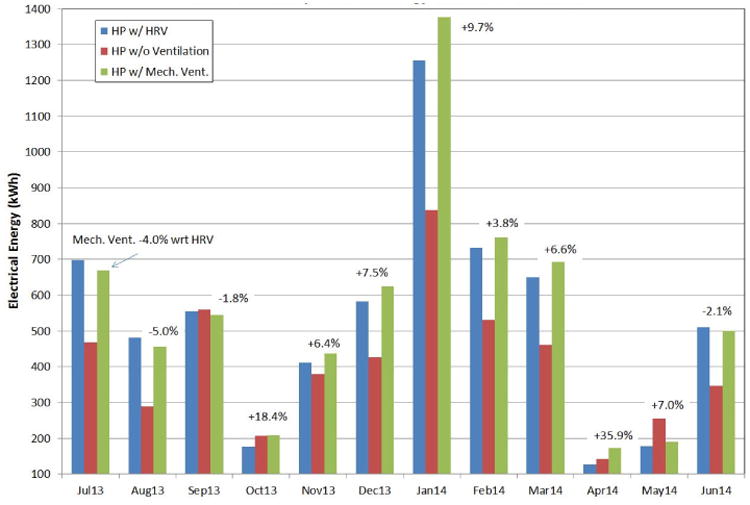
Heat pump electrical energy use due to mechanical ventilation.
House and Heat Pump Performance Summary
During the first year of operation, the home's annual energy consumption was 13039 kWh (4.8 kWh ft-2 or 51.7 kWh m-2), and the 10.2 kW solar PV generated an excess of 484 kWh. The HP consumed a total of 6225 kWh (2442 kWh cooling, 3783 kWh heating) of electrical energy while transferring a total of 14924 kWh of thermal energy (7217 kWh cooling, 7707 kWh heating) between the indoor space and outdoor environment (combined EER of 8.18 Btu W-1h-1, COP of 2.40 W W-1). The heat pump operated for a total time of 3503 h (1785 h cooling, 1718 h heating) or 40% of the year. For the majority of the time, the heat pump was in standby mode, which consumed a total of 262 kWh (129 kWh cooling, 133 kWh heating) or 2% of the total site electrical energy consumption. Supplemental dehumidification was required to maintain a “comfortable” 50% RH at all times; this supplemental dehumidification used 892 kWh or 14.3% of the heat pump's energy use or 6.8% of the entire site electrical energy. The heat pump's resistive heat electrical energy used totaled 1157 kWh of which 352 kWh was consumed during defrost and 805 kWh was consumed for direct supplemental heating. Resistive heat for supplemental heating was 12.9% of the heat pumps total electrical energy use or 6.2% of the total site electrical energy use.
The original thermostat's control logic would not allow enough time for the heat pump to reach the setpoint in heating mode even when it was capable of increasing the indoor temperature without the resistive heat. A different thermostat with more control options could have saved more than 6% of the total site electrical energy because there were no conditions severe enough to prevent the heat pump from satisfying the heating setpoint.
Human comfort and maximum heat pump SEER are at odds with each other. An air-conditioning system should be designed to efficiently provide comfort in its specific climate zone; therefore, maximum possible SEER will vary with climate zone just as average daily outdoor humidity varies with climate zone. Heat pumps and air conditioners, with their controls, should be rated for dehumidification performance by a non-burdensome laboratory test method.
Table 1. Instrumentation Uncertainty for the Air-Source Heat Pump.
| Instrument | Range | Total Uncertainty at the 95 % Confidence Level |
|---|---|---|
| Transducer voltage measurement | 0 to 10 VDC | ±5 mVDC |
| T-type thermocouples | 16°F to 131°F (-10°C to 55°C) | ±1.0°F (0.6°C) |
| Barometric pressure | 20 to 30 in Hg (0.667 to 1.001 bar) | ±1 % of reading |
| High pressure transducer | 1000 psig (6895 kPa) | ±0.25 % of reading |
| Low pressure transducer | 500 psig (3447 kPa) | ±0.25 % of reading |
| Air pressure differential (ESP1) | 0 to 0.75 in H2O (0 to 187 Pa) | ±0.8 % of reading |
| Indoor blower and controls power meter | 0 to 300 VAC, 5 Amps, 1000 W | ±5 W |
| Indoor total power meter | 0 to 300 VAC, 100 Amps, 20 000 W | ±100 W |
| Outdoor unit power meter | 0 to 300 VAC, 20 Amps,4000 W | ±20 W |
| Supply air dry-bulb temperature sensor | -20°F to 120°F (-28.8°C to 49°C) | ±0.9°F (0.5°C) |
| Supply air dew-point temperature sensor | -20°F to 120°F (-28.8°C to 49°C) | ±1.8°F (1.0°C) |
| Return air dry-bulb temperature sensor | -40°F to 140°F (-40°C to 60°C) | ±0.4°F (0.2°C) |
| Return air dew-point temperature sensor | -4°F to 212°F (-20°C to 100°C) | ±1.5 % of reading |
| Outdoor air dry-bulb temperature sensor | -40°F to 140°F (-40°C to 60°C) | ±0.4°F (0.2°C) |
| Outdoor air dew-point temperature sensor | -4°F to 212°F (-20°C to 100°C) | ±1.5 % of reading |
| Coriolis refrigerant mass flow meter | 0 to 80 lbm min-1 (0 to 2180 kg h-1) | ±0.15 % of reading |
External Static Pressure
Acknowledgments
The author would like to acknowledge the contributions of Hunter Fanney, Lisa Ng, Brian Dougherty, Joshua Kneifel, Tania Ullah, Farhad Omar, Matthew Boyd, Luis Luyo, John Wamsley, and Arthur Ellison (all of NIST) in contributing to the content and measurements needed to produce this paper.
Nomenclature
- AC
Air-Conditioner
- cfm
cubic feet per minute, ft3 min-1
- COP
Coefficient of Performance, W W-1
- DC
Direct Current
- EER
Energy Efficiency Ratio, Btu W-1 h-1
- HP
Heat Pump
- HRV
Heat Recovery Ventilator
- HSPF
Heating Seasonal Performance Factor, Btu W-1 h-1
- HVAC
Heating, Ventilating, and Air-Conditioning
- NZE(H)
Net-Zero Energy (Home)
- NZERTF
Net-Zero Energy Residential Test Facility
- PV
Photovoltaic
- SEER
Seasonal Energy Efficiency Ratio, Btu W-1 h-1
- ZEH
Zero Energy Home
References
- AHRI. Air-Conditioning, Heating, and Refrigeration Institute; 2008. Standard 210/240: Performance Rating of Unitary Air-Conditioning and Air-Source Heat Pump Equipment. http://www.ahrinet.org. [Google Scholar]
- ASHRAE. Standard 62.2-2013: Ventilation and Acceptable Indoor Air Quality in Low-Rise Residential Buildings. ASHRAE, USA; 2013. [Google Scholar]
- Davis M, Healy W, M Boyd M, Ng L, Payne V, Skye H, Ullah T. Monitoring Techniques for the Net-Zero Energy Residential Test Facility, NIST Technical Note 1854. 2014 http://www.nist.gov/customcf/get_pdf.cfm?pub_id=917208.
- DOE. Building Energy Data Book. U.S. Department of Energy. [Web page]; 2010. http://buildingsdatabook.eren.doe.gov/ [Google Scholar]
- EPA. Dehumidifiers Key Efficiency Criteria. [accessed July 17, 2015];2015 http://www.energystar.gov/index.cfm?c=dehumid.pr_crit_dehumidifiers.
- Kneifel J. Annual Whole Building Energy Simulation of the NIST Net Zero Energy Residential Test Facility Design, NIST Technical Note 1767. 2012 http://www.nist.gov/customcf/get_pdf.cfm?pub_id=912187.
- Musall E, Weiss T, Voss K, Lenoir A, Donn M, Cory S, Garde F. Proceedings of 2010 Eurosun Conference, Int Conf on Solar Heating Cooling and Buildings. Graz, Styria, Austria: 2010. Net Zero Energy Solar Buildings: An Overview and Analysis on Worldwide Building Projects. [Google Scholar]
- Omar F, Bushby S. Simulating Occupancy in the NIST Net-Zero Energy Residential Test Facility, NIST Technical Note 1817. 2013 http://www.nist.gov/customcf/get_pdf.cfm?pub_id=914650.
- Parker DS. Very low energy homes in the United States: Perspectives on performance from measured data. Energy and Buildings. 2009;41(5):512–520. [Google Scholar]
- Petit B, Gates C, Fanney AH, Healy WM. Design Challenges of the NIST Net Zero Energy Residential Test Facility, NIST Technical Note 1847. 2015 http://dx.doi.org/10.6028/NIST.TN.1847.
- Rudd A, Henderson HI, Bergey D, Shirey DB. ASHRAE 1449-RP Final Report. Atlanta, GA: 2013. ASHRAE 1449-RP: Energy Efficiency and Cost Assessment of Humidity Control Options for Residential Buildings; p. 204. [Google Scholar]
- Rudd A. Measure Guideline: Supplemental Dehumidification in Warm-Humid Climates. Building America Program Report. 2014 http://www.osti.gov/scitech.
- Sherwin J, Colon C, Parker D, Martin E. Thermal Performance of the Exterior Envelopes of Whole Buildings XI. Clearwater Beach, Florida: Dec 5-9, 2010. 2010, Performance of Four Near Zero Energy Homes: Lessons Learned. [Google Scholar]


