

Abstract
Quantitative body DW-MRI can detect abdominal abnormalities as well as monitor response-to-therapy for applications including cancer and inflammatory bowel disease with increased accuracy. Parameter estimates are obtained by fitting a forward model of DW-MRI signal decay to the observed data acquired with several b-values. The DW-MRI signal decay models typically used do not account for respiratory, cardiac and peristaltic motion, however, which may deteriorate the accuracy and robustness of parameter estimates. In this work, we introduce a new model of DW-MRI signal decay that explicitly accounts for motion. Specifically, we estimated motion-compensated model parameters by simultaneously solving image registration and model estimation (SIR-ME) problems utilizing the interdependence of acquired volumes along the diffusion-weighting dimension. To accomplish this, we applied the SIR-ME model to the in-vivo DW-MRI data sets of 26 Crohn’s disease (CD) patients and achieved improved precision of the estimated parameters by reducing the coefficient of variation by 8%, 24% and 8% for slow diffusion (D), fast diffusion (D*) and fast diffusion fraction (f) parameters respectively, compared to parameters estimated with independent registration in normal-appearing bowel regions. Moreover, the parameters estimated with the SIR-ME model reduced the error rate in classifying normal and abnormal bowel loops to 12% for D and 10% for f parameter with a reduction in error rate by 13% and 11% for D and f parameters, respectively, compared to the error rate in classifying parameter estimates obtained with independent registration. The experiments in DW-MRI of liver in 20 subjects also showed that the SIR-ME model improved the precision of parameter estimation by reducing the coefficient of variation to 7% for D, 23% for D*, and 8% for the f parameter. Using the SIR-ME model, the coefficient of variation was reduced by 4%, 14% and 6% for D, D* and f parameters, respectively, compared to parameters estimated with independent registration. These results demonstrate that the proposed SIR-ME model improves the accuracy and robustness of quantitative body DW-MRI in characterizing tissue microstructure.
Keywords: Diffusion-weighted imaging, motion compensation, abdomen, intra voxel incoherent motion model
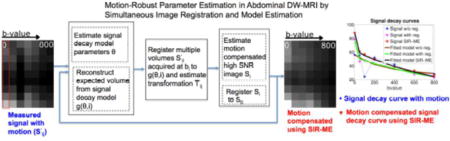
Graphical abstract
1. Introduction
Quantitative diffusion-weighted MRI (DW-MRI) parameters have been increasingly used for the characterization of abnormalities in tissue microstructure of liver, spleen and bowel (Chavhan et al., 2014; Jang et al., 2014; Yoon et al., 2014; Oto et al., 2011). The water molecule mobility attenuates the diffusion-weighted MR signal according to the b-value used in the acquisition. Typically, DW-MRI images are acquired at multiple b-values. A signal decay model is then fitted to the measured signal and the signal decay rate parameters are computed.
The mobility of water molecules in tissue microenvironments changes in the presence of abnormal tissue because of modified cellularity, cell membrane integrity and micro-capillary perfusion. Changes in tissue microenvironments can be identified quantitatively using signal decay model parameters. For instance, malignant lesions are expected to exhibit restricted diffusion, with a lower decay rate of diffusion due to reduced extracellular space; while benign lesions generally have more extracellular space that allows for more normal diffusion, with a higher decay rate of diffusion. However, reproducible and precise parameter estimation techniques are required to increase the sensitivity and specificity of these parameters to detect abnormalities and monitor response-to-therapy, which, in turn, is expected to increase the utility of quantitative DW-MRI in clinical care settings.
Several models have been proposed to quantify the signal decay in the DW-MRI images. A mono-exponential signal decay model (Koh and Collins, 2007), which encapsulates the multiple signal decay rates by a single parameter called the” apparent diffusion coefficient (ADC)”. ADC model is used most often due to its robustness and ease of image acquisition and parameter computation. However, this simplified model precludes the independent characterization of multiple diffusion scales– a process essential to accurately quantifying the biological phenomena taking place inside the tissue of interest. The bi-exponential signal decay model considers both slow and fast components of signal decay according to the intra-voxel incoherent motion (IVIM) theory (Le Bihan et al., 1988). The signal decay at high b-values, which is associated with the slow-diffusion, reflects the mobility of water molecules in the tissue. The signal decay at low b-values, associated with the fast-diffusion component, is an indicator of micro-capillary perfusion. The IVIM model has 3 parameters: a slow diffusion coefficient (D), a fast diffusion coefficient (D*), and a fraction coefficient (f) reflecting the proportion of fast diffusion spins at b=0s/mm2.
Both slow and fast diffusion in biological tissue are heterogeneous processes that occur over a broad range of time scales due to widely varying cell structures, vessel sizes and flow rates. Recently, a more accurate probabilistic model of diffusion has been proposed that considers a full characterization of the distribution of diffusion scales that attenuate the DW-MRI signal using a two-component probability mixture model. A spatial homogeneity prior has been added to this model (Kurugol et al., 2014) to obtain reliable estimates of parameters using the Fusion Bootstrap Moves (FBM) algorithm proposed by Freiman et al. (Freiman et al., 2013) for the spatially-constrained IVIM model. This spatially-constrained probability model of incoherent motion (SPIM) has been shown to characterize the entire scale of diffusion reflecting the tissue microstructure while increasing the precision and reproducibility of parameter estimation in low signal-to-noise ratio (SNR) DW-MRI images (Kurugol et al., 2016). None of these signal decay models, however, consider the presence of the respiratory, cardiac and peristalsis motion, which causes misalignment between image volumes, acquired at multiple b-values and deteriorates the accuracy and robustness of parameter estimation.
Previous techniques for motion compensation include breath-holding, gating, and respiratory or cardiac triggering. These techniques have disadvantages, however, such as increased scan time and a need for the patient’s cooperation. Furthermore, none of these approaches entirely correct for motion. While breath-holding methods can be used to improve the robustness of DW-MRI data (Kandpal et al., 2009; Kwee et al., 2008), only a limited number of b-values can be obtained within a breath-hold, and this requires the patient’s cooperation. Naturally, such a method is not suitable for young children who cannot hold their breath, or who must be imaged under sedation. By contrast, free-breathing DW-MRI has the effect of signal-averaging over large regions of interest, resulting in accurate parameter estimations for large homogenous regions, which, in turn, may improve SNR by using multiple signal acquisitions. However, this technique results in reduced accuracy for small and heterogeneous lesions (Koh and Collins, 2007; Koh et al., 2011) and scan time increases linearly with number of excitations. Respiratory triggering methods have also been shown to reduce motion artifact, but at the expense of increased scanning times (Taouli et al., 2009; Taouli and Koh, 2010). In addition, the triggering technique does not always perform well if the respiratory rhythm is irregular as in the case of anxious awake children who are breathing rapidly or irregularly. Residual motion artifacts still remain in triggered respiratory scans and may, as a consequence, decrease the precision of diffusion parameters. Especially, the estimation of the micro-capillary perfusion contribution (f) demonstrated a relatively large variability (Eisenberger et al., 2013), which may be due, in part, to residual motion effects.
Another alternative is post acquisition motion compensation based on image registration, to bring the volumes acquired at different b-values into the same physical coordinate space before fitting a signal decay model (Guyader et al., 2014; Mazaheri et al., 2012). However, each b-value image has different contrast; as a result, independent registration of different b-value images to a b=0s/mm2 image may not be very accurate, especially for high b-value images where the signal is significantly attenuated and the signal to noise ratio is low.
Several physiological model driven registration methods were used for motion compensation in dynamic contrast-enhanced MR imaging (Buonaccorsi et al., 2007; Bhushan et al., 2011). Recently, a different data driven method was proposed by Huizinga et al. (Huizinga et al., 2016), which registers quantitative MR images without using any predefined model by utilizing a PCA-based groupwise image registration technique. However, the PCA-based representation is only applicable to data from a simplified single exponential decay rather than data with an underlying complex signal decay composed of a bi-modal distribution of fast and slow diffusion components.
In this work, we introduce a simultaneous image registration and model estimation (SIR-ME) framework for motion-compensated parameter estimation of both fast and slow diffusion components in DW-MRI. This paper extends our model-driven motion compensation and parameter estimation framework for abdominal diffusion imaging previously presented at the MIC-CAI 2015 conference (Kurugol et al., 2015) by providing a more detailed description of the model based on additional experiments on a larger dataset that more extensively analyze the precision of the parameter estimation using the proposed approach in comparison to previous methods in normal and diseased bowel regions of Crohn’s disease patients. We also included additional experiments on DW-MRI dataset of upper abdomen to test the performance of the proposed approach in liver regions of 20 subjects.
Our primary contribution consists of a new signal decay model that characterizes the entire scale of diffusion robustly while considering the likelihood of patient motion and compensating for it, with the goal of obtaining robust parameter estimations. The SIR-ME framework described in this paper utilizes the dependency of acquired volumes in the diffusion-weighting dimension, where images are related to each other through the signal decay model. Incorporating this information as additional prior information into the motion compensation framework is expected to improve the performance of registration for motion-compensation. The SIR-ME solver utilizes this information and jointly estimates transformations for the non-rigid alignment of images; reconstructs high SNR registered diffusion images; and estimates signal decay model parameters. This novel, joint parameter estimation method is solved iteratively to obtain improved parameter estimation. In parallel, it corrects for the effects of motion and reconstructs motion-compensated image volumes.
2. Simultaneous Image Registration and Model Estimation (SIR-ME) for Motion-Compensated DW-MRI
2.1. Intra-voxel incoherent motion model (IVIM)
In quantitative DW-MRI, images are acquired at multiple (i = 1..N) b-values. In the absence of motion, a signal decay model is then fitted to the measured signal at multiple b-values (bi), and the model parameters are estimated. The intra-voxel incoherent motion model of DW-MRI signal decay proposed by Le Bihan et al. (Le Bihan and Turner, 1991) assumes a bi-exponential signal decay function to model both inherent slow diffusion due to Brownian motion of water molecules, and fast diffusion due to bulk motion of water molecules in micro-capillaries arising from perfusion. The bi-exponential IVIM signal decay function is (g(Θ, i)) of the form (Le Bihan and Turner, 1991):
| (1) |
where g(Θ, i) is the expected signal at b-value bi, Θ = {S0, f, D, D∗} are the IVIM model parameters describing the baseline signal (S0); the fast diffusion fraction coefficient (f); the fast diffusion coefficient (D∗) characterizing the fast diffusion component associated with micro-capillary perfusion; and the slow diffusion coefficient (D) associated with extravascular water.
The model parameters Θ are estimated by solving a maximum-likelihood estimation problem. The measured signal DW-MRI (Si) is a sum of the signal component and the noise component. When the non-central Chi-distributed parallel imaging acquisition noise is approximated by a Gaussian in the maximum likelihood estimator, the following least-squares minimization problem is obtained:
| (2) |
where N is the number of b-values and g (Θ, i) is given by Eqn. 1.
However, in abdominal DW-MRI, the inherent low SNR of each acquired b-value image may introduce error to the parameter estimates. To increase the SNR, repeated images are acquired (j = 1..M) at the same b-value (bi). A higher SNR image (Si) is then estimated from these multiple acquisitions at each b-value. Formally, a maximum-likelihood estimate of the high SNR image (Si) is obtained by assuming a normal distribution of ’s around Si, and by solving the following least-squares problem
| (3) |
The underlying higher SNR signal (Ŝi) can be computed by simply averaging the multiple acquisitions at each b-value i.
However, in the presence of motion, multiple images acquired at each b-value are not spatially aligned and therefore cannot be directly used for parameter estimation. One solution is to independently register each image to a reference b = 0s/mm2 image. However, registration of high b-value images to a b = 0s/mm2 image (So) is challenging to achieve due to contrast differences between these images and lower SNR of high b-value images. Another approach is registration of images acquired at the same b-value to a template image constructed at that b-value. The template images at different b-values are related to each other through the signal decay model. Therefore the signal decay model can be used as a prior when constructing these template images. Solving these problems jointly can improve performance.
2.2. Simultaneous Image Registration and Model Estimation (SIR-ME) for Motion-Compensated DW-MRI
We introduce a motion-compensated parameter estimation model that simultaneously solves image registration and model estimation (SIR-ME) problems by utilizing the interdependence of acquired volumes along the fourth parametric dimension, i.e., a diffusion- weighting dimension as an additional term in the cost function. Given a set of low SNR DW-MRI images at multiple b-values which may affected by motion, our proposed joint formulation is then given by
| (4) |
where is the low SNR measured image, Si is the noisy high SNR image template and g(Θ, i) is the expected signal at b-value bi given the signal decay model parameters Θ, is the transformation between the observed image and the high SNR image at bi, and Ti is the transformation between Si and S0.
The first term is used to reconstruct the high SNR images (Si) from registered low SNR images and the second term is the signal decay model-fitting prior. When solving this equation, the expected signal, g(Θ, i), is dependent on both the parameters of the signal decay model (i.e. Θ) and the transformations , which are all unknown. As a result, we cannot optimize this equation directly. Instead, we solve it as a simultaneous optimization problem, where registration, reconstruction of the high SNR DW-MRI images, and estimation of the signal decay model parameters are iteratively performed (TABLE 1). We used the recently proposed spatially-constrained probability distribution model of diffusion (Kurugol et al., 2016) as the signal decay model (g(Θ, i)), and the non-rigid diffeomorphic block-matching algorithm by Commowick et al. (2012) for registration.
Table 1.
SIR-ME optimization algorithm
| Input: | : measured signal at b-value i and gradient j. | |
| Output: | Θ ← Θt+1 : final parameter values after tth iteration | |
| Initialize: | An initial registration to estimate and is applied. | |
| Step 1. | Estimate signal decay model parameters Θ: | |
| Given the current estimate of the high SNR signal St and transformation Tt estimate model parameters Θt+1 by minimizing: where ψ(·,·) is the spatial constraint given by: The details can be found in Kurugol et al. (2016). |
||
| Step 2. |
Estimate transformation
|
|
| Given the current estimate of expected signal g(Θ, i), solve the registration problem and compute the transformation that aligns each to g(Θ, i) at each b-value i using the block matching non-rigid registration algorithm in Commowick et al. (2012). | ||
| Step 3. | Estimate high SNR template image at b-value i, Si, i = 1..N | |
| Given the current estimate of parameters , compute the high SNR template signal by minimizing Eqn. 4. | ||
| Step 4. | Estimate transformation Ti | |
| Estimate transformation
to align each b-value high SNR image
to b=0 s/mm2 image using the same block-matching registration algorithm. Go back to Step 1 until convergence. |
2.3. SIR-ME Optimization Scheme
The signal decay model parameters Θ; transformations Ti; the high SNR signal Si; and transformations are estimated by solving Eqn 4 iteratively. First, given the current estimate of the signal Si and transformation Ti, signal decay model parameters Θ and transformations are estimated. Next, the signal Si and transformation Ti are estimated given the current estimate of the model parameters Θ, and transformations .
In the initialization step (t=0), was computed by averaging of all images (Si,j’s) at b-value bi. We used geometric averaging which is more robust to noise and motion artifacts than arithmetic averaging. The detailed explanation of the iterative optimization algorithm steps are as follows:
2.3.1. Signal decay model (Θ) estimation
Instead of the bi-exponential IVIM signal decay model, we use the recently proposed spatially-constrained probability distribution model of slow and fast diffusion (SPIM) (Kurugol et al., 2016) to robustly estimate the fast and slow diffusion parameters (Θ) of the signal decay model (g(Θ, i)).
SPIM model uses a probability distribution model of diffusion instead of describing the slow and fast diffusion components each with a single coefficient. This probability distribution of diffusion is described by a two-component mixture model p(D) of two PDFs, one for fast diffusion (micro-capillary perfusion) and one for slow diffusion:
| (5) |
where p1(D) and p2(D) are both Gamma probability density functions (pdfs). Gamma pdf has 2 parameters, one shape parameter k and a scale parameter s. The signal decay model using the mixture of Gamma pdfs can be simplified into this form (Kurugol et al., 2016):
| (6) |
where the parameters Θ={So, f, k1, s1, k2, s2} can be estimated by solving Eqn. 2. We initialized the parameters (Θ) using the estimated IVIM model parameters. Specifically, the mean values of the Gamma distributions were initialized using the D and D* parameters of the IVIM model, respectively and their mixing proportion was initialized using the f parameter. The standard deviation of the Gamma distributions were initialized to be 0.1 for slow and 1 for fast diffusion component as described in (Kurugol et al., 2016).
Given the current estimate of the DW-MRI signal St and transformation Tt at iteration t, the model parameters (Θ) at t+1 (Θt+1) are obtained by minimizing the following spatially-constrained, model fitting problem:
| (7) |
where ψ(·,·) is the spatial constraint given by:
| (8) |
and α ≥ 0 is the weight of the spatial constraint; W is a diagonal weighting matrix which accounts for the different scales of the parameters in Θ and vp and vq are the neighboring voxels according to the neighborhood system employed.
We estimated the model parameters Θ by minimizing Eqn. 7 using the “fusion bootstrap moves” combinatorial solver introduced by (Freiman et al., 2013) and applied in Kurugol et al. (2016) to solve the SPIM model. We used the optimal value of α (0.003) determined using both in-vivo and simulated data experiments in Kurugol et al. (2016). {D, D*, f} parameters are the mean values of the Gamma pdfs and their mixing proportions, respectively.
2.3.2. Estimation of transformation
Given the current estimate of expected signal from the signal decay model g(Θ, i), we solve the registration problem and compute the transformation that aligns each low SNR-acquired image, , to the expected image from the estimated model (g(Θ, i)) at each b-value i. We apply the block matching-based, diffeomorphic, non-rigid registration algorithm proposed by Commowick et al. (2012) using cross-correlation as a measure of intra b-value image similarity. In this algorithm, as opposed to utilizing a classical, translation-based block matching strategy, a spatially sparse, locally optimal, rigid transformation- based block matching strategy was employed with an efficient numerical optimizer (BOBYQA). With this algorithm, both subvoxel displacements and rotations can be recovered. A dense, regularized velocity field is then computed from these local block-matching transformations with matrix logarithms and M-smoothing using a robust error norm. These two steps are iterated until convergence and the final diffeomorphic transformation is computed as the exponential of the accumulated velocity field.
2.3.3. Reconstruction of high SNR DW-MRI signal Si
In this step we update Si given the current estimate of from the registration step. We minimize Eqn. 4 to get the next estimate of the signal St+1.
2.3.4. Estimation of transformation Ti
We finally estimate transformation to align each reconstructed high SNR template image (Si) to b=0 s/mm2 image (S1) to correct for the remaining misalignments between multiple b-value images. Inter b-value alignment is more accurate at this stage since Si images have higher SNR than images–even for those with high b-values. We use the same block-matching registration algorithm for inter b-value registration but replace the similarity measure with squared cross-correlation.
We initialize the algorithm with the acquired DW-MRI data as the current estimate of the signal after applying an initial registration algorithm. We then alternate in making iterative estimates of the model parameters, transformations for registration, and the high SNR DW-MRI signal until the change in model parameter estimates become negligible (i.e. less than 1 percent), or until the maximum number of steps are reached. The steps involved in the optimization algorithm are summarized in Table 1.
3. Experiments
We have tested the performance of the proposed motion-compensated, model estimation framework on in-vivo DW-MRI data of lower abdomen in 26 Crohn’s disease (CD) patients and in-vivo DW-MRI of upper abdomen in 20 patients using a 1.5T MRI scanner (Magnetom Avanto, Siemens Medical Solutions, Erlangen, Germany) with an 8-channel, body matrix receive coil. Free-breathing, single-shot echo-planar imaging was performed using the following parameters: repetition time/echo time (TR/TE)= 7500/77 ms; SPAIR fat suppression; matrix size = 192×156; field of view = 300×260 mm; number of excitations = 1; slice thickness/gap = 5 mm/0mm; 40 axial slices; 7 b-values=0, 50, 100, 200, 400, 600, 800 s/mm2. We used a six-directional gradient scheme to acquire 6 successive images, at each non-zero b-value. We also acquired 3 repeated images at b-value=0. The overall acquisition time was 5.5 min.
3.1. Pre-processing: Intra-volume registration
Each DW-MRI volume includes 40 two-dimensional slices acquired in an interleaved fashion to reduce cross-talk between slices. The odd slices are acquired first, followed by even slices. Two consecutive slices within a volume are acquired 4 seconds apart, and therefore misaligned due to physiological motion. Before applying the proposed SIR-ME model for motion compensated parameter estimation, we applied an intra-volume registration, described in Guyader et al. (2014), as a pre-processing step. We first constructed two sub-volumes: one volume from odd and one from even slices, with a doubled slice thickness. We aligned these two sub-volumes using the non-rigid registration algorithm described in Section 2.3.2. The intra-volume motion corrected volume is then computed by averaging the two registered sub volumes that are resampled to the original size. ’s are the inputs of the proposed motion-compensated parameter estimation framework.
3.2. Precision of SIR-ME model parameter estimates from in-vivo DW-MRI experiments
We analyzed the effect of motion on estimating parameters. Specifically, we quantified improvements in the precision of parameter estimates achieved when using the SIR-ME model compared to precision achieved without (w/o) registration and with registration using in-vivo DW-MRI experiments. We used the same pre-processing step for both with registration and the SIR-ME methods.
We quantified the uncertainty of estimating parameters using the wild-bootstrap analysis (Freiman et al., 2011) on all in-vivo DW-MRI datasets as follows: First, we resampled multiple sets of the diffusion signal for each b-value from the estimated signal model using the bootstrap resampling strategy. Next, we estimated the diffusion signal decay model parameters (D, D*, f) using different methods: 1) w/o registration; 2) with independent registration to b=0s/mm2 image following the method explained in Guyader et al. (2014); and 3) with the proposed SIR-ME model for each set of generated DW-MRI signals at multiple b-values. Last, as a measure of the uncertainty of the parameter estimation, we calculated for each method the percent coefficient of variation (CV%=standard deviation/mean ×100) of the parameter estimates at each voxel. This measure indicates to what degree parameter estimates may vary over multiple bootstrap resampling repetitions. The smaller the CV% value, the more precise the parameter estimation. We performed student t-tests to compare the CV%’s obtained using these models.
3.2.1. DW-MRI of Normal and Diseased Bowel in Crohn’s Disease Patients
We ran these experiments on lower abdominal DW-MRI scans of 26 CD subjects and computed the precision of parameter estimates in both normal and diseased areas of bowel. Figure 1 depicts a representative image with the manually annotated ROIs of normal-appearing and diseased bowel regions used for the analysis.
Figure 1.
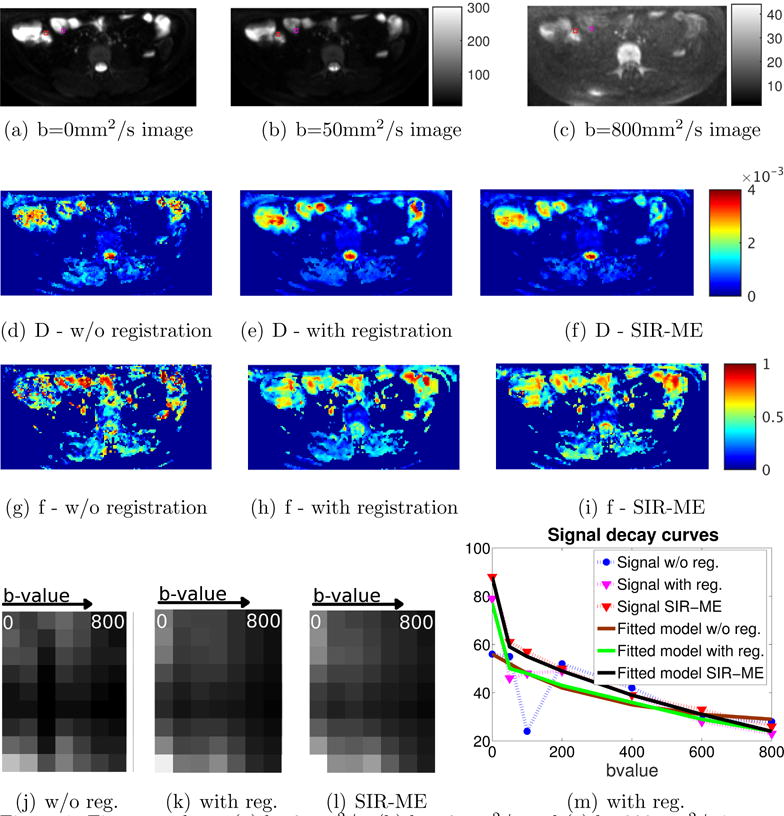
First row shows (a) b=0mm2/s, (b) b=50mm2/s and (c) b=800mm2/s images. The labeled bowel wall with Crohn’s disease with restricted diffusion is indicated with a red square (of size 3 × 3 voxels) and the normal-appearing bowel wall with normal diffusion is indicated with magenta square. The second row shows the D parameter maps of the same slice for (d) w/o registration, (e) with registration, and (f) with SIR-ME methods. The third row compares the parameter maps for (g) w/o registration, (h) with registration and (i) with SIR-ME methods. SIR-ME method parameters maps had improved visual quality compared to the other maps. The last row, left panels compares 3 images. Each image is composed of 7 columns extracted from a CD region of each b-value image and concatenated into a 7-column image. These 7 columns are plotted in the order of increasing b-values (from left to right). These concatenated images are compared for (j) w/o registration, (k) with registration and (l) with SIR-ME methods. Because signal decays bi-exponentially with increasing b-values, in the motion-compensated case we see a smooth decay from bright to dark pixels from column 1 to 7. However in w/o registration case, because of the effect of motion, we do not see a smooth decay. Instead, we see jumps at some locations. Similar results are shown in Fig. 174b. Right panel shows signal decay curves for a selected voxel from the CD area is plotted against increasing b-values using w/o registration (blue), with registration (magenta), and SIR-ME (red) methods. The models fitted to each signal decay curve (i.e., brown, green, and black curves) are also plotted for each method, respectively. The signal decay curve from the SIR-ME method had a smaller model fitting error, i.e. root mean square error (RMSE) of 1.40, compared to the RMSE of w/o registration (10.22) and with registration (3.10) methods.
3.2.2. DW-MRI of Normal Liver
We also ran the precision experiments on upper abdominal DW-MRI scans of 20 subjects and computed the precision of parameters in normal liver regions.
3.3. Performance of SIR-ME model parameter estimates to differentiate normal-appearing and diseased bowel regions
The inflammation and fibrosis associated with Crohn’s disease changes the signal decay model parameters in effected bowel regions (Oto et al., 2011; Freiman et al., 2013; Maccioni et al., 2012; Morani et al., 2015). Using in-vivo DW-MRI experiments, we computed the classification accuracy of the estimated model parameters using the SIR-ME model to differentiate diseased regions from normal-appearing bowel regions. We compared these accuracies with those obtained w/o registration and with registration methods.
4. Results
First row of Figure 1 shows 3 different b-value images indicating the labeled bowel wall with Crohn’s disease and the normal looking bowel wall. The second and third row of Figure 1 compares resultant parameter maps of D and f parameters estimated using w/o registration, with registration, and SIR-ME methods. SIR-ME model results in improved parameter maps with less noise due to the effect of motion compensation. The left panel of the last row in Figure 1 shows an image column selected around the CD area plotted for increasing b-values using (j) w/o registration, (k) with registration and (l) SIR-ME methods. The image intensity decays smoothly, without jumps, with increasing b-values due to motion correction when the SIR-ME model is used.
A representative signal decay curve in the right panel of the last row in Figure 1 (m) shows a reduced level of error using the SIR-ME model. Figure 1 compares the measured signals and the signal decay model fitted to each measured signal, respectively. The measured signals, however, deviate from a bi-exponential decay curve due to the effect of motion at different b-values. The original measured signal w/o registration (i.e., the blue curve with circles) is heavily affected by motion; while the signal with registration (i.e., the magenta curve with crosses) is less affected by motion. The effect of motion is even further reduced when the SIR-ME model (i.e., the red curve with plus signs) is applied. The SIR-ME model also performs the best parameter fitting with the lowest errors compared to the model fitting errors that were obtained w/o registration and with registration methods.
4.1. Precision of SIR-ME model parameter estimates from in-vivo DW-MRI experiments
4.1.1. DW-MRI of Normal and Diseased Bowel in Crohn’s Disease Patients
The precision of parameter estimation computed on normal and diseased bowel regions of 26 Crohn’s disease patients are shown in Figure 2. The bar-plots of the CV% of parameter estimates over multiple bootstrap resampling repetitions are compared for those estimates obtained w/o-registration, with registration, and with the SIR-ME method, respectively. The CV% of parameter estimates obtained without registration were 37% for D; 64% for D*; 28% for the f parameter determined in the regions with CD; 43% for D; 84% for D*; and 40% for the f parameter in normal-appearing regions. While the CV% of parameter estimates obtained by the SIR-ME model were 16% for D, 32% for D*, and 11% for the f parameter in the regions with CD; they were 17% for D, 56% for D*, and 25% for the f parameter in normal-appearing regions. The CV% of the SIR-ME model parameter estimates was also lower for all parameters compared to those obtained w/o registration and with registration methods. The reduction in the CV% using the SIR-ME method was statistically significant for both D and f parameters, respectively, in CD regions (student t-test, p < 0.05), and for all parameters (student t-test, p < 0.05) in normal-appearing regions compared to those parameters obtained using the with registration method.
Figure 2.
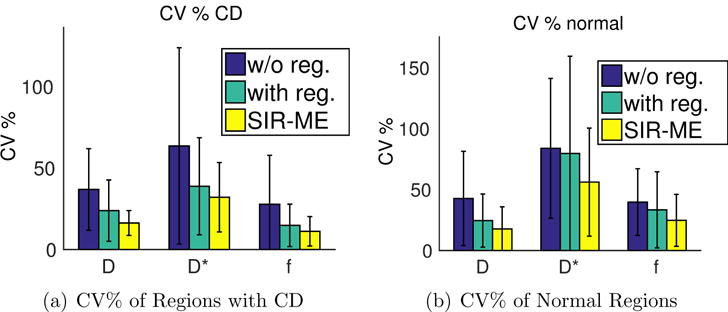
Bar plot of CV% of multiple bootstrap parameter estimates computed on 26 subjects in a) regions with CD b) normal-appearing regions. The reduction in the CV% using the SIR-ME method was statistically significant for both D and f parameters, respectively, in CD regions (student t-test, p < 0.05), and for all parameters (student t-test, p < 0.05) in normal-appearing regions compared to those parameters obtained using the with registration method.
4.1.2. DW-MRI of Normal Liver
The precision of parameter estimation computed on liver regions of 20 subjects are shown in Figure 3. Lower CV% indicates higher precision of parameter estimation. The bar-plots show comparisons of the CV% of parameter estimates over multiple bootstrap resampling repetitions for those estimates obtained w/o-registration, with registration, and with the SIR-ME method, respectively. We also generated similar results using the conventional IVIM model (b) instead of the recently proposed SPIM model (a) for parameter estimation. The CV% of parameter estimates obtained without registration were 19% for D; 44% for D*; 24% for the f parameter determined in the regions of normal liver using SPIM model. Using the with registration method for motion compensation, the CV%’s were lowered to 11% for D, 37% for D*, and 14% for the f parameter in normal liver regions. The CV%’s were further reduced to 7% for D, 23% for D*, and 8% for the f parameter when the proposed SIR-ME method is used. The reductions in the CV% using the SIR-ME method were statistically significant for all parameters (student t-test, p < 0.01) compared to the results obtained using the w/o-registration method. The reductions were also statistically significant for all parameters (student t-test, p < 0.05) compared to the results obtained using the with registration method. Using the IVIM model, we obtained CV%s of 24% for D; 92% for D*; 43% for the f parameter. in the regions of normal liver. Using the with registration method for motion compensation, the CV%’s were lowered to 11% for D, 67% for D*, and 22% for the f parameter in normal liver regions. The CV%’s were further reduced to 8% for D, 50% for D*, and 10% for the f parameter when the proposed SIR-ME method is used together with the IVIM model. The SPIM model achieved lower CV%s and higher precisions than the IVIM model for all methods, but the differences were especially significant for w/o registration case, where the spatially constrained model fitting method (SPIM) had to compensate for both the effect of motion and the noise.
Figure 3.
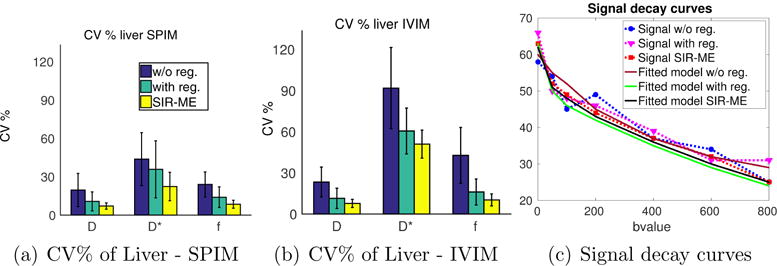
Bar plot of CV% of multiple bootstrap parameter estimates computed on liver regions of 20 subjects are shown using the SPIM (a), and the IVIM (b) models when w/o registration, with registration and SIR-ME methods are applied for motion compensation. The reduction in CV% using the SIR-ME method was statistically significant (student t-test p < 0.01) compared to CV percentages obtained w/o registration for all parameters using both SPIM (a) and IVIM (b) models. The reduction in CV% using the SIR-ME method was also statistically significant for all parameters (student t-test, p < 0.05) compared to CV percentages obtained with the registration method for both IVIM and SPIM models. SPIM model parameters had lower CV%’s than the CV% of IVIM model parameters for all three methods, but the CV%’s were especially lower for the w/o registration case. Fig. (c) shows the signal decay curves of a sample voxel from the liver region plotted against increasing b-values using w/o registration (blue), with registration (magenta) and SIR-ME methods (red) using SPIM model. The model fitted to each signal decay curve (i.e., brown, green, and black curves) is also plotted for each method, respectively. SIR-ME method achieved a motion compensated signal decay curve and resulted in the smallest model fitting error among all three methods.
4.2. Performance of SIR-ME model parameter estimates to differentiate normal-appearing regions from diseased bowel regions
We compared the performance of estimated parameters in differentiating normal-appearing from diseased bowel regions in over 26 subjects. TABLE 2 compares the mean values of the parameters for normal-appearing and diseased bowel regions, computed w/o registration, with registration, and with the SIR-ME model. These results demonstrated that the proposed SIR-ME model estimated f and D parameters with greater precision and lower intra-group standard deviation compared to the other two models. Moreover, we observed an increased, statistically significant difference between the two groups using the SIR-ME model compared to the other two models, which indicates superior discrimination power. We also trained Naive Bayes classifiers for D and f parameters independently, and reported their classification error in the last column of TABLE 2. When training a classifier using both f and D parameters, we obtained classification errors of 0.25 w/o registration, 0.10 with registration, and 0.06 with SIR-ME. In summary, these results showed that SIR-ME model achieved the most accurate classification, with the lowest error for both f and D parameters when classified both independently and jointly using this method. While SIR-ME method improved the precision of D* parameter estimation, D* parameter still did not provide a good classification between diseased and normal regions, possibly due to combined effect of limited SNR in abdominal images, limited number of b-values and motion (Andreou et al., 2013; Freiman et al., 2013).
Table 2.
Comparison of mean and standard deviation of parameters estimated w/o registration, with independent registration and with the SIR-ME model for normal-appearing and Crohn’s disease bowel regions. D and D* parameters are in in units of μm2/ms. The results showed statistically significant difference between the two groups using the SIR-ME model compared to the other two models, which indicates superior discrimination power. The performance of SIR-ME parameters for classifying normal and abnormal bowel regions are also better compared to the other two models, with lower error rates.
| Normal-appearing bowel regions | Bowel regions with Crohn’s disease | ||||
|---|---|---|---|---|---|
|
| |||||
| Parameter | Method | Mean ± SD | Mean ± SD | p-value | Classif. Error Rate |
|
| |||||
| D | w/o reg | 1.80 ± 0.87 | 1.1 ± 0.54 | 0.001 | 0.27 |
| with reg | 1.98 ± 0.73 | 1.26 ± 0.41 | 5 × 10⁻⁵ | 0.25 | |
| SIR-ME | 2.28 ± 0.36 | 1.42 ± 0.27 | 4 × 10⁻¹³ | 0.12 | |
|
| |||||
| f | w/o reg | 0.56 ± 0.27 | 0.42 ± 0.23 | 0.05 | 0.37 |
| with reg | 0.57 ± 0.19 | 0.34 ± 0.17 | 4 × 10⁻⁵ | 0.21 | |
| SIR-ME | 0.56 ± 0.13 | 0.27 ± 0.09 | 2 × 10⁻¹² | 0.10 | |
|
| |||||
| D* | w/o reg | 44 ± 47 | 39 ± 50 | 0.64 | 0.40 |
| with reg | 43 ± 39 | 64 ± 60 | 0.13 | 0.40 | |
| SIR-ME | 52 ± 47 | 63 ± 57 | 0.46 | 0.42 | |
Figure 4 shows how the SIR-ME model improved the signal decay consistency along the b-value direction on a bowel region with CD. An image region (columnn of an image) taken from the indicated region (white rectangle in a)) on b=0s/mm2 image is plotted against increasing b-values in b). Figure 4 b) compares how the image intensity decays with increasing b-values w/o registration, with registration and with the SIR-ME model. Of these three approaches, the SIR-ME method achieved the best motion-compensation that resulted in smoothly decaying intensities along the b-value dimension. Without motion compensation, the image intensity decay is not very smooth and includes jumps in the signal due to the effect of motion.
Figure 4.
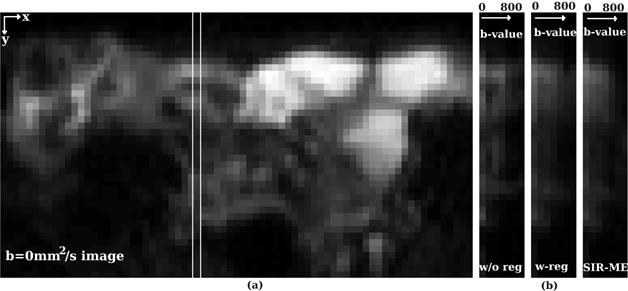
A column from a b-value=0 image of a CD patient is selected and depicted by the white rectangle in a). The measured signal from the selected column is plotted against increasing b-values in b) for b-values w/o registration, with registration and with the SIR-ME method. In summary, the SIR-ME method successfully compensated for the effect of motion and resulted in smoothly decaying intensities along the b-value dimension.
5. Conclusions and Discussion
Quantitative abdominal DW-MRI is increasingly used in evaluating patients with a known or suspected disease in liver, spleen and bowel. Specific applications include distinguishing between diseased and normal-appearing regions (e.g., areas of inflamed bowel characteristic of Crohn’s disease (Neubauer et al., 2013)) and monitoring response-to-therapy for various cancers of the abdomen. Our ability to successfully utilize quantitative DW-MRI in routine clinical practice depends, however, on developing methods for estimating signal decay parameters that are robust to the presence of motion and to the low SNR generated in abdominal DW-MRI images.
The signal decay models for quantitative DW-MRI analysis most commonly used (e.g., the mono-exponential decay model; the intra-voxel incoherent motion model (Le Bihan et al., 1988); and its recent extension to the probability diffusion model (Kurugol et al., 2016) describe the signal decay at a specific voxel, effectively ignoring the presence of motion during the DW-MRI acquisition. As a consequence, voxel-wise parameter estimates obtained using these models are frequently subject to motion-related errors.
In this work, we have presented a new model of DW-MRI signal decay that explicitly accounts for the respiratory, cardiac, and peristaltic motion present in the abdomen. Our model consists of a probability distribution model characterizing the full range of diffusion scales that attenuate the DW-MRI signal, along with a free-form transformation model of the motion which may be present during the DW-MRI acquisition. We use a spatially-regularized Markov Random Field parameter estimation framework to account for the typically low SNR present in the DW-MRI signal.
We estimate signal decay model parameters by simultaneously solving the image registration and model estimation (SIR-ME) problems utilizing the interdependence of acquired volumes along the diffusion-weighting dimension. This method simultaneously estimates the motion-compensated, high SNR b-value images from the model while also aligning the images acquired to this template. The dependence of high SNR b-value images through the signal decay model is used as a prior when reconstructing the high SNR b-value image from the low SNR-acquired images.
Our experiments on in-vivo DW-MRI images from 26 Crohn’s disease patients showed that the parameters estimated using the proposed SIR-ME model achieved improved precision with a 21, 32 and 17% reduction of CV% in the D, D*, and f parameters, respectively, for diseased bowel regions; and a 16, 28, and 25% reduction for normal-appearing bowel regions compared to CV%’s of parameters estimated without motion compensation. The reductions in CV% when using the SIR-ME model were also statistically significant when compared to the CV% of the f and D parameters estimated with the independent registration of the b=0 s/mm2 image. Moreover, the reconstructed, motion-compensated, high SNR b-value images had smooth signal decay in the b-value dimension; and the effect of motion was reduced compared to the original images, which showed jumps in the signal in the b-value dimension because of motion artifact. The parameter maps of bowel regions estimated using the SIR-ME model were less noisy and of higher quality. Moreover, the parameters estimated using the SIR-ME had a lower intra-group standard deviation and achieved better discrimination power between normal-appearing and diseased bowel regions compared to parameter estimates obtained without registration and with independent registration. The classification error rate in using the D parameter was reduced from 27 to 25% when using independent registration, and was further reduced to 12% when using the SIR-ME model. The classification error rate in using the f parameter was reduced from 37 to 21% when using independent registration and further reduced to 10% when using the SIR-ME method. Our method of a motion-compensated DW-MRI signal decay model, SIR-ME, achieved more robust and precise parameter estimates, effectively limiting the effect of respiratory, cardiac and peristaltic motion, which, in turn, will potentially increase the utility of these parameters for improved clinical decision-making.
The effects of respiratory and cardiac motion are more prevalent in upper abdominal areas such as liver regions. Our experiments on in-vivo DW-MRI images of liver regions in 20 subjects showed that these regions also benefited from utilization of the SIR-ME model for parameter estimation. The proposed motion-compensated parameter estimation framework had significantly reduced the CV% for all parameters, which indicate an improved precision of parameter estimates in liver regions. Precise estimation of parameters in the liver will potentially increase the utilization of DW-MRI of liver for several important clinical applications including detection and characterization of liver lesions, diagnosis of liver fibrosis and cirrhosis, and estimation of tumor perfusion (Taouli et al., 2009).
Our study had several limitations: First, this work included the in-vivo DW-MRI datasets from 26 subjects with Crohn’s disease. For assessing the clinical utility of the proposed, motion-compensated parameter estimation technique, we must initiate a large clinical study to evaluate these quantitative markers in Crohn’s disease patients. Second, the DW-MRI protocol for acquiring study data was limited to the clinical protocol used at our institution for imaging CD patients. The effect of b-value selection on the performance of parameter estimates, as demonstrated by previous work (Lemke et al., 2011), needs to be evaluated in future work.
Highlights.
Motion-robust parameter estimation is needed in abdominal diffusion-weighted MRI.
We propose a novel simultaneous image registration and model estimation (SIR-ME) framework.
SIR-ME utilizes dependency of acquired b-value images along the diffusion-weighting dimension.
Jointly estimates transformations for the non-rigid alignment and signal decay model parameters
Increases precision of parameters, improves discrimination of normal and diseased bowel.
Acknowledgments
This work is supported by Crohn’s and Colitis Foundation of America’s Career Development Award, the National Institute of Diabetes & Digestive & Kidney Diseases of the NIH under award R01DK100404 and by the National Institute of Biomedical Imaging and Bioengineering (NIBIB) of the NIH under award R01EB019483.
Footnotes
Publisher's Disclaimer: This is a PDF file of an unedited manuscript that has been accepted for publication. As a service to our customers we are providing this early version of the manuscript. The manuscript will undergo copyediting, typesetting, and review of the resulting proof before it is published in its final citable form. Please note that during the production process errors may be discovered which could affect the content, and all legal disclaimers that apply to the journal pertain.
References
- Andreou A, Koh D, Collins D, Blackledge M, Wallace T, Leach M, Orton M. Measurement reproducibility of perfusion fraction and pseudodiffusion coefficient derived by intravoxel incoherent motion diffusion-weighted MRI in normal liver and metastases. European radiology. 2013;23:428–434. doi: 10.1007/s00330-012-2604-1. [DOI] [PubMed] [Google Scholar]
- Bhushan M, Schnabel JA, Risser L, Heinrich MP, Brady JM, Jenkinson M. International Conference on Medical Image Computing and Computer-Assisted Intervention. Springer; 2011. Motion correction and parameter estimation in dcemri sequences: application to colorectal cancer; pp. 476–483. [DOI] [PubMed] [Google Scholar]
- Buonaccorsi GA, O’Connor JPB, Caunce A, Roberts C, Cheung S, Watson Y, Davies K, Hope L, Jackson A, Jayson GC, et al. Tracer kinetic model–driven registration for dynamic contrast-enhanced mri time-series data. Magnetic Resonance in Medicine. 2007;58:1010–1019. doi: 10.1002/mrm.21405. [DOI] [PubMed] [Google Scholar]
- Chavhan GB, AlSabban Z, Babyn PS. Diffusion-weighted imaging in pediatric body MR imaging: Principles, technique, and emerging applications. RadioGraphics. 2014;34:E73–E88. doi: 10.1148/rg.343135047. [DOI] [PubMed] [Google Scholar]
- Commowick O, Wiest-Daesslé N, Prima S. MICCAI. Springer; 2012. Automated diffeomorphic registration of anatomical structures with rigid parts: Application to dynamic cervical MRI; pp. 163–170. [DOI] [PMC free article] [PubMed] [Google Scholar]
- Eisenberger U, Binser T, Thoeny HC, Boesch C, Frey FJ, Vermathen P. Living renal allograft transplantation: diffusion-weighted MR imaging in longitudinal follow-up of the donated and the remaining kidney. Radiology. 2013;270:800–808. doi: 10.1148/radiol.13122588. [DOI] [PubMed] [Google Scholar]
- Freiman M, Perez-Rossello JM, Callahan MJ, Voss SD, Ecklund K, Mulkern RV, Warfield SK. Reliable estimation of incoherent motion parametric maps from diffusion-weighted MRI using fusion bootstrap moves. Med Image Anal. 2013;17:325–336. doi: 10.1016/j.media.2012.12.001. [DOI] [PMC free article] [PubMed] [Google Scholar]
- Freiman M, Voss SD, Mulkern RV, Perez-Rossello JM, Warfield SK. Medical Image Computing and Computer-Assisted Intervention–MICCAI 2011. Springer; 2011. Quantitative body DW-MRI biomarkers uncertainty estimation using unscented wild-bootstrap; pp. 74–81. [DOI] [PMC free article] [PubMed] [Google Scholar]
- Guyader JM, Bernardin L, Douglas NH, Poot DH, Niessen WJ, Klein S. Influence of image registration on apparent diffusion coefficient images computed from free-breathing diffusion MRI of the abdomen. JMRI. 2014 doi: 10.1002/jmri.24792. [DOI] [PubMed] [Google Scholar]
- Huizinga W, Poot D, Guyader J, Klaassen R, Coolen B, van Kranenburg M, van Geuns R, Uitterdijk A, Polfliet M, Vandemeulebroucke J, et al. PCA-based groupwise image registration for quantitative MRI. Medical image analysis. 2016;29:65–78. doi: 10.1016/j.media.2015.12.004. [DOI] [PubMed] [Google Scholar]
- Jang KM, Kim SH, Hwang J, Lee SJ, Kang TW, Lee MW, Choi D. Differentiation of malignant from benign focal splenic lesions: Added value of diffusion-weighted MRI. American Journal of Roentgenology. 2014;203:803–812. doi: 10.2214/AJR.13.11914. [DOI] [PubMed] [Google Scholar]
- Kandpal H, Sharma R, Madhusudhan KS, Kapoor KS. Respiratory-triggered versus breath-hold diffusion-weighted MRI of liver lesions: comparison of image quality and apparent diffusion coefficient values. American Journal of Roentgenology. 2009;192:915–922. doi: 10.2214/AJR.08.1260. [DOI] [PubMed] [Google Scholar]
- Koh DM, Collins DJ. Diffusion-weighted MRI in the body: applications and challenges in oncology. AJR Am J Roentgenol. 2007;188:1622–1635. doi: 10.2214/AJR.06.1403. [DOI] [PubMed] [Google Scholar]
- Koh DM, Collins DJ, Orton MR. Intravoxel Incoherent Motion in Body Diffusion-Weighted MRI: Reality and Challenges. AJR Am J Roentgenol. 2011;196:1351–1361. doi: 10.2214/AJR.10.5515. [DOI] [PubMed] [Google Scholar]
- Kurugol S, Freiman M, Afacan O, Domachevsky L, Perez-Rossello JM, Callahan MJ, Warfield SK. Medical Image Computing and Computer-Assisted Intervention–MICCAI 2015. Springer; 2015. Motion compensated abdominal diffusion weighted MRI by simultaneous image registration and model estimation (SIR-ME) pp. 501–509. [DOI] [PMC free article] [PubMed] [Google Scholar]
- Kurugol S, Freiman M, Afacan O, Perez-Rossello J, Callahan M, Warfield S. Spatially-constrained probability distribution model of incoherent motion (SPIM) for abdominal diffusion-weighted MRI. Medical image analysis. 2016;32:173–183. doi: 10.1016/j.media.2016.03.009. [DOI] [PMC free article] [PubMed] [Google Scholar]
- Kurugol S, Freiman M, Afacan O, Perez-Rossello JM, Callahan MJ, Warfield SK. MICCAI Abd Imag Workshop Lecture Notes in Computer Science. Springer; 2014. Spatially-constrained probability distribution model of incoherent motion in diffusion weighted MRI signals of Crohn’s disease. [Google Scholar]
- Kwee TC, Takahara T, Koh DM, Nievelstein RA, Luijten PR. Comparison and reproducibility of ADC measurements in breathhold, respiratory triggered, and free-breathing diffusion-weighted MR imaging of the liver. Journal of Magnetic Resonance Imaging. 2008;28:1141–1148. doi: 10.1002/jmri.21569. [DOI] [PubMed] [Google Scholar]
- Le Bihan D, Breton E, Lallemand D, Aubin ML, Vignaud J, Laval-Jeantet M. Separation of diffusion and perfusion in intravoxel incoherent motion MR imaging. Radiology. 1988;168:497–505. doi: 10.1148/radiology.168.2.3393671. [DOI] [PubMed] [Google Scholar]
- Le Bihan D, Turner R. Intravoxel incoherent motion imaging using spin echoes. Magnetic resonance in medicine. 1991;19:221–227. doi: 10.1002/mrm.1910190206. [DOI] [PubMed] [Google Scholar]
- Lemke A, Stieltjes B, Schad LR, Laun FB. Toward an optimal distribution of b values for intravoxel incoherent motion imaging. Magn Reson Imaging. 2011;29:766–76. doi: 10.1016/j.mri.2011.03.004. [DOI] [PubMed] [Google Scholar]
- Maccioni F, Patak MA, Signore A, Laghi A. New frontiers of MRI in crohn’s disease: motility imaging, diffusion-weighted imaging, perfusion MRI, MR spectroscopy, molecular imaging, and hybrid imaging (PET/MRI) Abdominal imaging. 2012;37:974–982. doi: 10.1007/s00261-012-9890-6. [DOI] [PubMed] [Google Scholar]
- Mazaheri Y, Do RK, Shukla-Dave A, Deasy JO, Lu Y, Akin O. Motion correction of multi-b-value diffusion-weighted imaging in the liver. Academic radiology. 2012;19:1573–1580. doi: 10.1016/j.acra.2012.07.005. [DOI] [PMC free article] [PubMed] [Google Scholar]
- Morani AC, Smith EA, Ganeshan D, Dillman JR. Diffusion-weighted MRI in pediatric inflammatory bowel disease. American Journal of Roentgenology. 2015;204:1269–1277. doi: 10.2214/AJR.14.13359. [DOI] [PubMed] [Google Scholar]
- Neubauer H, Pabst T, Dick A, Machann W, Evangelista L, Wirth C, Köstler H, Hahn D, Beer M. Small-bowel MRI in children and young adults with Crohn disease: retrospective head-to-head comparison of contrast-enhanced and diffusion-weighted MRI. Pediatric radiology. 2013;43:103–114. doi: 10.1007/s00247-012-2492-1. [DOI] [PubMed] [Google Scholar]
- Oto A, Kayhan A, Williams JTB, Fan X, Yun L, Arkani S, Rubin DT. Active Crohn’s disease in the small bowel: evaluation by diffusion weighted imaging and quantitative dynamic contrast enhanced MR imaging. J Magn Reson Imaging. 2011;33:615–624. doi: 10.1002/jmri.22435. [DOI] [PubMed] [Google Scholar]
- Taouli B, Koh DM. Diffusion-weighted MR imaging of the liver. Radiology. 2010;254:47–66. doi: 10.1148/radiol.09090021. [DOI] [PubMed] [Google Scholar]
- Taouli B, Sandberg A, Stemmer A, Parikh T, Wong S, Xu J, Lee VS. Diffusion-weighted imaging of the liver: Comparison of navigator triggered and breathhold acquisitions. Journal of Magnetic Resonance Imaging. 2009;30:561–568. doi: 10.1002/jmri.21876. [DOI] [PubMed] [Google Scholar]
- Yoon JH, Lee JM, Yu MH, Kiefer B, Han JK, Choi BI. Evaluation of hepatic focal lesions using diffusion-weighted MR imaging: Comparison of apparent diffusion coefficient and intravoxel incoherent motion-derived parameters. Journal of Magnetic Resonance Imaging. 2014;39:276–285. doi: 10.1002/jmri.24158. [DOI] [PubMed] [Google Scholar]