
Figure 2. Kaplan–Meier survival curves for progression-free survival (PFS) in SCLC patients after diagnoses.
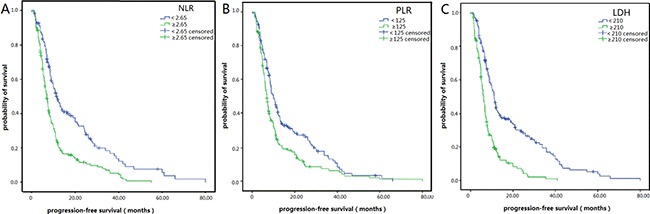
(A) PFS of patients with NLR < 2.65 was longer than those with NLR ≥ 2.65. (P < 0.001, log-rank). (B) PFS of patients with PLR < 125 was longer than those with PLR ≥ 125. (P = 0.001, log-rank). (C) PFS of patients with LDH < 210 was longer than those with LDH ≥ 210. (P < 0.001, log-rank).