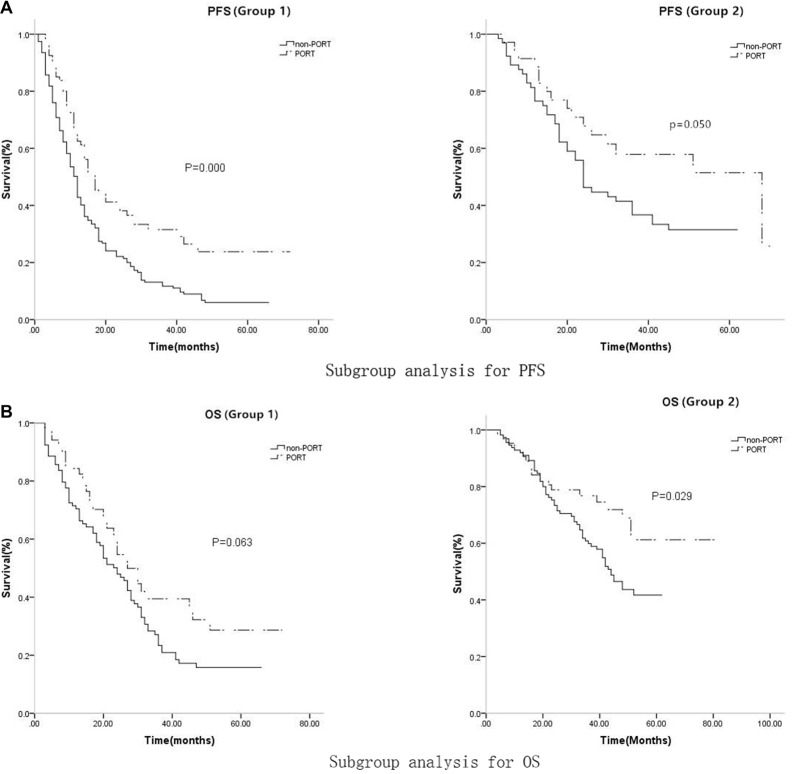
Figure 5. For PFS, In low-score group, the median PFS and 3-year PFS probability were 12 months (95%CI: 10.462-13.538) and 11.7% for non-PORT subgroup, while 17 months (95%CI: 13.340–20.660) and 31.5% for PORT subgroup respectively, (p = 0.000).
In high-score group, the median PFS and 3-year PFS probability were 24 months(95% CI: 19.558–28.412) and 36.7% for non-PORT subgroup, while 46 months (95% CI: 26.660–58.962) and 57.9% for PORT subgroup respectively, (p = 0.050); for OS, In low-score group, the median OS and 3-year OS probability were 24 months (95% CI: 18.830–29.170) and 23.4% for non-PORT subgroup, while 27 months (95% CI: 21.017–32.983) and 35.8% for PORT subgroup respectively, (p = 0.063); In high-score group, the median OS and 3-year OS probability were 44 months (95%CI: 37.909–50.091) and 59.9%% for non-PORT subgroup, while 56 months (95% CI: 50.134–64.962) and 76.8% for PORT subgroup respectively, (p = 0.029).

