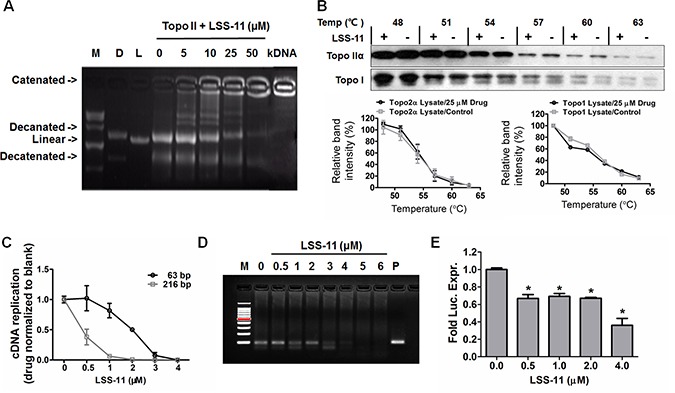
Figure 4. LSS-11 inhibits DNA polymerase, topoisomerase II and minimal TA promoter-drove luciferase reporter expression.

(A) The impact of indicated concentrations of LSS-11 on decatenation of kDNA by Topo II. “D” refers to decatenated DNA, “L” means linear DNA, kDNA without any treatment was included as a blank control. (B) The impact of LSS-11 on the thermal stabilities of Topo IIα and Topo I determined by CETSA as described in Materials and methods. Quantification of band intensity was performed by ImageJ and shown as bar graph in the lower panel. (C) The impact of LSS-11 on the amplification efficiency of Taq DNA polymerase in real time fluorescent quantitative PCR. 63 bp and 216 bp represent the sizes of amplicons. (D) The impact of LSS-11 on the efficiency of isothermal helicase-dependent amplifications. Lane M, marker; lane P, positive control. (E) Relative luciferase activities of SW480 cells transfected with pGL-6 TA luciferase reporter, the luciferase activity (arbitrary unit) was normalized by the luciferase activity of cells treated with vehicle only. *p < 0.05; compare with control cells.
