Abstract
Mitochondria are complex organelles with a highly dynamic distribution and internal organization. Here, we demonstrate that mitofilin, a previously identified mitochondrial protein of unknown function, controls mitochondrial cristae morphology. Mitofilin is enriched in the narrow space between the inner boundary and the outer membranes, where it forms a homotypic interaction and assembles into a large multimeric protein complex. Down-regulation of mitofilin in HeLa cells by using specific small interfering RNA lead to decreased cellular proliferation and increased apoptosis, suggesting abnormal mitochondrial function. Although gross mitochondrial fission and fusion seemed normal, ultrastructural studies revealed disorganized mitochondrial inner membrane. Inner membranes failed to form tubular or vesicular cristae and showed as closely packed stacks of membrane sheets that fused intermittently, resulting in a complex maze of membranous network. Electron microscopic tomography estimated a substantial increase in inner:outer membrane ratio, whereas no cristae junctions were detected. In addition, mitochondria subsequently exhibited increased reactive oxygen species production and membrane potential. Although metabolic flux increased due to mitofilin deficiency, mitochondrial oxidative phosphorylation was not increased accordingly. We propose that mitofilin is a critical organizer of the mitochondrial cristae morphology and thus indispensable for normal mitochondrial function.
INTRODUCTION
Mitochondria are the center of cellular energy production and essential metabolic reactions. As double membrane-bound organelles, mitochondria from different species, tissues, and metabolic states are highly polymorphic in nature yet exhibit common structural features. The ultrastructural variations in mitochondrial architecture occur mainly due to the differences in the amount and shape of cristae, which derive from the infolded inner membrane in which protein complexes of oxidative phosphorylation and intermediate metabolism are embedded. Abundant cristae are found in mitochondria from tissues where energy demand is high. For example, mitochondria with densely packed cristae are observed in the flight muscle of the dragonfly, whereas the liver of a winter-starved frog displays mitochondria with sparse cristae (Ghadially, 1997). Furthermore, the inner membranes of isolated mitochondria undergo characteristic morphological changes in response to the metabolic state (Hackenbrock, 1966). Although little is known about the molecular mechanisms regulating cristae biogenesis and architecture, recent studies have implicated proteins resident in both the outer and inner membrane to have roles in this process.
The mitochondrial fission and fusion machinery plays an essential role in the dynamics, division, distribution, and morphology of the organelle (Yaffe, 1999; Jensen et al., 2000; Griparic and van der Bliek, 2001; Shaw and Nunnari, 2002). Three evolutionarily conserved large GTPases, Dnm1/Drp1/Dlp1, Fzo1/mitofusin, and Mgm1/MspI/OPA1, are core components of this machinery. Dnm1/Drp1/Dlp1 and Fzo1/mitofusin are outer membrane proteins responsible for mitochondrial fission and fusion, respectively (Hales and Fuller, 1997; Hermann et al., 1998; Otsuga et al., 1998; Labrousse et al., 1999; Sesaki and Jensen, 1999). The intermembrane space-based Mgm1p is involved in inner membrane remodeling and facilitates the mitochondrial fusion process by forming a complex with Fzo1 and Ugo1 (Sesaki et al., 2003; Wong et al., 2003). OPA1, the human homologue of the yeast Mgm1, is associated with autosomal dominant optic atrophy, a childhood disease in which blindness is caused by degeneration of retinal ganglion cells and optic nerve atrophy (Alexander et al., 2000; Delettre et al., 2000). Down-regulation of OPA1 in HeLa cells resulted in abnormal cristae morphology (Olichon et al., 2002). In addition to the fission and fusion machinery, the yeast inner membrane protein Mdm33 also has been shown to affect intramitochondrial morphogenetic processes, possibly by promoting inner membrane fission (Messerschmitt et al., 2003). A recent study has implicated ATP synthase in regulating cristae morphology. Subunits e and g of the F0 domain are nonessential components of ATP synthase but are required for dimerization and oligomerization (Collinson et al., 1994; Boyle et al., 1999). The mutants in either subunit exhibit intramitochondrial onion-like membranous structures (Paumard et al., 2002). Stacks of membrane sheets also were observed in the yeast mutant of Mmm1p, an outer membrane protein that has been hypothesized to bridge the inner and outer membranes and to provide anchorage to mitochondrial DNA nucleoids in the matrix (Hobbs et al., 2001).
Mitofilin was originally described as heart muscle protein (HMP) because of its high expression in the heart (Icho et al., 1994). Recently, analysis of the human heart mitochondrial proteome showed that mitofilin is one of the most abundant mitochondrial proteins (Taylor et al., 2003). Mitofilin was reported to express as two alternately spliced variants to produce two protein products of 88 and 90 kDa (Odgren et al., 1996; Gieffers et al., 1997). The protein is characterized by the presence of a predicted cleavable amino terminal mitochondrial targeting signal, membrane-anchoring sequence, and central coiled coil domains. In vitro import experiments showed that mitofilin is anchored to the mitochondrial inner membrane, whereas most of the protein faces the intermembrane space (Gieffers et al., 1997). Furthermore, immunoelectron microscopy revealed that labeled gold particles preferentially decorated the periphery of the mitochondria (Odgren et al., 1996). To assess the physiological function of mitofilin, we have examined the phenotypic effects of mitofilin knockdown in cultured cells. We observed drastically abnormal mitochondrial inner membrane architecture due to mitofilin deficiency. In the present study, we discuss the role of the protein in the maintenance of cristae morphology.
MATERIALS AND METHODS
Plasmids and Expression Constructs
The mouse mitofilin was cloned by polymerase chain reaction (PCR) with Vent polymerase (New England Biolabs, Beverly, MA) from an embryonic day 17 cDNA library (BD Biosciences Clontech, Palo Alto, CA) by using the primer sequences derived from mouse expressed sequence tag database. The plasmid for the expression of mitofilin-FLAG was obtained by PCR amplification of the mitofilin coding region with primers (IDT, Skokie, IL) 5′-ACGCGGATCCACCATGCTGCGGGCGTGTCAGT-3′ (P185) and 5′-ACGCGGATCCCTCTTGCTGCACTTGAGTG-3′ and cloning into the BamHI site of pCMVTag1 (Stratagene, La Jolla, CA). The plasmid for in vitro transcription of mitofilin was generated by digesting pCMVTag1mitofilin-FLAG with NotI and HindIII and cloning into the EcoRV site in pCDNA3 (Invitrogen, Carlsbad, CA). The NotI-HindIII fragment also was cloned into the EcoRI site of pMSCVpuro (BD Biosciences Clontech) for retroviral production. pCDNA3 Su9DHFR was constructed by digesting pGEM4Z Su9-DHFR (Pfanner et al., 1987) with EcoRI and HindIII and cloned into the EcoRV site in pCDNA3. Subunit 9 of ATP synthase (Su9) was removed from pCDNA3 Su9DHFR through BamHI digestion and replaced with either 1–78 or 1–187 amino acids of mitofilin by using the PCR amplification product of P185 and 5′-GGATCCGGTTTTCTCTACACTTTCCCGG-3′ (P317) or P185 and 5′-ACGCGGATCCGGGTGGTCGCTCCCTTACAG-3′ (P340) at the BamHI site. The BamHI fragment from pCMVTag1 mitofilin-FLAG was cloned in frame upstream of green fluorescent protein (GFP) to generate pEGFPN3 mitofilin-GFP (BD Biosciences Clontech). The mitofilin (1–187)-GFP was generated by PCR amplification with P185 and P340 and cloned into the BamHI site in pEGFPN3. Tim23-GFP was generated by PCR amplification of the human Tim23 with primers 5′-CGAATTCAACCATGGAAGG AGGCGGAGGAGGCGG-3′ and 5′-CGAATTCGAGTGACTGTTGGAGCAAGGA-3′ and cloned in the EcoRI site of pEGFPN3. The fusion between the DNA binding domain of yeast Gal4 transcription activator and mitofilin was generated by PCR amplification with primers 5′-GAAGGAGGGATCCATATGGATT-CCCATTTCCGGGAAAG-3′ (P264) and 5′-ACGCGGATCCTTACTCTTGCTGCA-CTTGAG-3′ and cloned into the BamHI site of pAS2–1 and pACT2 (BD Biosciences Clontech) to obtain pAS2–1mitofilin (68–746) and pACT2mitofilin (68–746).
Antibodies
Antibodies against mitofilin were generated by initial intrasplenic injection of either mouse mitofilin cDNA or peptides corresponding to residues 123–135 (CLPVAQSQKTKGDT) and 162–174 (CPNTNEGKSTSETT) of mitofilin, followed by boosts with intramuscular injections of respective antigens. Antibodies against respiratory chain components, including the 70-kDa subunit of the complex II, 56.6 subunit of the β subunit of ATP synthase, Porin, and F1 ATPase were from Molecular Probes (Eugene, OR).
Isolation of Mitochondria and In Vitro Import
Mitochondria from mouse liver and HeLa cells were isolated, and mitochondrial import reactions were performed as described previously (McBride et al., 1995). Swollen mitochondria were obtained by incubation in 5 mM HEPES, pH 7.5, for 10 min on ice. Protease treatment was done by incubating mitochondria with 0.125 mg/ml trypsin for 20 min on ice and inactivated with soybean trypsin inhibitor (100 μg/ml). Mitochondrial lysates were size fractionated by SDS-PAGE and subject to autoradiography.
Cell Culture, RNA Interference (RNAi), Transfection, and Retroviral Transductions
Transfections of expression constructs were performed with FuGENE 6 reagent (Roche Diagnostics, Indianapolis, IN). Mitotracker Red CMXRos (Molecular Probes) was used to stain mitochondria as per manufacturer's protocol. A Nikon (Eclipse TE2000-U) confocal microscope was used to scan the transfected cells. The images were obtained in the EZ-C1 acquisition software with a 60× objective lens and 0.75 numerical aperture. The images were acquired at room temperature in Slowfade (Antifade kit; Molecular Probes) by using a Nikon D-eclipse C1 camera.
RNAi experiments were performed in HeLa cells essentially as described previously (Elbashir et al., 2001). The complementary RNA oligonucleotides AAUUGCUGGAGCUGGCCUUTT and AAGGCCAGCUCCAGCAAUUTT (Center for Biomedical Inventions, University of Texas Southwestern Medical Center, Dallas, TX) were derived from nucleotides 135–155 of the mitofilin cDNA. A pair of nonspecific scramble RNA oligonucleotides was used as a control (GAUCACGGAUCUCCAUGGCTT and GCCAUGGAGAUCCGUGAUCTT). The short hairpin RNAi construct (pAVU6mitofilin) was generated by PCR with the primers 5′ TGCTCTAGAAAAAAAGCTACCTGAAGTAGAATATCTACGGCACGCAAGCTTCCATGCCGCAGATACTCTACTTCAGGCAGCGGTGTTTCGTCCTTTCCACAA 3′ and 5′ CGCGGATCCAAGGTCGGGCAGGAAGAGGGC 3′ and cloning downstream of the human U6 promoter into the XbaI and BamHI sites of pAVU6 vector. Two rounds of transfections were performed and monitored using Su9-GFP and Su9-RFP for the first and second rounds, respectively. The reporter constructs were used at 1:10 ratio relative to the mitofilin expression and RNAi vectors.
The C2C12 stable cell lines expressing mitofilin-FLAG were generated by retroviral transduction. Briefly, Bosc23 packaging cells were transfected with pMSCVpuro mitofilin-FLAG or pMSCVpuro by using FuGENE 6 reagent, and viral supernatant was collected 72 h later. C2C12 cells were infected with the viral supernatant for 8 h, and selection (2 μg/ml puromycin) applied 24 h after the infection. Bulks of Puror cells were harvested for Western blot analysis and immunoprecipitation.
Western Blots and Immunoprecipitation
For Western blot analysis, cell lysate was prepared with buffer B (50 mM Tris-Cl, pH 7.5, 150 mM NaCl, and 1% Triton-X 100, 0.2% SDS, and protease inhibitors), separated by SDS-PAGE, and transferred to polyvinylidene difluoride membranes. Immunodetection was performed with α-mitofilin (cDNA) (1:1000), Complex II and V (0.1 μg/ml). For immunoprecipitation, C2C12 cells were suspended in lysis buffer (20 mM HEPES, pH 7.5, 150 mM NaCl, 0.5% NP-40, and protease inhibitors). The lysates were precleared with protein A-Sepharose for 30 min at 4°C. Immunoprecipitation was performed by the addition of 25 μl of FLAG-Gel (Sigma-Aldrich, St. Louis, MO).
Blue Native-PAGE and Glycerol Gradient Centrifugation
Isolated mouse liver mitochondria were extracted in 1.0% digitonin or 1% n-dodecyl β-d-maltoside and separated on 5–16% gradient blue native gels as described previously (Schagger and Von Jagow, 1991). Mouse liver mitochondrial extracts (200 μg) were separated on 5-ml glycerol gradients (10–50%) by centrifugation at 250,000 × g for 3.5 h. Fractions (300 μl) were collected, and the proteins were detected by immunoblotting.
Yeast Two-Hybrid Assay
Yeast strain AH109 (James et al., 1996) was transformed with the expression constructs and plated on triple dropout (SD/Trp-Leu-His-) and double dropout (SD/Trp-Leu-) plates (Fields and Song, 1989). Yeast growth was scored 4 d later.
Electron Microscopy
HeLa cells were fixed in 2% glutaraldehyde (0.1 M sodium cacodylate) and postfixed in 1% OsO4 and 2% uranyl acetate. The cells were then dehydrated and rinsed with propylene oxide and embedded in Epon (Embedd 812, DDSA, NMA, and DMP30) and polymerized overnight in a 60°C oven. Sections of 50–70 nm were obtained in a Reichert Ultracut E and mounted on Formvar-carbon–coated copper grids. Transmission electron microscopy (TEM) analysis was conducted on a JEOL 1200 EX. For immunolabeling, mouse (embryonic day [E]12.5) or rat (E15.5) embryos were dissected and fixed immediately in 4% paraformaldehyde, 0.1% glutaraldehyde in 0.1 M sodium phosphate buffer, pH 7.4, rinsed in buffer, and infiltrated with 5% gelatin in buffer at 37°C for 15 min. The gelatin blocks were then stirred overnight in 2.3 M sucrose in buffer at 4°C. Ultrathin cryosections were cut on a Reichert Ultracut E with FC4E cryo attachment. Antigen retrieval (only for mitofilin staining) was performed by incubating the sections in phosphatebuffered saline (PBS), pH 5.5, for 2 h, 0.02 M sodium borohydride in PBS, pH 7.4, for 10 min, and for 5 min in 1% SDS in PBS, pH 7.4. Sections were blocked in 1% fish skin gelatin (Sigma-Aldrich) for 20 min and incubated in α-mitofilin (cDNA) antibody (1:10 diluted in 1% bovine serum albumin) α-Porin and α-F1 ATPase diluted to 50 μg/ml for 1 h followed by incubation with secondary antibody (Amersham Biosciences, Piscataway, NJ) goat α-rabbit antibody IgG (1:20) conjugated to 5-nm gold particles. Sections were then stained with 2% uranyl acetate in 0.15 M oxalic acid for 10 min, followed by 0.4% uranyl acetate in 2% methyl cellulose. The sections were dried and observed in a Philips CM 12 transmission electron microscope. For tomography, 250- to 300-nm-thick sections were cut from Epon blocks, and images were recorded on an FEI Tecnai F20 operating at 200 kV, by using a Gatan model 2048 × 2048 cooled charge-coupled device. Tilt series of 131 images were collected from –70° to + 70° at angular increments defined by Saxton et al. (1984)) by using the FEI auto tomography suite. Images were coaligned by the use of colloidal gold particles deposited on the sections, and the reconstructions were computed by weighted-back projection in SPIDER (Frank et al., 1996). Before volume rendering (in VoxelView), volumes were filtered in SPIDER by anisotropic diffusion (Frangakis and Hegerl, 2001). Relative areas of mitochondrial inner and outer membranes were obtained by tracing and quantitating membrane profiles by using ImageJ. For normal HeLa cells, membrane profiles in conventional electron micrographs were traced. For the densely packed membranes in mitochondria of cells transfected with mitofilin small interfering RNA (siRNA), tracing was done on slices from tomograms.
Assays for Apoptosis and Cell Proliferation
Apoptosis was determined by labeling the cells with Annexin V (Cy3) (Biovision, Mountain View, CA) for 5 min and analyzed by flow cytometry. The Cyquant and Vybrant assays were performed according to manufacturer's instructions (Molecular Probes). Cell cycle analysis was done by resuspending the cells in Krishan's buffer (50 μg/ml propidium iodide, 0.3% NP-40, 0.1% sodium citrate, and 20 μg/ml RNAse A) for 30 min on ice, followed by flow cytometric analysis.
Assays for Mitochondrial Function
Cells were stained with 40 nM 3,3′-dihexyloxacarbocyanine iodide (DiOC6) (Molecular Probes) or 2 μM 2-hydroethidium (Molecular Probes) for 30 min at 37°C and analyzed by Flow cytometry to determine the mitochondrial membrane potential and superoxide production, respectively. Oxygen consumption assays were performed essentially as described previously (Hofhaus et al., 1996) in an Oxygraph system equipped with a Clark electrode (Hansatech, Norfolk, England).
The metabolic flux assay was performed as described previously (Manning et al., 1990).
RESULTS
Mitofilin Is Localized to a Subcompartment within the Intermembrane Space
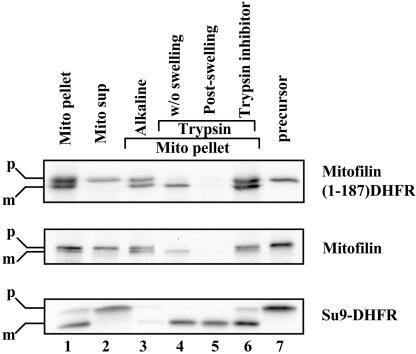
Previous topological studies showed that mitofilin is anchored to the inner membrane and faces the intermembrane space (Gieffers et al., 1997). The first 78 amino acids of mitofilin contain a typical amino-terminal–cleavable mitochondrial presequence that is rich in positive-charged and hydroxylated residues (Hartl et al., 1989), as well as a membrane anchor domain (Supplemental Figure S1). In addition, mitofilin has three centrally located coiled coil (CC) domains (Supplemental Figure S1B). To determine the sequence elements required for protein targeting, we fused the mitofilin amino-terminal portions of various lengths to dihydrofolate reductase (DHFR) to generate the chimeric proteins. We tested the import of the chimeric proteins into isolated mouse liver mitochondria. As a positive control, mitofilin was resistant to exogenously added trypsin (Figure 1, lane 4, middle); swelling of the mitochondria to open the outer membrane resulted in the protease sensitivity (Figure 1, lane 5, middle), consistent with its localization in the intermembrane space. Furthermore, the matrix-based Su9-DHFR remained resistant to trypsin digestion even under the hypoosmotic condition, indicating that the integrity of the inner membrane was not breached by such treatment (Figure 1, lane 5, bottom). Notably, mitofilin (1–187)-DHFR was efficiently imported into mitochondria and resistant to alkaline extraction (Figure 1, lanes 1 and 3, top, respectively), and its mature form recapitulated a similar trypsin digestion profile as the full-length protein (Figure 1, lane 5, top), suggesting that the majority of 1–187-DHFR was in the intermembrane space. In contrast, a smaller fusion protein, mitofilin (1–78)-DHFR containing only the mitochondrial presequence and adjacent membrane anchor domain, was incompletely processed, and a significant portion of the protein was retained in the mitochondrial matrix (our unpublished data). Therefore, the amino-terminal 187 amino acids have sufficient information for mitofilin targeting. Because the CC domains begin at the 200th amino acid (Supplemental Figure S1B), they seem dispensable for targeting to mitochondria.
Figure 1.
Characterization of the putative mitochondrial targeting sequence and membrane-anchoring domain of mitofilin. Mitofilin, mitofilin (1–187)-DHFR, and Su9-DHFR were synthesized in rabbit reticulocyte lysate as the precursor form (lane 7) in the presence of [35S]methionine and imported into isolated mouse liver mitochondria. After import, the mitochondria were untreated (lane 1), treated directly with trypsin (lane 4), or treated with trypsin (lanes 5 and 6) in the presence of hypoosmotic shock. Soybean trypsin inhibitor also was included in the lane 6. The mitochondria were recovered through centrifugation (mito pellet, lane 1), whereas the supernatant (mito sup, lane 2) contained untargeted protein. Alkaline extraction (lane 3) was performed by resuspending the mitochondrial pellets in 100 mM Na2CO3 for 30 min on ice. The mitochondrial membranes were recovered by ultracentrifugation at 100,000 × g. All the samples were size-fractionated by SDS-PAGE and subjected to autoradiography. The precursor and mature forms of the proteins are indicated as p and m, respectively.
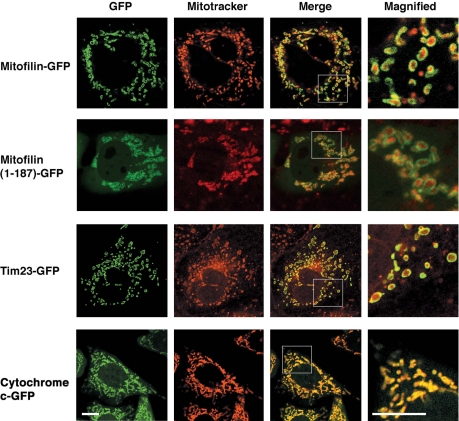
To determine whether the same sequence elements also can function in vivo, we fused full-length mitofilin, as well as its first 187 amino acids to GFP and expressed the chimeric proteins in Cos7 cells. Both chimeric proteins exhibited mitochondrial localization by confocal microscopy, as evidenced by colocalization with Mitotracker (Figure 2). Close inspection of magnified images revealed a specific outer rim staining of mitochondria for mitofilin-GFP and 1–187 (mitofilin)-GFP. Typical outer rim staining also was observed for the fusion construct between GFP and Tim23, a component of mitochondrial protein import machinery that spans the inner and outer membranes (Donzeau et al., 2000) (Figure 2). We also compared the staining patterns between mitofilin and cytochrome c fusion proteins. Cytochrome c-GFP–expressing cells (Goldstein et al., 2000) showed a pan-mitochondrial staining, consistent with the previous observation that the majority of cytochrome c is distributed in intracristal space (Scorrano et al., 2002). The GFP fusion did not alter the intramitochondrial localization of cytochrome c (Supplemental Figure S3). To further improve the resolution of the localization studies, we performed immunogold labeling of mitofilin in ultrathin cryosections of embryonic heart. Consistent with previous published data (Odgren et al., 1996), an outer rim staining pattern was accentuated with scattered gold particles on the mitochondrial cristae (Supplemental Figure S4A). In comparison, the staining pattern for porin (Supplemental Figure S4B) and F1 ATPase (Supplemental Figure S4C) was typically outer rim and cristae, respectively. We performed a quantitation of the gold particles staining the outer rim versus the interior cristae for all the three proteins (Supplemental Figure S4D). On comparison, it is clear that the distribution of mitofilin is predominantly at the outer rim of mitochondria. Together, these data suggest that mitofilin is preferentially localized to the bases of the cristae membrane or the inner boundary membrane.
Figure 2.
Intramitochondrial localization of mitofilin. (A) Cos7 cells expressing fusion proteins mitofilin-GFP, mitofilin (1–187)-GFP, Tim23-GFP and HeLa cells stably expressing cytochrome c-GFP were stained with Mitotracker (Molecular Probes). The localizations of the GFP fusion proteins (green fluorescence) and Mitotracker (red fluorescence) were assessed by confocal microscopy. Bar, 10 μm.
Loss of mitofilin Results in Reduced Growth Rate and Apoptosis
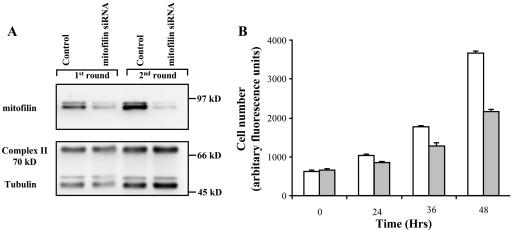
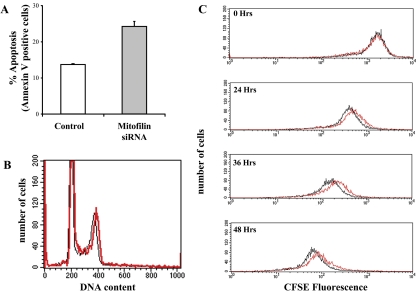
In an effort to decipher the function of mitofilin, we performed loss-of-function experiments. Specific human mitofilin siRNAs were designed that correspond to nucleotides 135–155 and transfected into HeLa cells. A scramble siRNA was used as a control. Cells were collected 48 h posttransfection, and Western blotting was performed to detect the loss of mitofilin. Partial reduction of mitofilin was observed after the first round of transfection, and a second round of transfection resulted in a further decrease (Figure 3A). In contrast, the 70-kDa subunit of respiratory chain complex II or tubulin was not affected during the same time course of the siRNA treatments. Interestingly, the sample transfected with the mitofilin siRNA had a reduced cell number compared with the control sample. Equal numbers of cells were plated 24 h after the second round of transfection, and kinetic analysis was performed using the CyQuant kit (Molecular Probes), which uses a fluorescent dye that binds proportionally to the quantity of nucleic acid present in cells (Figure 3B). A 40% reduction was observed after 48 h. Similar data were obtained by manual counting of the samples (our unpublished data). To determine the cause of the reduced cell number, we examined whether mitofilin knockdown affects apoptosis and/or proliferation of the treated cells. Annexin V was used to detect dying cells because it binds to phosphatidylserine, which is externalized from the inner to the outer leaflet of plasma membrane upon induction of apoptosis (Fadok et al., 1992) (Figure 4A). Mitofilin siRNA-treated cells showed increased apoptosis compared with the control cells. However, the slight increase (∼10%) in apoptosis does not account for the 40% reduction in cell number. We then examined cellular growth kinetics after mitofilin siRNA treatment. Flow cytometric analysis of propidium iodide-stained cells was used to measure DNA ploidy. The similar cell cycle profiles between the mitofilin-and control siRNA-treated samples suggest that the cells are not blocked in any particular phase of the cell cycle (Figure 4B). Hence, we used the Vybrant cell tracer assay (Molecular Probes) to determine whether the cell cycle is prolonged due to loss of mitofilin. Cells were labeled with a cell-permeable fluorescent dye, carboxyfluorescein diacetate, succinimidyl ester (CFSE), which irreversibly couples to cellular proteins and is distributed equally between the daughter cells. With each cell division, a reduction in cellular fluorescence occurs with a corresponding increase in cell number. The experiment showed that mitofilin siRNA-treated cells exhibited a lagged production of daughter cells of reduced CFSE fluorescence than control siRNA-treated cells (Figure 4C), suggesting a decreased mitotic rate. In contrast to the results of the loss-of-function studies, overexpression of mitofilin through transient transfection did not affect apoptosis or cellular proliferation of the HeLa cells (our unpublished data).
Figure 3.
SiRNA treatment established a loss-of-function model for mitofilin. (A) HeLa cells were collected 48 h after one or two rounds of siRNA transfections, and the cell lysate was separated on SDS-PAGE and analyzed by Western blotting with an α-mitofilin (cDNA) antibody. The blot was stripped and probed with α-Complex II (70-kDa subunit) and α-tubulin antibodies. (B) Mitofilin deficiency is associated with reduced cell number. Equal numbers of the HeLa cells were plated 24 h after the second round of siRNA transfection. The mitofilin-depleted (filled bars) and control (open bars) was then quantitated by the Cyquant assay (Molecular Probes) at the indicated time points thereafter.
Figure 4.
Loss of mitofilin promotes apoptosis and reduces cellular proliferation. (A) siRNA-treated HeLa cells were stained with Cy3-conjugated Annexin V and analyzed by flow cytometry. Duplicates were assayed after 48 h of the second round of siRNA treatment. (B) Effect of mitofilin deficiency on cell cycle profile. The mitofilin siRNA- (red) and control siRNA (black)-treated HeLa cells were resuspended in Krishan's buffer (Krishan, 1975) and analyzed by flow cytometry after 48 h of the second round of siRNA treatment. (C) Effect of mitofilin deficiency on proliferation rate. Cell cycle progression was monitored after labeling HeLa cells with the cell-permeable dye (CFSE) (Vybrant assay; Molecular Probes) at 5 h after the second-round siRNA transfection. The cells were then analyzed at 0, 24, 36, and 48 h thereafter by flow cytometry.
Loss of mitofilin Results in Abnormal Mitochondrial Function and Structure
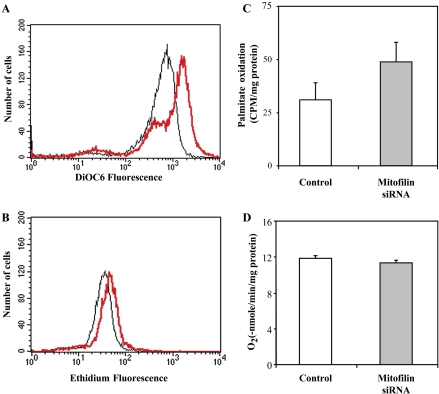
The increased apoptosis and reduced proliferation observed in mitofilin siRNA-treated cells suggest a mitochondrial function abnormality. Because changes in mitochondrial membrane potential and production of reactive oxygen species (ROS) are frequently associated with apoptosis (Zamzami et al., 1995), we used DiOC6, a potential-sensitive mitochondrial dye, to measure mitochondrial membrane potential (ΔΨm). Flow cytometric analysis of cells treated with mitofilin siRNA did not show any changes in ΔΨm after the first round of treatment; however, further treatment resulted in an increase over the control siRNA-treated sample (Figure 5A). ROS production was measured with dihydroethidium, which can be converted by superoxide anion to ethidium that exhibits a bright red fluorescence. After the second round of treatment, we also observed increased ROS production due to mitofilin deficiency (Figure 5B). We also performed gain-of-function analysis by transiently overexpressing mitofilin; however, no significant changes were observed for ΔΨm and ROS production (our unpublished data).
Figure 5.
Loss of mitofilin results in mitochondrial functional abnormality. Mitofilin (red) versus control (black) siRNA-treated HeLa cells were stained with 40 nM DiOC6 (A) or 2 μM 2-hydroethidium (B) and analyzed by flow cytometry to assess mitochondrial membrane potential and ROS production, respectively. Metabolic flux was measured by the oxidation of 3H-labeled palmitate to H2O (C). For oxygen consumption, HeLa cells were suspended in medium A (250 mM sucrose, HEPES-KOH, pH 7.5, 1 mM ADP, and 2 mM K2HPO4) and introduced into a chamber equipped with a Clark electrode. Respiration was induced by the addition of 5 mM malate/glutamate. Rates of oxygen consumption were calculated from the slopes of state 3 respiration (D). All the assays were performed with the HeLa cells after 48 h of the second-round siRNA treatment. Filled and open bars represent mitofilin versus control siRNA-treated cells, respectively.
The increased membrane potential and ROS production suggest a possible defect in energy production. To examine this hypothesis, we performed a metabolic flux assay (Manning et al., 1990), which used 3H-labeled palmitic acid to follow fatty acid metabolism through β-oxidation, tricarboxylic acid cycle, and oxidative phosphorylation. Surprisingly, we observed a 58% increase in palmitic acid-mediated metabolic activity after the second round of mitofilin siRNA treatment (Figure 5C). Similar results were obtained using 3H-labeled myristic acid as a metabolic substrate (our unpublished data). However, when we performed polarographic measurement of digitonin-permeabilized HeLa cells (Hofhaus et al., 1996), the glutamate/malate-dependent oxygen consumption rate of mitofilin siRNA-treated cells was similar to that of control cells (Figure 5D), suggesting that the increased metabolic output failed to generate a corresponding increase in ATP production.
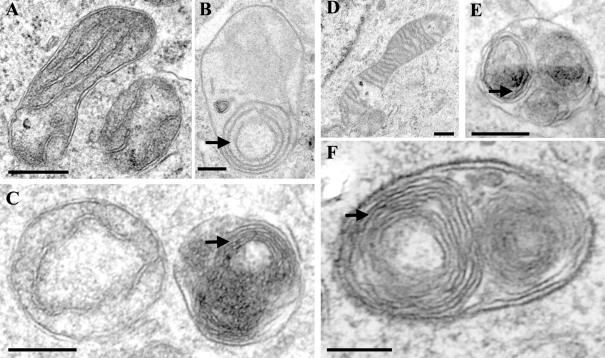
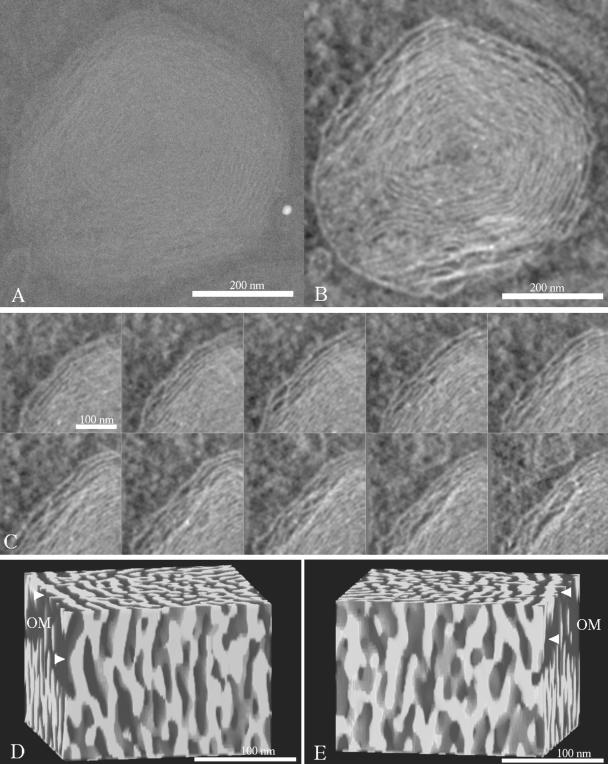
Although mitochondrial function was altered by mitofilin depletion in multiple parameters, the primary cause for these abnormalities remains elusive. Because appropriate mitochondrial structure enables it to perform a diverse set of metabolic function, we wondered whether a structural defect may underlie and account for these functional abnormalities. To determine whether mitofilin is required for mitochondrial structural organization, cells treated with mitofilin or control siRNA were subjected to TEM. Although mitochondrial functional abnormalities were only evident after two rounds of mitofilin siRNA transfection, we observed major ultrastructural changes after a single treatment. Quantitation of the defective mitochondria after 48 h of mitofilin siRNA after first and second round indicate that ∼11% of cells showed defective and 23% cells showed defective as well as normal mitochondria after the first round. After the second round, 30% of cells showed only defective and 28% showed both defective and normal mitochondria (Supplemental Figure S5A). The defective mitochondria after the first round were typically characterized by inner membranes showing one to several layers of concentric spherical rings, resembling onion-like structure (Figure 6, B and C). Further treatment (second round) resulted in an increase in the number of layers of tightly packed concentric membranous sheets. These abnormal membranes were partially collapsed and occupied the majority of the internal mitochondrial compartment (Figure 6, E and F). Approximately 16% of cells after two rounds of mitofilin siRNA showed the presence of one or two mitochondria undergoing autophagy. The mitochondria were either enveloped with the endoplasmic reticulum (ER) membrane, showing a dense matrix (Supplemental Figure S5B), or were in more terminal stage of autophagy enveloped by multiple layers of ER membrane with empty matrix compartment (Supplemental Figure S5C). No autophagic mitochondria were detected in cells after the first round of mitofilin siRNA. Estimates of relative inner-to-outer membrane (IM:OM) surface area in the densely packed, abnormal mitochondria were generally >10:1, compared with ∼2.5:1 in mitochondria from control HeLa cells, suggesting increased inner membrane biogenesis. Because of the tight packing of the membranes in these mitochondria, routine TEM could not provide information about membrane shape and organization. Therefore, electron tomography was used to generate highresolution three-dimensional images of abnormal mitochondria in the mitofilin siRNA-transfected cells. Tomographic analysis of these mitochondria indicated the absence of identifiable tubular “cristae junctions,” which normally connect the peripheral inner membrane to the internal cristae compartments (Figure 7C). The tomograms also indicated that the densely packed inner membranes were not simply concentric sheets. Rather, these membranes formed a maze of interconnected compartments, with numerous contact sites and openings between radially adjacent membranes (Figure 7, D and E).
Figure 6.
Loss of mitofilin results in drastically altered mitochondrial ultrastructure. Electron microscopic images of the control (A and D) versus mitofilin (B and C, E and F) siRNA-treated HeLa cells showing mitochondrial ultrastructures after the first round (A–C) and the second round (D–F) of transfection. Arrows indicate the multiple concentric sheets of the inner membrane. Bar, 250 nm.
Figure 7.
Electron tomography of mitofilin-depleted mitochondria. (A) Projection image of a 250-nm-thick section of a representative mitochondrion in a siRNA-treated HeLa cell. (B) Central 3-nm slice from the reconstructed volume. (C) Series of 3-nm slices spaced 15 nm apart, of the upper left region in B. (D and E) Volume rendering of the membranes in a 200 × 200 × 250-nm3 block within region (C). Views D and E are rotated by 180°. The mitochondrial outer membrane (OM) is marked by arrows.
Loss of Mitofilin Does Not Affect Mitochondrial Fission and Fusion
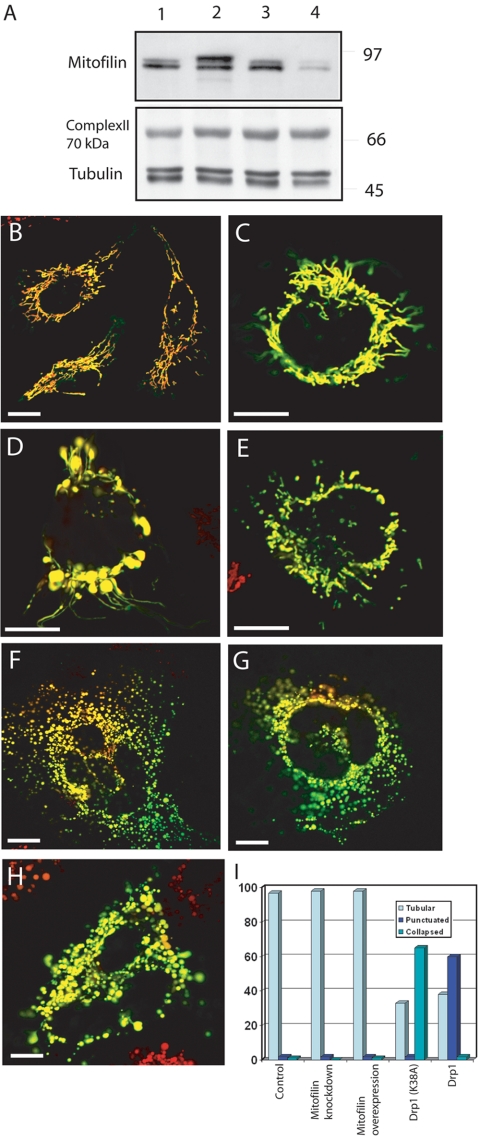
Because the mitochondrial fission and fusion machinery plays an important role in regulating organelle morphology, we examined whether mitofilin affects mitochondrial fission and/or fusion, thereby controlling the cristae architecture. HeLa cells were transiently transfected with either a mitofilin expression vector or a mitofilin RNAi short hairpin vector to generate gain-of-function or loss-of-function systems, respectively. Western blotting of cell lysates obtained 48 h after two rounds of transfections with mitofilin expression vector or RNAi short hairpin vector shows overexpressed (Figure 8A, lane 2) and depleted mitofilin (Figure 8A, lane 4) respectively, whereas tubulin and mitochondrial complex II (70 KDa) are not affected due to these transfections (Figure 8A). Mitochondrial reporter gene constructs (Su9-GFP and/or Su9RFP) were cotransfected to mark the recipient cells. Overexpression or depletion of mitofilin did not alter the normal tubular network (Figure 8, B and C). Less than 2% (n = 201) of the cells exhibited punctiform or collapsed phenotypes. In contrast, 65% of cells (n = 200) transfected with Drp1 dominant-negative mutant (K38A) showed collapsed mitochondrial distribution (Figure 8D), and 60% of cells (n = 210) with overexpressed Drp1 demonstrated punctiform conformations (Figure 8E), which are consistent with previously published data (Smirnova et al., 2001). Therefore, loss or overexpression of mitofilin did not affect gross mitochondrial fission. To determine the impact of mitofilin on mitochondrial fusion, we used a polyethylene glycol (PEG)-based cell fusion assay (Chen et al., 2003). HeLa cells with overexpressed or depleted mitofilin were independently marked with either Su9-GFP or Su9-RFP, fused by the application of PEG 1500, and grown for another 8 h in cycloheximide-containing media to prevent further protein synthesis. We examined 200 fused cells under each condition, and mitochondrial fusion proceeded normally in control (Figure 8F) as well as in mitofilin-depleted (Figure 8G) or overexpressed cells (Figure 8H), as indicated by colocalization of the green and red fluorescent signals. Our data strongly suggest that gross mitochondrial fission and fusion are not directly affected by mitofilin.
Figure 8.
Effect of mitofilin on mitochondrial fission and fusion. (A) Western blot analysis was performed for the HeLa cells 48 h after second round of transfection with pCDNA3 (lane1), pCDNA3mitofilin (lane 2), pAVU6lamin (lane 3), and pAVU6mitofilin to show the overexpression and knockdown of mitofilin. Gross mitochondrial morphology in HeLa cells with mitofilin depletion (B), mitofilin overexpression (C), overexpression of Drp1 dominant-negative mutant (D), and Drp1 overexpression (E). Mitochondrial fusion in the PEG-fused HeLa cells after control transfection (F), mitofilin depletion (G), and mitofilin overexpression (H). Quantitative data obtained for the various mitochondrial phenotypes, after different treatments (I). The cells were analyzed for all treatments after 48 h of second-round transfections. Bar, 10 μm.
Mitofilin Forms Homo-oligomer and Is Present in a Large Multimeric Protein Complex
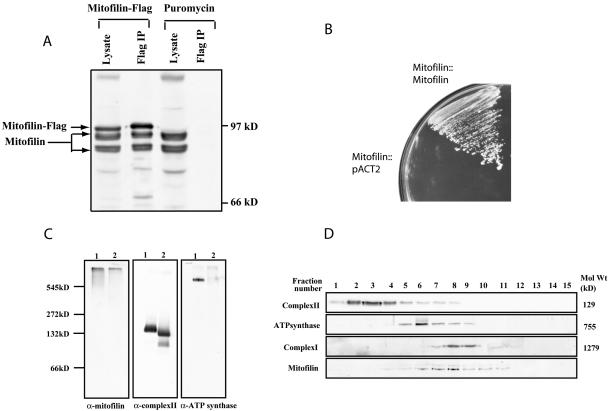
Sequence analysis of mitofilin revealed three centrally located coiled coil domains (Supplemental Figure S1B), which are frequently involved in protein–protein interactions (Cohen and Parry, 1990). Mitofilin may control mitochondrial cristae architecture through homo-and/or hetero-oligomerization. To test this hypothesis, we generated mouse C2C12 cells stably expressing mitofilin-FLAG through retroviral transduction and performed immunoprecipitation with anti-FLAG antibody. The simultaneous presence of FLAG-tagged and endogenous mitofilin in the immunoprecipitate (Figure 9A) suggested that mitofilin could either form homo-oligomers or interact with each other via bridging molecules. To further test the selfassociation of mitofilin, we used the yeast two-hybrid system. The first 67 amino acids of mitofilin that contain the mitochondrial targeting signal and membrane anchoring sequence were removed to facilitate nuclear localization and the remaining protein was fused to either the Gal4 DNA binding or the activation domains (Fields and Song, 1989). Growth of the yeast harboring both plasmids on synthetic defined (SD/Trp-Leu-His-) media plates indicated a positive interaction (Figure 9B), further supporting homotypic mitofilin interaction.
Figure 9.
Mitofilin forms homotypic interactions and assembles into a high-molecular-weight protein complex. (A) Immunoprecipitation of FLAG-tagged mitofilin. Cellular lysate of C2C12 cells expressing mitofilin-FLAG or Puror were immunoprecipitated by an anti-FLAG antibody, and the immunoprecipitates as well as the lysates were subsequently analyzed by Western blotting with an α-mitofilin (cDNA) antibody. (B) The first 67 amino acids of mitofilin were deleted and fused to either the Gal4 DNA binding (pAS2–1) or the activation domains (pACT2) and were cotransformed into the yeast strain AH109 and their growth on triple dropout plates (SD/Leu-Trp-His-) was examined. (C) Characterization of the mitofilin complex by blue native-PAGE. Mouse liver mitochondrial lysates made in 1% digitonin (lane 1) or 1% dodecyl maltoside (lane 2) were separated using 5–16% blue native-PAGE, followed by Western blotting with α-mitofilin (cDNA), anti-complex II, and anti-ATP synthase antibodies. (D) Characterization of the mitofilin complex by glycerol density gradient centrifugation. The 1% digitonin permeabilized mouse liver mitochondrial lysate (1 mg) was separated on a glycerol gradient (10–50%), and fractions collected were analyzed by Western blotting to identify complex I, II, ATP synthase, and the mitofilin complex. Fraction 1 corresponds to the top of the gradient.
To estimate the size of the mitofilin protein complex, we extracted isolated mouse liver mitochondria with 1.0% digitonin and separated the protein complexes by 5–16% gradient blue native-PAGE (Schagger and von Jagow, 1991). Although respiratory chain complexes II (129 kDa) and ATP synthase (755 kDa) migrated according to their molecular weights, the mitofilin complex was barely resolved into the separation gel (Figure 9C). To get a more precise estimation of the molecular weight, the protein extracts were subjected to a 10–50% glycerol density gradient centrifugation. Fractions were collected, and Western blotting was performed to estimate the molecular weight of the mitofilin complex. Respiratory chain complexes I, II, and ATP synthase were used as internal controls for molecular weight standards (Buchanan and Walker, 1996) (Figure 9D). The mitofilin complex and the respiratory chain complex I showed the closest cosedimentation, and both were enriched around fraction 8. However, complex I also was enriched in fraction 9, whereas mitofilin also identified in fraction 7, suggesting a molecular weight of the mitofilin complex slightly less than that of the complex I (1279 kDa).
DISCUSSION
Variations of the mitochondrial cristae architecture can be ascribed to the different metabolic states of the organelle. Mitochondria can adapt remarkably well to the changing energetic needs by altering their metabolism, which is accompanied by the structural changes of the inner membrane. However, the molecular mechanisms governing the biogenesis and configuration of the inner membrane remain mysterious. Our studies have provided the first clues toward understanding the role of mitofilin in the regulation of mitochondrial cristae architecture. Down-regulation of mitofilin resulted in a drastic change in the organization of the inner membrane. Rather than organizing into tubular cristae, the inner membrane formed concentric layers that interconnected at numerous sites. No discernible cristae junctions were identified. Therefore, mitofilin seems to be essential for the formation of normal tubular cristae as well as cristae junctions. Cristae formation is critical for achieving high surface-to-volume ratio of the inner membrane. Although the concentric layering increased the inner membrane surface area, the tightly packed membranous sheets and internal compartmentation might hinder exchange for ions and metabolites, possibly leading to increased membrane potential and ROS production as well as defective oxidative phosphorylation. The increased IM:OM ratio suggests that the inner membrane did not simply change its configuration, but exhibited further membrane biogenesis, which was accompanied by up-regulated metabolic flux. However, the increased metabolic output failed to generate a corresponding ATP production due to the defective oxidative phosphorylation. Our data clearly established a temporal sequence of mitochondrial structural and functional abnormalities induced by mitofilin depletion. The concentric membranous sheets began to occur after 48 h of the first round siRNA treatment; mitochondrial dysfunction ensued after another round of siRNA application. Therefore, the structural alterations seemed to precede the functional abnormality and are a primary defect of mitofilin depletion. These abnormal mitochondria are occasionally consumed by autophagy in the viable cells and ultimately result in reduced proliferation and increased apoptosis in the decompensated cells.
Although the molecular basis for cristae morphogenesis is still unknown, there is increasing evidence that the mitochondrial fission and fusion machinery plays an important role in this process. OPA1/Mgm1, a large dynamin-like GTPase, is located in the intermembrane space (Wong et al., 2000), the same submitochondrial compartment where mitofilin resides. In addition, down-regulation of OPA1 also resulted in altered cristae structure (Olichon et al., 2002). These published data suggest a possible connection between the two molecules. However, several lines of evidence are against this association. First, the ultrastructural changes caused by OPA1 versus mitofilin deficiency are distinct. Vesicle-like cristae with increased spaces between the membranes were observed in OPA1-depleted mitochondria (Olichon et al., 2002), compared with the onion-like structures in mitofilin-depleted mitochondria. Second, mitochondrial membrane potential was dissipated by the loss of OPA1. Third, the mitochondrial network was changed from a filamentous to a punctuated distribution due to the OPA1 depletion. In contrast, down- or up-regulation of mitofilin had no effect on the distribution of gross mitochondrial network. Therefore, it seems unlikely that mitofilin is part of the OPA1 complex
Recently, the inner membrane protein Mdm33 was identified as a component of mitochondrial morphogenetic machinery and seems to mediate constriction of the inner membrane from the matrix side (Messerschmitt et al., 2003). Mdm33 has extensive coiled coil domains and exhibits homotypic protein interaction on opposing membranes. The structural and biochemical similarities between mitofilin and Mdm33 raise the possibility that mitofilin may perform similar function in the intermembrane space, potentially promoting the close apposition of the inner membranes forming crista junctions and/or tubular cristae. Given the localization of mitofilin and its presence in a large multimeric protein complex (∼1200 kDa), mitofilin also may associate with outer membrane proteins through heterotypic interaction. In the Mmm1 mutant, ultrastructural analysis revealed stacks of intramitochondrial membrane sheets (Hobbs et al., 2001), a phenotype similar to the mitofilin-deficient cells.
Our studies suggest that mitofilin is an indispensable part of intramitochondrial morphogenetic machinery. Comparative proteomic analysis of the cerebral cortex of a seizure-sensitive strain of gerbil and its seizure-resistant (SR) counterpart revealed that gerbil mitofilin showed consistent differences in their isoelectric point between the two strains (Omori et al., 2002). Sequence analysis of mitofilin cDNAs showed several mutations in the SR strains, including one that resides within a conserved region immediately carboxyl terminal of the membrane-anchoring domain. A recent study in cortical brain samples of fetal Down syndrome showed a double-fold reduction of mitofilin, highlighting its importance for normal mitochondrial function (Myung et al., 2003). In addition, concentric cristae have been reported to occur in myopathy, cardiomyopathy, rhabdomyosarcoma, and Warthin's tumor (Ghadially, 1997). It will be interesting to determine whether mitofilin plays a role in the pathophysiology of these human diseases.
Supplementary Material
Acknowledgments
We thank Dr. Douglas R. Green for the generous gift of the cytochrome c-GFP–expressing HeLa cells, Dr. Wayne Lai for generating anti-mitofilin antibodies, Dr. Keith Wharton for critical reading of the manuscript, Dr. Timo Meerloo for help with cryoultrathin sectioning and immunolabeling, Dr. Susan Palmeiri for assistance with microscopy, and Benita Stewart for assistance with graphic illustrations. J. Z. is supported by the Howard Temin Award from the National Cancer Institute (KO1-CA82231) and by the American Heart Association, National Grant-in-Aid Program (0350426N). Electron tomography at the Resource for the Visualization of Biological Complexity is supported by the National Center for Research Resource, NIH grant RR01219.
This article was published online ahead of print in MBC in Press (http://www.molbiolcell.org/cgi/doi/10.1091/mbc.E04-08-0697) on January 12, 2005.
Abbreviations used: CC, coiled coil; CFSE, carboxyfluorescein diacetate, succinimidyl ester; DHFR, dihydrofolate reductase; DiOC6, 3,3′-dihexyloxacarbocyanine iodide; ΔΨm, mitochondrial membrane potential; ROS, reactive oxygen species; siRNA, small inhibitory RNA; Su9, subunit 9 of ATP synthase.
The online version of this article contains supplemental material at MBC Online (http://www.molbiolcell.org).
References
- Alexander, C., et al. (2000). OPA1, encoding a dynamin-related GTPase, is mutated in autosomal dominant optic atrophy linked to chromosome 3q28. Nat. Genet. 26, 211-215. [DOI] [PubMed] [Google Scholar]
- Boyle, G. M., Roucou, X., Nagley, P., Devenish, R. J., and Prescott, M. (1999). Identification of subunit g of yeast mitochondrial F1F0-ATP synthase, a protein required for maximal activity of cytochrome c oxidase. Eur. J. Biochem. 262, 315-323. [DOI] [PubMed] [Google Scholar]
- Buchanan, S. K., and Walker, J. E. (1996). Large-scale chromatographic purification of F1F0-ATPase and complex I from bovine heart mitochondria. Biochem. J. 318, 343-349. [DOI] [PMC free article] [PubMed] [Google Scholar]
- Chen, H., Detmer, S. A., Ewald, A. J., Griffin, E. E., Fraser, S. E., and Chan, D. C. (2003). Mitofusins Mfn1 and Mfn2 coordinately regulate mitochondrial fusion and are essential for embryonic development. J. Cell Biol. 160, 189-200. [DOI] [PMC free article] [PubMed] [Google Scholar]
- Cohen, C., and Parry, D. A. (1990). Alpha-helical coiled coils and bundles: how to design an alpha-helical protein. Proteins 7, 1-15. [DOI] [PubMed] [Google Scholar]
- Collinson, I. R., Runswick, M. J., Buchanan, S. K., Fearnley, I. M., Skehel, J. M., van Raaij, M. J., Griffiths, D. E., and Walker, J. E. (1994). Fo membrane domain of ATP synthase from bovine heart mitochondria: purification, subunit composition, and reconstitution with F1-ATPase. Biochemistry 33, 7971-7978. [DOI] [PubMed] [Google Scholar]
- Delettre, C., et al. (2000). Nuclear gene OPA1, encoding a mitochondrial dynamin-related protein, is mutated in dominant optic atrophy. Nat. Genet. 26, 207-210. [DOI] [PubMed] [Google Scholar]
- Donzeau, M., Kaldi, K., Adam, A., Paschen, S., Wanner, G., Guiard, B., Bauer, M. F., Neupert, W., and Brunner, M. (2000). Tim23 links the inner and outer mitochondrial membranes. Cell 101, 401-412. [DOI] [PubMed] [Google Scholar]
- Elbashir, S. M., Harborth, J., Lendeckel, W., Yalcin, A., Weber, K., and Tuschl, T. (2001). Duplexes of 21-nucleotide RNAs mediate RNA interference in cultured mammalian cells. Nature 411, 494-498. [DOI] [PubMed] [Google Scholar]
- Fadok, V. A., Voelker, D. R., Campbell, P. A., Cohen, J. J., Bratton, D. L., and Henson, P. M. (1992). Exposure of phosphatidylserine on the surface of apoptotic lymphocytes triggers specific recognition and removal by macrophages. J. Immunol. 148, 2207-2216. [PubMed] [Google Scholar]
- Fields, S., and Song, O. (1989). A novel genetic system to detect protein-protein interactions. Nature 340, 245-246. [DOI] [PubMed] [Google Scholar]
- Frangakis, A. S., and Hegerl, R. (2001). Noise reduction in electron tomographic reconstructions using nonlinear anisotropic diffusion. J. Struct. Biol. 135, 239-250. [DOI] [PubMed] [Google Scholar]
- Frank, J., Radermacher, M., Penczek, P., Zhu, J., Li, Y., Ladjadj, M., and Leith, A. (1996). SPIDER and WEB: processing and visualization of images in 3D electron microscopy and related fields. J. Struct. Biol. 116, 190-199. [DOI] [PubMed] [Google Scholar]
- Ghadially, F. N. (1997). Ultrastructural Pathology of the Cell and Matrix, Newton, MA: Butterworth-Heinemann.
- Gieffers, C., Korioth, F., Heimann, P., Ungermann, C., and Frey, J. (1997). Mitofilin is a transmembrane protein of the inner mitochondrial membrane expressed as two isoforms. Exp. Cell Res. 232, 395-399. [DOI] [PubMed] [Google Scholar]
- Goldstein, J. C., Waterhouse, N. J., Juin, P., Evan, G. I., and Green, D. R. (2000). The coordinate release of cytochrome c during apoptosis is rapid, complete and kinetically invariant. Nat. Cell Biol. 2, 156-162. [DOI] [PubMed] [Google Scholar]
- Griparic, L., and van der Bliek, A. M. (2001). The many shapes of mitochondrial membranes. Traffic 2, 235-244. [DOI] [PubMed] [Google Scholar]
- Hackenbrock, C. R. (1966). Ultrastructural bases for metabolically linked mechanical activity in mitochondria. I. Reversible ultrastructural changes with change in metabolic steady state in isolated liver mitochondria. J. Cell Biol. 30, 269-297. [DOI] [PMC free article] [PubMed] [Google Scholar]
- Hales, K. G., and Fuller, M. T. (1997). Developmentally regulated mitochondrial fusion mediated by a conserved, novel, predicted GTPase. Cell 90, 121-129. [DOI] [PubMed] [Google Scholar]
- Hartl, F. U., Pfanner, N., Nicholson, D. W., and Neupert, W. (1989). Mitochondrial protein import. Biochim. Biophys. Acta 988, 1-45. [DOI] [PubMed] [Google Scholar]
- Hermann, G. J., Thatcher, J. W., Mills, J. P., Hales, K. G., Fuller, M. T., Nunnari, J., and Shaw, J. M. (1998). Mitochondrial fusion in yeast requires the transmembrane GTPase Fzo1p. J. Cell Biol. 143, 359-373. [DOI] [PMC free article] [PubMed] [Google Scholar]
- Hobbs, A. E., Srinivasan, M., McCaffery, J. M., and Jensen, R. E. (2001). Mmm1p, a mitochondrial outer membrane protein, is connected to mitochondrial DNA (mtDNA) nucleoids and required for mtDNA stability. J. Cell Biol. 152, 401-410. [DOI] [PMC free article] [PubMed] [Google Scholar]
- Hofhaus, G., Shakeley, R. M., and Attardi, G. (1996). Use of polarography to detect respiration defects in cell cultures. Methods Enzymol. 264, 476-483. [DOI] [PubMed] [Google Scholar]
- Icho, T., Ikeda, T., Matsumoto, Y., Hanaoka, F., Kaji, K., and Tsuchida, N. (1994). A novel human gene that is preferentially transcribed in heart muscle. Gene 144, 301-306. [DOI] [PubMed] [Google Scholar]
- James, P., Halladay, J., and Craig, E. A. (1996). Genomic libraries and a host strain designed for highly efficient two-hybrid selection in yeast. Genetics 144, 1425-1436. [DOI] [PMC free article] [PubMed] [Google Scholar]
- Jensen, R. E., Hobbs, A. E., Cerveny, K. L., and Sesaki, H. (2000). Yeast mitochondrial dynamics: fusion, division, segregation, and shape. Microsc. Res. Tech. 51, 573-583. [DOI] [PubMed] [Google Scholar]
- Krishan, A. (1975). Rapid flow cytofluorometric analysis of mammalian cell cycle by propidium iodide staining. J. Cell Biol. 66, 188-193. [DOI] [PMC free article] [PubMed] [Google Scholar]
- Labrousse, A. M., Zappaterra, M. D., Rube, D. A., and van der Bliek, A. M. (1999). C. elegans dynamin-related protein DRP-1 controls severing of the mitochondrial outer membrane. Mol. Cell. 4, 815-826. [DOI] [PubMed] [Google Scholar]
- Manning, N. J., Olpin, S. E., Pollitt, R. J., and Webley, J. (1990). A comparison of [9,10–3H]palmitic and [9,10–3H]myristic acids for the detection of defects of fatty acid oxidation in intact cultured fibroblasts. J. Inherit. Metab. Dis. 13, 58-68. [DOI] [PubMed] [Google Scholar]
- McBride, H. M., Silvius, J. R., and Shore, G. C. (1995). Insertion of an uncharged polypeptide into the mitochondrial inner membrane does not require a trans-bilayer electrochemical potential: effects of positive charges. Biochim. Biophys. Acta 1237, 162-168. [DOI] [PubMed] [Google Scholar]
- Messerschmitt, M., Jakobs, S., Vogel, F., Fritz, S., Dimmer, K. S., Neupert, W., and Westermann, B. (2003). The inner membrane protein Mdm33 controls mitochondrial morphology in yeast. J. Cell Biol. 160, 553-564. [DOI] [PMC free article] [PubMed] [Google Scholar]
- Myung, J. K., Gulesserian, T., Fountoulakis, M., and Lubec, G. (2003). Deranged hypothetical proteins Rik protein, Nit protein 2 and mitochondrial inner membrane protein, Mitofilin, in fetal Down syndrome brain. Cell. Mol. Biol. (Noisy-le-Grand) 49, 739-746. [PubMed] [Google Scholar]
- Odgren, P. R., Toukatly, G., Bangs, P. L., Gilmore, R., and Fey, E. G. (1996). Molecular characterization of mitofilin (HMP), a mitochondria-associated protein with predicted coiled coil and intermembrane space targeting domains. J. Cell Sci. 109, 2253-2264. [DOI] [PubMed] [Google Scholar]
- Olichon, A., Baricault, L., Gas, N., Guillou, E., Valette, A., Belenguer, P., and Lenaers, G. (2002). Loss of OPA1 perturbates the mitochondrial inner membrane structure and integrity, leading to cytochrome c release and apoptosis. J. Biol. Chem. 278, 7743-7746. [DOI] [PubMed] [Google Scholar]
- Omori, A., Ichinose, S., Kitajima, S., Shimotohno, K. W., Murashima, Y. L., Shimotohno, K., and Seto-Ohshima, A. (2002). Gerbils of a seizure-sensitive strain have a mitochondrial inner membrane protein with different isoelectric points from those of a seizure-resistant strain. Electrophoresis 23, 4167-4174. [DOI] [PubMed] [Google Scholar]
- Otsuga, D., Keegan, B. R., Brisch, E., Thatcher, J. W., Hermann, G. J., Bleazard, W., and Shaw, J. M. (1998). The dynamin-related GTPase, Dnm1p, controls mitochondrial morphology in yeast. J. Cell Biol. 143, 333-349. [DOI] [PMC free article] [PubMed] [Google Scholar]
- Paumard, P., Vaillier, J., Coulary, B., Schaeffer, J., Soubannier, V., Mueller, D. M., Brethes, D., di Rago, J. P., and Velours, J. (2002). The ATP synthase is involved in generating mitochondrial cristae morphology. EMBO J. 21, 221-230. [DOI] [PMC free article] [PubMed] [Google Scholar]
- Pfanner, N., Muller, H. K., Harmey, M. A., and Neupert, W. (1987). Mitochondrial protein import: involvement of the mature part of a cleavable precursor protein in the binding to receptor sites. EMBO J. 6, 3449-3454. [DOI] [PMC free article] [PubMed] [Google Scholar]
- Saxton, W. O., Baumeister, W., and Hahn, M. (1984). Three-dimensional reconstruction of imperfect two-dimensional crystals. Ultramicroscopy 13, 57-70. [DOI] [PubMed] [Google Scholar]
- Schagger, H., and von Jagow, G. (1991). Blue native electrophoresis for isolation of membrane protein complexes in enzymatically active form. Anal. Biochem. 199, 223-231. [DOI] [PubMed] [Google Scholar]
- Scorrano, L., Ashiya, M., Buttle, K., Weiler, S., Oakes, S. A., Mannella, C. A., and Korsmeyer, S. J. (2002). A distinct pathway remodels mitochondrial cristae and mobilizes cytochrome c during apoptosis. Dev. Cell 2, 55-67. [DOI] [PubMed] [Google Scholar]
- Sesaki, H., and Jensen, R. E. (1999). Division versus fusion: Dnm1p and Fzo1p antagonistically regulate mitochondrial shape. J. Cell Biol. 147, 699-706. [DOI] [PMC free article] [PubMed] [Google Scholar]
- Sesaki, H., Southard, S. M., Yaffe, M. P., and Jensen, R. E. (2003). Mgm1p, a dynamin-related GTPase, is essential for fusion of the mitochondrial outer membrane. Mol. Biol. Cell 14, 2342-2356. [DOI] [PMC free article] [PubMed] [Google Scholar]
- Shaw, J. M., and Nunnari, J. (2002). Mitochondrial dynamics and division in budding yeast. Trends Cell Biol. 12, 178-184. [DOI] [PMC free article] [PubMed] [Google Scholar]
- Smirnova, E., Griparic, L., Shurland, D. L., and van der Bliek, A. M. (2001). Dynamin-related protein Drp1 is required for mitochondrial division in mammalian cells. Mol. Biol. Cell 12, 2245-2256. [DOI] [PMC free article] [PubMed] [Google Scholar]
- Taylor, S. W., et al. (2003). Characterization of the human heart mitochondrial proteome. Nat. Biotechnol. 21, 281-286. [DOI] [PubMed] [Google Scholar]
- Wong, E. D., Wagner, J. A., Gorsich, S. W., McCaffery, J. M., Shaw, J. M., and Nunnari, J. (2000). The dynamin-related GTPase, Mgm1p, is an intermembrane space protein required for maintenance of fusion competent mitochondria. J. Cell Biol. 151, 341-352. [DOI] [PMC free article] [PubMed] [Google Scholar]
- Wong, E. D., Wagner, J. A., Scott, S. V., Okreglak, V., Holewinske, T. J., Cassidy-Stone, A., and Nunnari, J. (2003). The intramitochondrial dynamin-related GTPase, Mgm1p, is a component of a protein complex that mediates mitochondrial fusion. J. Cell Biol. 160, 303-311. [DOI] [PMC free article] [PubMed] [Google Scholar]
- Yaffe, M. P. (1999). The machinery of mitochondrial inheritance and behavior. Science 283, 1493-1497. [DOI] [PubMed] [Google Scholar]
- Zamzami, N., Marchetti, P., Castedo, M., Decaudin, D., Macho, A., Hirsch, T., Susin, S. A., Petit, P. X., Mignotte, B., and Kroemer, G. (1995). Sequential reduction of mitochondrial transmembrane potential and generation of reactive oxygen species in early programmed cell death. J. Exp. Med. 182, 367-377. [DOI] [PMC free article] [PubMed] [Google Scholar]
Associated Data
This section collects any data citations, data availability statements, or supplementary materials included in this article.


