

Abstract
Introduction
Limited data exist on flavoured non-cigarette tobacco product (NCTP) use among US adults.
Methods
Data from the 2013 to 2014 National Adult Tobacco Survey (N=75 233), a landline and cellular telephone survey of US adults aged ≥18, were assessed to estimate past 30-day NCTP use, flavoured NCTP use and flavour types using bivariate analyses.
Results
During 2013–2014, 14.4% of US adults were past 30-day NCTP users. Nationally, an estimated 10.2 million e-cigarette users (68.2%), 6.1 million hookah users (82.3%), 4.1 million cigar smokers (36.2%) and 4.0 million smokeless tobacco users (50.6%) used flavoured products in the past 30 days. The most prevalent flavours reported were menthol/mint (76.9%) for smokeless tobacco; fruit (74.0%) for hookah; fruit (52.4%), candy/chocolate/other sweet flavours (22.0%) and alcohol (14.5%) for cigars/cigarillos/filtered little cigars; fruit (44.9%), menthol/mint (43.9%) and candy/chocolate/other sweet flavours (25.7%) for e-cigarettes and fruit (56.6%), candy/chocolate/other sweet flavours (26.5%) and menthol/mint (24.8%) for pipes. Except for hookah and pipes, past 30-day flavoured product use was highest among 18–24-year olds. By cigarette smoking, never smoking e-cigarette users (84.8%) were more likely to report flavoured e-cigarette use, followed by recent former smokers (78.1%), long-term former smokers (70.4%) and current smokers (63.2%).
Conclusions
Flavoured NCTP use is prominent among US adult tobacco users, particularly among e-cigarette, hookah and cigar users. Flavoured product use, especially fruit and sweet-flavoured products, was higher among younger adults. It is important for tobacco prevention and control strategies to address all forms of tobacco use, including flavoured tobacco products.
INTRODUCTION
In September 2009, the US Food and Drug Administration (FDA), authorised by the Family Smoking Prevention and Tobacco Control Act of 2009 (Pub. L. No. 111-31, H.R. 1256), prohibited certain characterising flavours, other than tobacco and menthol, in cigarettes. In May 2016, the US FDA finalised a rule asserting the Agency’s regulatory authority over all other tobacco products meeting the definition of a tobacco product in the United States; however, characterising flavours are not currently prohibited in non-cigarette tobacco products (NCTPs).
Since 1964, the prevalence of current cigarette use among adults,1–3 especially young adults,4 has declined in the USA. However, the use of electronic cigarettes (e-cigarettes) has increased,5 and the use of other NCTPs, such as cigars, pipe tobacco and smokeless tobacco, has remained similar in recent years.4 This may be due, in part, to the growing availability of such tobacco products in an ever-increasing variety of flavours.6,7 While concern regarding flavoured tobacco has traditionally focused on the potential increased appeal to youth and young adult non-users of tobacco, flavours may also broaden tobacco’s appeal to current users.8–12
Previous national data on flavoured tobacco product use among US youth and adults provide limited insight into how flavours might differ in appeal across product types and populations. Multiple national studies have examined prevalence of menthol cigarettes and reported a high prevalence of menthol cigarette smoking among adults, including the highest prevalence of use among younger adults,13–16 women16,17 and African-Americans.16,17 Others have estimated prevalence of flavoured tobacco use without differentiating among flavour types18–22 or only differentiating between mint/menthol versus other flavours, without examining specific flavour types.15 18 20 Recent evidence revealed widespread flavoured tobacco product use by US youth.18,20 Studies of adults have consistently found flavoured product use associated with younger age;13–16 19 21 23 however, it is unclear whether this association persists after differentiating by flavour type and NCTP. Shiffman et al8 found that interest in e-cigarettes varied by flavour among adults; however, the researchers examined a limited number of flavours.
A clearer understanding of flavour use and patterns of flavoured NCTP use may inform current and future regulatory actions, in addition to tobacco prevention and control efforts at the national, state and local levels. However, to date, the extent of flavour use among adults and characteristics of adults who use specific flavour types have not been described in the scientific literature. To address these knowledge gaps, we assessed flavoured tobacco use by product in a nationally representative sample of adults aged ≥18 years, examining characteristics of flavoured product users by product type and specific flavours used. Study objectives were to (1) describe the proportion of current NCTP users reporting past 30-day flavoured product use, by product type and demographic and tobacco use characteristics; (2) identify flavour types most commonly used by US adults for each NCTP type, both overall and by age and (3) characterise associations between flavours used and other demographic characteristics, frequency of product use and cigarette smoking status.
METHODS
Data source
From January to April 2016, we analysed data from the National Adult Tobacco Survey (NATS), a stratified, random-digit-dialed telephone survey of 75 233 (landline sample: 52 594; cell phone sample: 22 639) non-institutionalised US adults aged ≥18 years, residing in the 50 states and the District of Columbia. Data were collected from October 2013 to October 2014. The overall response rate was 36.1% (landlines: 47.6%, cell phone: 17.1%). Survey methodology has been described in detail elsewhere.24
Measures
The survey assessed use of the following tobacco product types: cigarettes, cigars/cigarillos/filtered little cigars, pipes, hookah, e-cigarettes, chewing tobacco/snuff/dip, snus and dissolvable tobacco products.
Use of non-cigarette tobacco products
Ever users of NCTPs (defined as meeting a lifetime threshold for cigars (≥50 times), pipes (≥50 times) and chewing tobacco/snuff/dip (≥20 times) and any use of hookah, e-cigarettes, snus and dissolvable tobacco products (≥1 time)) were asked whether they currently used each respective product ‘every day’ ‘some days’, ‘rarely’ or ‘not at all’. Those who responded ‘every day’, ‘some days’ or ‘rarely’ were considered current users of each respective product.
Use of flavoured and unflavoured non-cigarette tobacco products
Both past 30-day use of a specific NCTP and flavour status of NCTPs used were determined from a question inquiring about flavoured use of each specific product within the past 30 days. Respondents reporting current use of e-cigarettes, cigars and smokeless tobacco (chew/snuff/dip, snus and dissolvables) were asked: “Were any of the <NCTP Type> that you smoked/used in the past 30 days flavoured to taste like menthol, mint, clove, spice, candy, fruit, chocolate or other sweets?” Response options were ‘yes’, ‘no’ and “Respondent did not use/smoke<NCTP type> in the past 30 days”. Respondents who did not use the product in the past 30 days were not considered past 30-day users and those who reported ‘yes’ or ‘no’ to use of a flavoured product were considered past 30-day users. Past 30-day use of a flavoured tobacco product was defined as the percentage of past 30-day users who reported using a flavour in the past 30 days.
Current users of hookah and pipes were asked: “Was any of the tobacco you smoked ‘either in a regular pipe or hookah’, ‘in a regular pipe’ or ‘in a hookah’ in the past 30 days flavoured to taste like menthol or mint, clove, spice, fruit, chocolate, or other sweets?” Response options were ‘yes’, ‘no’ and ‘Respondent did not smoke any tobacco in a pipe in the past 30 days’. We could not determine whether current users of hookah and pipes (dual users) who responded ‘yes’ had used hookah, pipes or both in the past 30 days. Thus, dual users of hookah and pipes were considered missing for prevalence of past 30-day use, and analyses of past 30-day use were restricted to persons who reported using only one product (hookah or pipes).
Past 30-day use of Any NCTP was defined as follows: If a respondent reported using at least one NCTP in the past 30 days, they were coded ‘yes’. If all of the variables for past 30-day use of specific NCTPs were coded ‘no’, then ‘past 30-day use of Any NCTP’ was coded ‘no’. Past 30-day use of any flavoured NCTP was defined as follows: If a respondent reported using at least one flavoured NCTP in the past 30 days, they were coded ‘yes’. If all of the variables for past 30-day use of specific flavoured NCTPs were coded ‘no’, then ‘past 30-day use of Any flavoured NCTP’ was coded ‘no’.
Types of flavours used
For each NCTP, use of specific flavours in the past 30 days was ascertained by the question, “Was the <NCTP type> menthol or mint flavoured?”; “…clove, spice, or herb flavoured?” “… Fruit flavoured?”; “…Alcohol flavoured?”; “…Candy, chocolate, or other sweet flavoured?”; “…Other?” Respondents were allowed to select multiple flavours. Flavoured NCTP users who reported using ‘Other’ flavour(s) were allowed to provide an open-ended response specifying the flavour(s) used.
Demographic characteristics
Demographic characteristics assessed were as follows: sex (male/female); age group (18–24, 25–29, 30–44, 45–64, ≥65 years old); race/ethnicity (White, Non-Hispanic (White NH); Black, Non-Hispanic (Black NH); and Other Non-Hispanic (Other NH); and Hispanic); annual household income (<US$20 000, US$20 000–49 999, US$50 000–99 000, ≥US$100 000), educational attainment (less than high school, general education development certificate, high school diploma, some college, bachelor’s degree or higher), US Census region (Northeast, Midwest, South, West) and sexual orientation (heterosexual/straight, lesbian/gay/bisexual, unspecified).
Cigarette smoking status
Current cigarette smoking status was determined by asking: “Have you smoked at least 100 cigarettes in your entire life?”, “Do you now smoke cigarettes every day, some days, or not at all?” and “How long has it been since you completely stopped smoking cigarettes?” Respondents who did not meet the 100 cigarette lifetime smoking threshold were classified as ‘never smokers’. Those who met the threshold and reported currently smoking ‘every day’ or ‘some days’ were considered ‘current smokers’. Former smokers were respondents who met the 100 cigarette lifetime smoking threshold but reported currently smoking ‘not at all’. They were split into two groups, ‘recent former smokers (≤12 months)’ or ‘long-term former smokers (>12 months)’, based on length of time since they completely stopped smoking.
Statistical analysis
Data were analysed using SAS callable SUDAAN release V.11.0.1 (Research Triangle Institute, Research Triangle Park, North Carolina, USA) and weighted to adjust for differential probabilities of selection and response and to provide nationally representative estimates. Variance estimates were based on the Taylor series linearisation method with replacement. For each NCTP type and for any NCTP, estimates and 95% CIs were computed for the following measures: (1) prevalence of past 30-day NCTP use; (2) proportion of past 30-day flavoured NCTP users among past 30-day NCTP users and (3) prevalence of specific flavour type use among past 30-day flavoured NCTP users. For each measure, estimates were calculated overall and by each demographic characteristic. For bivariate analyses, statistically significant differences in estimates among groups (p<0.05) were assessed using Satterthwaite-adjusted Wald χ2 tests. In addition, Cochran–Mantel–Haenszel tests for trend were conducted for ordinal variables (ie, age group, income and education). Estimates with a relative SE (RSE) ≥30% or denominator <50 were omitted. Missing values for any specific NCTP (don’t know/refused) were excluded from the sample used for analyses. Additionally, for all composite variables (ie, past 30-day any NCTP use and past 30-day any flavoured NCTP use), respondents with a value of ‘yes’ for use of any specific product were set to ‘yes’. Respondents with any combination of ‘no’ and ‘missing’ values were set to missing and excluded from the denominator used for the analysis.
RESULTS
Among US adults, prevalence of past 30-day use of any (at least one) NCTP was 14.5% (an estimated 33.4 million adults), including 6.4% (15.0 million adults) for e-cigarettes, 4.9% (11.4 million adults) for cigars, 3.4% (7.8 million adults) for smokeless tobacco, 3.2% (7.5 million adults) for hookah and 0.5% (1.2 million adults) for pipes (table 1). Among current users of e-cigarettes, cigars, smokeless tobacco, exclusive hookah and exclusive pipes, the proportion who reported using the product in the past 30 days was: 97.4% (95% CI 96.7% to 98.0%) for e-cigarettes, 91.2% (95% CI 89.8% to 92.4%) for cigars and 96.1% (95% CI 94.4% to 97.3%) for smokeless tobacco; 85.3% (95% CI 83.2% to 87.2%) for exclusive hookah use and 88.9% (95% CI 84.6% to 92.2%) for exclusive pipe use.
Table 1.
Overall prevalence of past 30-day use of NCTPs among US adults (ages 18 and older), by product and demographic characteristics, 2013–2014
| Past 30-day Any NCTP use* (n=73 866)
|
Past 30-day Electronic cigarette use† (n=75 038)
|
Past 30-day Hookah use‡ (n=74 893)
|
Past 30-day Cigar use§ (n=74 816)
|
Past 30-day Smokeless tobacco use¶ (n=74 597)
|
Past 30-day Pipe use** (n=74 662)
|
|||||||
|---|---|---|---|---|---|---|---|---|---|---|---|---|
| n | % (95% CI) | n | % (95% CI) | n | % (95% CI) | n | % (95% CI) | n | % (95% CI) | n | % (95% CI) | |
| Overall | 8020 | 14.5 (14.1 to 14.9) | 3434 | 6.4 (6.1 to 6.7) | 1427 | 3.2 (3.0 to 3.4) | 2783 | 4.9 (4.6 to 5.1) | 1984 | 3.4 (3.2 to 3.6) | 376 | 0.5 (0.4 to 0.6) |
| Gender | ||||||||||||
| Male | 5457 | 20.8 (20.2 to 21.5) | 1766 | 7.6 (7.2 to 8.1) | 823 | 3.8 (3.5 to 4.1) | 2314 | 8.4 (8.0 to 8.8) | 1822 | 6.6 (6.2 to 7.0) | 345 | 0.9 (0.8 to 1.1) |
| Female | 2489 | 8.7 (8.3 to 9.2) | 1637 | 5.3 (5.0 to 5.7) | 589 | 2.7 (2.4 to 3.0) | 439 | 1.6 (1.5 to 1.9) | 140 | 0.4 (0.3 to 0.5) | 31 | 0.1 (0.1 to 0.2) |
| Age group (years) | ||||||||||||
| 18–24 | 1505 | 30.5 (28.9 to 32.2) | 649 | 13.1 (12.0 to 14.3) | 758 | 15.8 (14.5 to 17.1) | 430 | 8.4 (7.5 to 9.4) | 352 | 6.3 (5.5 to 7.2) | 21 | 0.4 (0.2 to 0.7) |
| 25–29 | 926 | 24.3 (22.6 to 26.1) | 401 | 11.0 (9.8 to 12.4) | 328 | 8.1 (7.1 to 9.2) | 287 | 7.8 (6.8 to 8.9) | 214 | 5.2 (4.4 to 6.1) | 18 | 0.4 (0.2 to 0.7) |
| 30–44 | 1958 | 16.4 (15.6 to 17.3) | 893 | 7.9 (7.3 to 8.5) | 268 | 2.5 (2.1 to 2.9) | 673 | 5.8 (5.3 to 6.4) | 561 | 4.3 (3.9 to 4.7) | 74 | 0.5 (0.4 to 0.6) |
| 45–64 | 2553 | 10.6 (10.1 to 11.1) | 1134 | 4.6 (4.3 to 5.0) | 61 | 0.2 (0.1 to 0.3) | 974 | 4.0 (3.7 to 4.3) | 582 | 2.4 (2.2 to 2.7) | 136 | 0.6 (0.5 to 0.7) |
| 65+ | 1026 | 4.7 (4.3 to 5.0) | 331 | 1.5 (1.3 to 1.7) | 6 | †† | 404 | 1.8 (1.6 to 2.0) | 265 | 1.2 (1.1 to 1.4) | 124 | 0.5 (0.4 to 0.6) |
| Race/ethnicity | ||||||||||||
| White, Non-Hispanic | 5848 | 14.8 (14.3 to 15.2) | 2532 | 6.7 (6.4 to 7.0) | 819 | 2.4 (2.2 to 2.6) | 2002 | 4.9 (4.6 to 5.2) | 1601 | 4.1 (3.9 to 4.4) | 290 | 0.6 (0.5 to 0.7) |
| Black, Non-Hispanic | 658 | 12.8 (11.7 to 14.0) | 215 | 3.9 (3.3 to 4.5) | 166 | 3.8 (3.1 to 4.5) | 287 | 5.6 (4.9 to 6.5) | 89 | 1.3 (1.0 to 1.7) | 16 | †† |
| Hispanic | 700 | 16.7 (15.3 to 18.3) | 312 | 8.0 (6.9 to 9.3) | 171 | 5.2 (4.3 to 6.2) | 202 | 4.2 (3.4 to 5.2) | 161 | 3.4 (2.8 to 4.1) | 44 | 0.7 (0.4 to 1.0) |
| Other, Non-Hispanic‡‡ | 678 | 13.2 (12.1 to 14.5) | 320 | 6.2 (5.5 to 7.2) | 249 | 5.4 (4.6 to 6.3) | 235 | 4.5 (3.8 to 5.3) | 101 | 1.8 (1.4 to 2.4) | 17 | †† |
| Annual household income (US$) | ||||||||||||
| <20 000 | 820 | 15.5 (14.2 to 16.8) | 389 | 7.7 (6.8 to 8.8) | 111 | 2.6 (2.0 to 3.4) | 307 | 5.7 (5.0 to 6.6) | 157 | 2.6 (2.1 to 3.2) | 51 | 0.8 (0.6 to 1.2) |
| 20 000–49 999 | 2194 | 17.1 (16.2 to 17.9) | 1052 | 8.4 (7.7 to 9.0) | 411 | 4.1 (3.6 to 4.7) | 735 | 5.7 (5.2 to 6.3) | 487 | 3.5 (3.1 to 3.9) | 115 | 0.6 (0.5 to 0.7) |
| 50 000–99 999 | 1953 | 14.4 (13.7 to 15.2) | 813 | 6.2 (5.7 to 6.8) | 366 | 3.1 (2.8 to 3.6) | 625 | 4.5 (4.1 to 5.0) | 527 | 3.8 (3.4 to 4.3) | 102 | 0.6 (0.4 to 0.8) |
| ≥100 000 | 1228 | 12.2 (11.4 to 13.0) | 403 | 4.3 (3.9 to 4.9) | 206 | 2.7 (2.3 to 3.2) | 510 | 4.6 (4.1 to 5.1) | 336 | 3.2 (2.8 to 3.7) | 35 | 0.3 (0.2 to 0.4) |
| Unspecified | 1825 | 13.2 (12.5 to 14.0) | 777 | 5.7 (5.2 to 6.2) | 333 | 3.0 (2.6 to 3.4) | 606 | 4.4 (3.9 to 4.8) | 477 | 3.2 (2.8 to 3.6) | 73 | 0.4 (0.3 to 0.5) |
| Education | ||||||||||||
| Less than high school | 734 | 15.2 (13.9 to 16.6) | 306 | 6.4 (5.5 to 7.3) | 75 | 2.4 (1.8 to 3.3) | 262 | 5.8 (5.0 to 6.7) | 241 | 4.2 (3.6 to 5.0) | 44 | 0.8 (0.6 to 1.2) |
| GED | 315 | 28.7 (25.5 to 32.2) | 160 | 15.5 (12.9 to 18.4) | 40 | 4.4 (3.0 to 6.4) | 124 | 11.6 (9.5 to 14.1) | 65 | 5.5 (3.9 to 7.5) | 17 | †† |
| High school diploma | 2026 | 17.2 (16.3 to 18.1) | 934 | 8.0 (7.4 to 8.7) | 365 | 3.9 (3.4 to 4.4) | 626 | 5.2 (4.7 to 5.8) | 591 | 4.5 (4.1 to 5.0) | 76 | 0.5 (0.4 to 0.7) |
| Some college | 2727 | 16.1 (15.4 to 16.8) | 1337 | 7.9 (7.4 to 8.5) | 479 | 3.6 (3.2 to 4.0) | 913 | 5.3 (4.9 to 5.8) | 612 | 3.4 (3.1 to 3.7) | 110 | 0.4 (0.3 to 0.5) |
| Bachelor’s degree or higher | 2125 | 8.9 (8.5 to 9.4) | 658 | 2.7 (2.4 to 2.9) | 452 | 2.4 (2.2 to 2.7) | 826 | 3.2 (2.9 to 3.4) | 448 | 1.8 (1.6 to 2.0) | 127 | 0.4 (0.3 to 0.5) |
| US Census Region | ||||||||||||
| Northeast | 1266 | 12.0 (11.1 to 12.9) | 501 | 4.7 (4.2 to 5.3) | 297 | 3.4 (2.9 to 4.0) | 461 | 4.0 (3.6 to 4.6) | 221 | 1.9 (1.6 to 2.3) | 61 | 0.4 (0.3 to 0.6) |
| Midwest | 1717 | 14.9 (14.1 to 15.8) | 759 | 6.8 (6.2 to 7.4) | 240 | 2.5 (2.1 to 2.9) | 601 | 5.2 (4.7 to 5.7) | 457 | 3.7 (3.3 to 4.1) | 81 | 0.6 (0.5 to 0.8) |
| South | 2980 | 15.9 (15.2 to 16.5) | 1228 | 6.8 (6.4 to 7.3) | 465 | 3.1 (2.8 to 3.4) | 1042 | 5.5 (5.1 to 5.9) | 804 | 4.3 (3.9 to 4.7) | 132 | 0.5 (0.4 to 0.6) |
| West | 2057 | 13.7 (12.9 to 14.5) | 946 | 6.7 (6.1 to 7.3) | 425 | 3.9 (3.5 to 4.4) | 679 | 4.3 (3.9 to 4.8) | 502 | 2.8 (2.5 to 3.1) | 102 | 0.5 (0.4 to 0.6) |
| Sexual orientation | ||||||||||||
| Heterosexual/straight | 6662 | 14.3 (13.9 to 14.7) | 2852 | 6.3 (6.0 to 6.6) | 1105 | 2.9 (2.7 to 3.2) | 2306 | 4.8 (4.6 to 5.1) | 1682 | 3.4 (3.2 to 3.6) | 319 | 0.5 (0.4 to 0.6) |
| Lesbian, gay or bisexual | 403 | 26.8 (24.0 to 29.8) | 208 | 13.7 (11.6 to 16.2) | 143 | 11.8 (9.7 to 14.4) | 123 | 8.2 (6.6 to 10.1) | 41 | 2.9 (1.9 to 4.6) | 14 | †† |
| Unspecified | 955 | 12.7 (11.7 to 13.7) | 374 | 5.4 (4.7 to 6.1) | 179 | 3.0 (2.5 to 3.7) | 354 | 4.4 (3.9 to 5.0) | 261 | 3.1 (2.7 to 3.7) | 43 | 0.5 (0.3 to 0.7) |
| Cigarette smoking status | ||||||||||||
| Current smoker | 3665 | 41.5 (40.1 to 42.8) | 2358 | 25.7 (24.5 to 27.0) | 470 | 6.8 (6.1 to 7.7) | 1328 | 15.7 (14.8 to 16.8) | 607 | 7.2 (6.5 to 7.9) | 164 | 1.5 (1.2 to 1.9) |
| Recent former smoker | 599 | 36.6 (33.6 to 39.6) | 408 | 24.0 (21.5 to 26.7) | 79 | 6.3 (4.8 to 8.2) | 111 | 7.3 (5.8 to 9.1) | 98 | 6.0 (4.6 to 7.6) | 10 | †† |
| Long-term former smoker | 1430 | 9.4 (8.9 to 10.1) | 282 | 2.1 (1.8 to 2.4) | 91 | 0.7 (0.6 to 1.0) | 608 | 3.7 (3.4 to 4.1) | 530 | 3.5 (3.1 to 3.9) | 99 | 0.5 (0.4 to 0.7) |
| Never smoker | 2243 | 7.2 (6.8 to 7.6) | 365 | 1.4 (1.2 to 1.6) | 774 | 2.9 (2.7 to 3.2) | 707 | 2.0 (1.8 to 2.2) | 718 | 2.0 (1.8 to 2.2) | 93 | 0.2 (0.1 to 0.2) |
Any NCTP users were defined as respondents who used electronic cigarettes, hookah, cigars (cigar/cigarillo/little filtered cigars), smokeless tobacco (chew, snuff, dip, snus, dissolvables) or regular pipes in the past 30 days. Respondents with any combination of ‘no’ and missing information (don’t know/refused/unknown values) for past 30-day e-cigarette, hookah, cigar, smokeless tobacco or regular pipe use (n=1367) were excluded from the denominator.
Past 30-day electronic cigarette users were defined as respondents who reported smoking at least 1 electronic cigarette during their lifetime, now used ‘every day’, ‘some days’ or ‘rarely’ and provided a response of ‘yes’ or ‘no’ to the question, “Were any of the electronic cigarettes that you used in the past 30 days flavoured to taste like menthol, mint, clove, spice, candy, fruit, chocolate or other sweets?” Due to missing information (don’t know/refused values), 195 respondents were excluded from the denominator.
Past 30-day hookah smokers were defined as respondents who reported smoking tobacco in a hookah at least 1 time during their lifetime, now smoked ‘every day’, ‘some days’ or ‘rarely’, provided a response of ‘yes’ or ‘no’ to the question, “Was any of the tobacco that you smoked ‘either in a regular pipe or a hookah’, ‘in a regular pipe’, ‘in a hookah’ in the past 30 days flavoured to taste like menthol or mint, clove, spice, candy, fruit, chocolate or other sweets?” and did not report smoking a regular pipe filled with tobacco ‘every day’, ‘some days’ or ‘rarely’. Dual users of hookah and regular pipes were excluded from the denominator (n=223) since past 30-day use status of specific product could not be determined. In addition, respondents with any combination of ‘no’ and missing information (don’t know/refused/unknown values) for regular pipe and water pipe/hookah use (n=340) were excluded from the denominator.
Past 30-day cigar/cigarillo/filtered little cigar smokers were defined as respondents who reported smoking at least 50 cigars, cigarillos or little filtered cigars during their lifetime, now smoked ‘every day’, ‘some days’ or ‘rarely’ and provided a response of ‘yes’ or ‘no’ to the question, “In the past 30 days, were any of the cigars, cigarillos, or little filtered cigars that you smoked flavoured to taste like menthol or mint, clove, spice, candy, fruit, chocolate or other sweets?” Due to missing information (don’t know/refused values), 417 respondents were excluded from the denominator.
Past 30-day smokeless tobacco users were defined using three product types: (1) chewing tobacco, snuff or dip; (2) snus and (3) dissolvable tobacco products. Chewing tobacco, snuff or dip users were respondents who reported using the product at least 20 times during their lifetime and now used it ‘every day’, ‘some days’ or ‘rarely’. Snus or dissolvable tobacco product users were respondents who reported using each respective product at least once during their lifetime and now used it ‘every day’, ‘some days’, or ‘rarely. Additionally, respondents must have provided a response of ‘yes’ or ‘no’ to the question, “In the past 30 days, was any of the (smokeless tobacco products) that you used flavoured to taste like menthol, mint, clove, spice, candy, fruit, chocolate or other sweets?” Respondents with any combination of ‘no’ and missing information (don’t know/refused/unknown values) for traditional smokeless tobacco (chew, snuff, dip), snus or dissolvable use (n=636), were excluded from the denominator.
Past 30-day regular pipe smokers were defined as respondents who reported smoking a regular pipe filled with tobacco at least 50 times during their lifetime, now smoked ‘every day’, ‘some days’ or ‘rarely’, provided a response of ‘yes’ or ‘no’ to the question, “Was any of the tobacco that you smoked ‘either in a regular pipe or a hookah’, ‘in a regular pipe’, ‘in a hookah’ in the past 30 days flavoured to taste like menthol or mint, clove, spice, candy, fruit, chocolate or other sweets?” and did not report smoking tobacco in a hookah ‘every day’, ‘some days’ or ‘rarely’. Dual users of hookah and regular pipes were excluded from the denominator (n=223) since past 30-day use status of specific product could not be determined. In addition, respondents with any combination of ‘no’ and missing information (don’t know/refused/unknown values) for regular pipe and water pipe/hookah use (n=348) were excluded from the denominator.
The relative SE was ≥30% or denominator <50.
Other, Non-Hispanic includes Asian, Non-Hispanic; Native Hawaiian or Other Pacific Islander, Non-Hispanic; American Indian or Alaska Native, Non-Hispanic; Multiracial, Non-Hispanic and Other race, Non-Hispanic.
GED, general education development certificate; n, unweighted number of past 30-day product users; NCTP, non-cigarette tobacco product.
The proportion of any flavoured product use among past 30-day users of any NCTP was 61.1% (20.4 million adults) (table 2). The proportion of past 30-day flavoured product use was highest among hookah users (82.3%; 6.1 million adults), followed by users of e-cigarettes (68.2%; 10.2 million adults), smokeless tobacco (50.6%; 4.0 million adults), cigars (36.2%; 4.1 million adults) and pipes (25.8%; 0.3 million adults).
Table 2.
Percentage of flavoured tobacco use among non-cigarette tobacco users, by product and demographic characteristics, 2013–2014
| Any flavoured NCTP use g(n=8020) |
Flavoured Electronic cigarette use (n=3434) |
Flavoured Hookah use (n=1427) |
Flavoured Cigar use (n=2783) |
Flavoured Smokeless tobacco use (n=1984) |
Flavoured Pipe use (n=376) |
|||||||||||||
|---|---|---|---|---|---|---|---|---|---|---|---|---|---|---|---|---|---|---|
| n | % (95% CI) | p Value* | n | % (95% CI) | p Value* | n | % (95% CI) | p Value* | n | % (95% CI) | p Value* | n | % (95% CI) | p Value* | n | % (95% CI) | p Value* | |
| Overall | 4333 | 61.1 (59.7 to 62.5) | 2173 | 68.2 (66.2 to 70.2) | 1144 | 82.3 (79.8 to 84.6) | 848 | 36.2 (33.7 to 38.7) | 919 | 50.6 (47.7 to 53.5) | 68 | 25.8 (19.7 to 33.0) | ||||||
| Gender | <0.001 | 0.799 | 0.359 | <0.001 | 0.855 | † | ||||||||||||
| Male | 2672 | 56.3 (54.6 to 58.0) | 1120 | 68.0 (65.2 to 70.6) | 653 | 81.3 (77.8 to 84.3) | 592 | 31.3 (28.7 to 34.1) | 847 | 50.6 (47.6 to 53.6) | 62 | 25.2 (18.9 to 32.7) | ||||||
| Female | 1618 | 71.7 (69.4 to 73.9) | 1034 | 68.5 (65.5 to 71.4) | 478 | 83.6 (79.6 to 86.9) | 243 | 59.4 (53.2 to 65.3) | 61 | 49.4 (37.2 to 61.7) | 6 | ‡ | ||||||
| Age group (years) | <0.001 | <0.001 | † | <0.001 | <0.001 | † | ||||||||||||
| 18–24 | 1240 | 83.5 (81.2 to 85.6) | 545 | 85.2 (81.7 to 88.2) | 646 | 85.9 (82.8 to 88.5) | 208 | 48.3 (42.3 to 54.3) | 239 | 68.9 (62.7 to 74.6) | 8 | ‡ | ||||||
| 25–29 | 639 | 69.5 (65.6 to 73.2) | 288 | 72.8 (67.2 to 77.7) | 255 | 76.7 (70.3 to 82.0) | 105 | 41.0 (34.1 to 48.3) | 121 | 55.2 (46.7 to 63.5) | 4 | ‡ | ||||||
| 30–44 | 1121 | 61.6 (58.9 to 64.2) | 604 | 70.0 (66.1 to 73.7) | 201 | 79.8 (73.1 to 85.3) | 213 | 37.1 (32.3 to 42.2) | 262 | 51.1 (45.8 to 56.3) | 22 | 28.0 (17.9 to 41.0) | ||||||
| 45–64 | 1055 | 41.9 (39.5 to 44.4) | 603 | 51.8 (48.0 to 55.6) | 37 | 66.8 (51.9 to 79.0) | 252 | 28.8 (25.1 to 32.8) | 225 | 37.2 (32.4 to 42.2) | 23 | 25.1 (15.5 to 37.9) | ||||||
| 65+ | 255 | 26.3 (22.9 to 30.1) | 118 | 35.9 (29.1 to 43.2) | 2 | ‡ | 67 | 17.8 (13.4 to 23.2) | 68 | 28.1 (21.7 to 35.4) | 10 | ‡ | ||||||
| Race/ethnicity | <0.001 | <0.001 | 0.059 | <0.001 | 0.019 | † | ||||||||||||
| White, Non-Hispanic | 2926 | 55.7 (54.0 to 57.3) | 1502 | 63.2 (60.7 to 65.5) | 648 | 80.0 (76.3 to 83.2) | 520 | 30.5 (27.8 to 33.3) | 729 | 48.8 (45.7 to 52.0) | 49 | 25.5 (18.5 to 33.9) | ||||||
| Black, Non-Hispanic | 436 | 71.8 (67.4 to 75.7) | 180 | 87.5 (81.8 to 91.6) | 143 | 89.2 (83.4 to 93.1) | 132 | 47.9 (40.7 to 55.1) | 33 | 44.7 (31.3 to 58.8) | 9 | ‡ | ||||||
| Hispanic | 426 | 68.6 (64.1 to 72.7) | 206 | 71.6 (64.9 to 77.5) | 133 | 81.7 (74.2 to 87.5) | 87 | 48.6 (38.4 to 59.0) | 79 | 55.1 (45.0 to 64.7) | 5 | ‡ | ||||||
| Other, Non-Hispanic§ | 472 | 74.6 (70.6 to 78.2) | 250 | 80.6 (74.7 to 85.5) | 203 | 82.7 (76.5 to 87.6) | 94 | 47.6 (39.6 to 55.8) | 60 | 66.6 (54.4 to 76.9) | 1 | ‡ | ||||||
| Annual household income (US$) | <0.001 | 0.366 | 0.917 | <0.001 | 0.323 | † | ||||||||||||
| <20 000 | 475 | 62.7 (58.1 to 67.0) | 248 | 66.7 (60.1 to 72.8) | 91 | 85.4 (75.7 to 91.7) | 144 | 47.8 (40.7 to 55.0) | 69 | 47.6 (36.9 to 57.1) | 14 | 40.6 (23.6 to 60.3) | ||||||
| 20 000–49 999 | 1250 | 62.7 (60.0 to 65.3) | 657 | 68.4 (64.7 to 71.9) | 334 | 82.2 (77.2 to 86.4) | 276 | 44.1 (39.1 to 49.2) | 239 | 51.4 (45.7 to 57.1) | 21 | 26.4 (16.2 to 39.8) | ||||||
| 50 000–99 999 | 1028 | 59.7 (56.9 to 62.5) | 517 | 67.2 (62.9 to 71.2) | 292 | 81.3 (76.3 to 85.5) | 147 | 29.7 (24.8 to 35.2) | 226 | 46.3 (40.7 to 52.0) | 13 | ‡ | ||||||
| ≥100 000 | 556 | 53.8 (50.3 to 57.3) | 239 | 64.5 (58.6 to 70.0) | 160 | 81.1 (74.0 to 86.5) | 74 | 20.2 (15.7 to 25.6) | 169 | 55.0 (48.4 to 61.5) | 6 | ‡ | ||||||
| Unspecified | 1024 | 64.4 (61.5 to 67.1) | 512 | 71.4 (67.2 to 75.3) | 267 | 83.1 (77.5 to 87.5) | 207 | 38.4 (33.2 to 43.8) | 216 | 52.5 (46.7 to 58.3) | 14 | 30.9 (17.1 to 49.2) | ||||||
| Education | <0.001 | 0.078 | 0.166 | <0.001 | 0.203 | † | ||||||||||||
| Less than high school | 420 | 64.4 (59.9 to 68.7) | 194 | 70.0 (63.6 to 75.8) | 64 | 83.9 (68.7 to 92.5) | 122 | 46.2 (38.7 to 53.9) | 111 | 54.9 (46.5 to 63.0) | 13 | ‡ | ||||||
| High school diploma/GED | 1354 | 62.9 (60.4 to 65.3) | 722 | 69.4 (65.8 to 72.7) | 334 | 84.2 (79.8 to 87.8) | 301 | 42.3 (37.7 to 47.1) | 295 | 48.6 (43.8 to 53.5) | 19 | 30.5 (19.3 to 44.7) | ||||||
| Some college | 1575 | 63.4 (61.2 to 65.6) | 859 | 68.5 (65.4 to 71.6) | 395 | 83.7 (79.7 to 87.1) | 286 | 35.6 (31.6 to 39.8) | 307 | 53.2 (48.2 to 58.1) | 23 | 20.4 (13.1 to 30.3) | ||||||
| Bachelor’s degree or higher | 927 | 49.6 (46.9 to 52.3) | 372 | 60.5 (55.8 to 65.0) | 337 | 75.2 (70.2 to 79.5) | 124 | 16.9 (13.7 to 20.6) | 193 | 45.8 (40.1 to 51.6) | 13 | ‡ | ||||||
| US census region | 0.126 | 0.004 | 0.049 | 0.034 | 0.277 | † | ||||||||||||
| Northeast | 682 | 60.6 (56.9 to 64.2) | 289 | 63.8 (57.9 to 69.3) | 244 | 86.3 (81.4 to 90.1) | 107 | 28.3 (22.6 to 34.9) | 122 | 51.7 (43.2 to 60.1) | 8 | ‡ | ||||||
| Midwest | 905 | 58.7 (55.7 to 61.7) | 451 | 62.9 (58.5 to 67.1) | 199 | 86.1 (80.3 to 90.4) | 187 | 36.4 (31.4 to 41.6) | 227 | 55.3 (49.4 to 61.1) | 11 | ‡ | ||||||
| South | 1595 | 61.2 (59.0 to 63.3) | 814 | 70.7 (67.4 to 73.8) | 363 | 82.1 (77.9 to 85.6) | 342 | 39.2 (35.4 to 43.2) | 356 | 49.3 (44.9 to 53.7) | 30 | 33.9 (23.8 to 45.7) | ||||||
| West | 1151 | 63.8 (61.0 to 66.5) | 619 | 71.4 (67.6 to 75.0) | 338 | 77.7 (71.8 to 82.6) | 212 | 35.5 (30.3 to 41.2) | 214 | 47.6 (41.7 to 53.5) | 19 | 23.1 (13.6 to 36.4) | ||||||
| Sexual orientation | <0.001 | 0.083 | 0.063 | <0.001 | † | † | ||||||||||||
| Heterosexual/straight | 3521 | 59.6 (58.1 to 61.1) | 1782 | 67.4 (65.2 to 69.6) | 877 | 81.2 (78.2 to 83.8) | 667 | 35.1 (32.4 to 37.9) | 771 | 49.7 (46.6 to 52.8) | 55 | 22.8 (16.8 to 30.3) | ||||||
| Lesbian, gay or bisexual | 289 | 79.7 (75.0 to 83.7) | 146 | 76.2 (68.8 to 82.3) | 124 | 89.6 (82.7 to 94.0) | 65 | 63.2 (52.6 to 72.7) | 28 | ‡ | 2 | ‡ | ||||||
| Unspecified | 523 | 62.8 (58.8 to 66.6) | 245 | 69.1 (62.7 to 74.9) | 143 | 82.6 (73.7 to 89.0) | 116 | 32.4 (26.5 to 39.0) | 120 | 52.9 (45.0 to 60.7) | 11 | ‡ | ||||||
| Cigarette smoking status | <0.001 | <0.001 | 0.826 | <0.001 | 0.030 | † | ||||||||||||
| Current smoker | 2148 | 63.3 (61.3 to 65.3) | 1384 | 63.2 (60.5 to 65.7) | 387 | 83.8 (79.0 to 87.7) | 531 | 43.8 (40.3 to 47.5) | 330 | 55.3(50.6 to 60.7) | 41 | 34.1 (24.3 to 45.4) | ||||||
| Recent former smoker | 405 | 72.1 (67.4 to 76.4) | 292 | 78.1 (72.9 to 82.5) | 64 | 82.2 (69.2 to 90.5) | 43 | 38.9 (28.1 to 50.9) | 57 | 57.7 (44.7 to 69.6) | 1 | ‡ | ||||||
| Long-term former smoker | 533 | 44.7 (41.3 to 48.2) | 179 | 70.4 (63.7 to 76.4) | 67 | 81.2 (70.8 to 88.5) | 96 | 18.0 (14.3 to 22.4) | 222 | 46.9 (41.5 to 52.5) | 11 | ‡ | ||||||
| Never smoker | 1211 | 62.8 (60.3 to 65.3) | 306 | 84.8 (79.9 to 88.6) | 615 | 81.4 (78.1 to 84.4) | 167 | 30.8 (26.2 to 35.8) | 300 | 46.9 (42.1 to 51.8) | 13 | 18.6 (10.1 to 31.8) | ||||||
| Frequency of use | <0.001 | † | 0.002 | ¶ | † | |||||||||||||
| Every day | – | – | 537 | 75.7 (71.8 to 79.2) | 15 | ‡ | 144 | 43.1 (36.3 to 50.2) | – | – | 10 | ‡ | ||||||
| Some days | – | – | 659 | 68.5 (64.8 to 72.0) | 161 | 91.7 (86.1 to 95.1) | 222 | 41.8 (36.6 to 47.3) | – | – | 22 | 33.8 (21.4 to 48.9) | ||||||
| Rarely | – | – | 977 | 64.8 (61.7 to 67.7) | 968 | 80.8 (77.9 to 83.3) | 482 | 32.8 (29.9 to 36.0) | – | – | 36 | 25.1 (17.3 to 35.0) | ||||||
p Value based on Satterthwaite-adjusted Wald χ2.
p Value not presented due to unstable estimates for one or more demographic groups.
The relative SE was ≥30% or denominator <50.
Other, Non-Hispanic includes Asian, Non-Hispanic; Native Hawaiian or Other Pacific Islander, Non-Hispanic; American Indian or Alaska Native, Non-Hispanic; Multiracial, Non-Hispanic and Other race, Non-Hispanic.
Since frequency of smokeless tobacco use (‘every day’, ‘some days’ or ‘rarely’) was assessed in three separate questions based on product type: (1) chewing tobacco, snuff or dip; (2) snus and (3) dissolvable tobacco products, there were different combinations of responses which could not be aggregated into a single frequency of use variable. Thus, flavoured smokeless tobacco use by frequency of use is not presented.
GED, general education development certificate; n, unweighted number of past 30-day flavoured product users.
Past 30-day flavoured NCTP use
For all NCTPs, an age gradient in flavoured product use among past 30-day product users was evident, with higher flavoured product use consistently associated with younger age. Among 18–24-year old NCTP users, flavoured product use by NCTP type was 85.9% for hookah, 85.2% for e-cigarettes, 68.9% for smokeless tobacco and 48.3% for cigars (table 2). In contrast, among 45–64-year olds, flavoured product use was 66.8% for hookah, 51.8% for e-cigarettes, 37.2% for smokeless tobacco and 28.8% for cigars. Despite a lower female prevalence of past 30-day cigar use, flavoured cigar use was higher among female cigar smokers compared to male cigar smokers (male: 31.3% vs female: 59.4%, p<0.001). Flavoured cigar use was also higher among cigar smokers with lower income, with less education and those who were lesbian, gay or bisexual. Except for hookah, for which flavoured product use was uniformly high, flavoured product use varied by race/ethnicity overall and by NCTP type. Among e-cigarette users, the majority (over 60%) of each racial/ethnic group reported past 30-day flavour use; and flavoured e-cigarette use was significantly lower among White NH (63.2%) than other racial/ethnic groups, with Black NH reporting the highest proportion of flavoured use (87.5%). Similarly, the use of flavoured cigars was significantly lower for White NH cigar smokers (30.5%) compared to other racial/ethnic groups.
The use of flavoured e-cigarettes and flavoured cigars varied by cigarette smoking status (tables 1 and 2). Current cigarette smokers and recent former smokers had the highest prevalence of e-cigarette use and cigar use, as well as the highest proportion of flavoured cigar use; however, these groups differed with regard to flavoured e-cigarette use. Never cigarette smokers (84.8%) had the highest proportion of flavoured e-cigarette use, followed by recent former smokers (78.1%) and long-term former smokers (70.4%). Current cigarette smokers were least likely to report flavoured e-cigarette use (63.2%). The low prevalence of pipe use prevented assessment of flavour use patterns among past 30-day pipe smokers by sociodemographic characteristics.
Specific flavours used by product type
As shown in figure 1, the use of specific flavours varied by NCTP. The vast majority of flavoured smokeless tobacco users reported using a menthol/mint-flavoured product (76.9%), followed by clove/spice/herb-flavoured (12.3%), fruit-flavoured (10.8%), and candy/chocolate/other sweet-flavoured (4.5%) products. The use of smokeless tobacco flavoured with alcohol (1.6%) or other flavours (1.4%) was minimal. Most flavoured hookah users reported using fruit flavours (74.0%), and menthol/mint (18.9%), candy/chocolate/other sweet-flavoured (17.4%), clove/spice/herb-flavoured (4.3%), alcohol-flavoured (3.2%) and other flavoured (3.0%) hookah. A similar proportion of flavoured e-cigarette users reported using fruit flavours (44.9%) and menthol/mint flavour (43.9%), followed by candy/chocolate/other sweet flavours (25.7%), clove/spice/herb flavours (7.0%), other flavours (6.1%) and alcohol flavours (4.0%) (figure 1). The most frequently reported cigar flavour was fruit (52.4%), followed by candy/chocolate/other sweet flavours (22.0%), alcohol flavours (14.5%), menthol/mint flavour (12.9%), clove/spice/herb flavours (8.1%) and other flavours (2.9%). Among flavoured pipe smokers use of fruit flavours was most prevalent (56.6%), followed by almost equal proportions of use of candy/chocolate/other sweet flavours (26.5%) and of menthol/mint flavour (24.8%).
Figure 1.
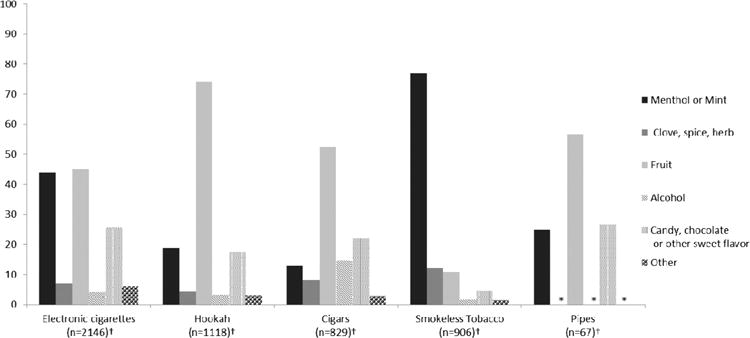
Specific flavours used among flavoured non-cigarette tobacco product users in the past 30 days, by type of tobacco product. *Estimates of specific flavour use among flavoured regular pipe smokers were unstable (RSE >30%) for clove, spice, herb flavour; alcohol flavour and other flavour and therefore excluded from the figure. †Respondents were allowed to report the use of more than one flavour for each tobacco product. Missing responses (don’t know/refused) on specific flavour for each product was excluded from the denominator (n=27 for electronic cigarettes; n=26 for hookah; n=19 for cigars; n=13 smokeless tobacco; n=1 for regular pipes). RSE, relative SE.
No meaningful differences in the distribution of demographic characteristics among users of different flavour types were observed for flavoured smokeless tobacco use (see online supplementary table S1) or flavoured hookah use (see online supplementary table S2).
Tables 3 and 4 summarise results of bivariate analyses to identify differences in use of the top three specific flavours used by flavoured e-cigarette users and flavoured cigar users, respectively. Fruit-flavoured e-cigarette use was associated with younger age, not being of Black NH race/ethnicity, and not being a current cigarette smoker (table 3). Candy/chocolate/other sweet-flavoured e-cigarette use was associated with not being of Black NH race/ethnicity and was more prevalent among never cigarette smokers and long-term former smokers than current and former recent smokers. Conversely, menthol/mint-flavoured e-cigarette use was higher among older adults (≥45 years) than younger adults (<45 years); higher among Black NH (63.3%) than all other race/ethnicity groups (ranging from 35.7% to 43.7%) and highest among current cigarette smokers.
Table 3.
Demographic factors associated with the top three flavour types used with electronic cigarettes in the past 30 days among past 30-day users of flavoured e-cigarettes, by specific flavour (n=2146)
| Fruit flavour*
|
Menthol/mint flavour*
|
Candy, chocolate or other sweet flavour*
|
|||||||
|---|---|---|---|---|---|---|---|---|---|
| n | % (95% CI) | p Value† | n | % (95% CI) | p Value† | n | % (95% CI) | p Value† | |
| Overall | 951 | 44.9 (42.2 to 47.7) | 957 | 43.9 (41.1 to 46.7) | 515 | 25.7 (23.4 to 28.3) | |||
| Gender | 0.398 | 0.068 | 0.559 | ||||||
| Male | 506 | 45.9 (42.1 to 49.7) | 472 | 41.6 (38.0 to 45.4) | 277 | 26.5 (23.2 to 30.0) | |||
| Female | 435 | 43.5 (39.5 to 47.6) | 478 | 46.8 (42.7 to 51.0) | 235 | 25.0 (21.6 to 28.8) | |||
| Age group (years) | 0.001 | <0.001 | ‡ | ||||||
| 18–24 | 294 | 50.9 (45.7 to 56.1) | 198 | 37.1 (32.1 to 42.3) | 161 | 31.1 (26.5 to 36.1) | |||
| 25–29 | 151 | 47.4 (40.1 to 54.8) | 123 | 46.2 (38.8 to 53.8) | 81 | 27.7 (21.5 to 34.8) | |||
| 30–44 | 266 | 44.6 (39.6 to 49.8) | 247 | 41.0 (36.1 to 46.1) | 163 | 26.8 (22.6 to 31.5) | |||
| 45–64 | 197 | 35.0 (30.2 to 40.1) | 318 | 56.0 (50.8 to 61.0) | 91 | 15.0 (11.8 to 18.9) | |||
| 65+ | 37 | 32.9 (22.0 to 46.0) | 66 | 58.7 (45.9 to 70.4) | 16 | § | |||
| Race/ethnicity | 0.004 | <0.001 | <0.001 | ||||||
| White, Non-Hispanic | 692 | 47.8 (44.5 to 51.1) | 646 | 43.7 (40.4 to 47.0) | 351 | 25.8 (23.0 to 28.8) | |||
| Black, Non-Hispanic | 50 | 29.1 (22.0 to 37.4) | 115 | 63.3 (54.7 to 71.2) | 22 | 11.1 (6.9 to 17.4) | |||
| Hispanic | 92 | 44.3 (35.2 to 53.8) | 86 | 38.4 (29.8 to 47.8) | 54 | 26.4 (19.4 to 34.9) | |||
| Other, Non-Hispanic¶ | 104 | 42.9 (35.2 to 50.9) | 93 | 35.7 (28.5 to 43.7) | 79 | 33.3 (26.1 to 41.3) | |||
| Annual household income (US$) | 0.385 | 0.909 | 0.177 | ||||||
| <20 000 | 93 | 38.2 (30.5 to 46.5) | 116 | 46.6 (38.3 to 55.0) | 61 | 28.2 (20.7 to 37.1) | |||
| 20 000–49 999 | 296 | 44.1 (39.1 to 49.2) | 299 | 44.8 (39.7 to 49.9) | 152 | 25.4 (21.2 to 30.2) | |||
| 50 000–99 999 | 238 | 46.3 (40.6 to 52.0) | 213 | 42.1 (36.4 to 48.0) | 121 | 24.5 (19.8 to 29.9) | |||
| ≥100 000 | 102 | 44.0 (36.2 to 52.1) | 108 | 44.4 (36.7 to 52.2) | 44 | 18.9 (13.8 to 25.4) | |||
| Unspecified | 222 | 48.1 (42.6 to 53.6) | 221 | 43.1 (37.7 to 48.5) | 137 | 29.2 (24.6 to 34.4) | |||
| Education | 0.296 | 0.599 | 0.401 | ||||||
| Less than high school | 79 | 38.3 (29.9 to 47.4) | 70 | 40.5 (31.5 to 50.1) | 49 | 26.9 (19.6 to 35.7) | |||
| High school diploma/GED | 317 | 44.8 (40.1 to 49.5) | 317 | 45.3 (40.7 to 50.1) | 203 | 28.3 (24.3 to 32.7) | |||
| Some college | 383 | 46.5 (42.4 to 50.7) | 393 | 42.7 (38.7 to 46.9) | 183 | 23.8 (20.2 to 27.7) | |||
| Bachelor’s degree or higher | 159 | 47.0 (40.5 to 53.5) | 167 | 46.6 (40.1 to 53.1) | 76 | 23.7 (18.3 to 30.1) | |||
| US census region | <0.001 | <0.001 | 0.014 | ||||||
| Northeast | 106 | 37.9 (30.6 to 45.9) | 170 | 62.6 (55.0 to 69.7) | 61 | 20.0 (14.6 to 26.6) | |||
| Midwest | 192 | 43.1 (37.5 to 48.8) | 211 | 48.2 (42.4 to 54.0) | 88 | 20.6 (16.3 to 25.6) | |||
| South | 318 | 40.2 (36.0 to 44.5) | 378 | 45.9 (41.6 to 50.3) | 195 | 28.0 (24.1 to 32.2) | |||
| West | 335 | 57.2 (51.5 to 62.7) | 198 | 28.3 (23.8 to 33.4) | 171 | 29.1 (24.4 to 34.3) | |||
| Sexual orientation | 0.290 | 0.464 | 0.425 | ||||||
| Heterosexual/straight | 774 | 43.8 (40.8 to 46.9) | 785 | 44.4 (41.3 to 47.5) | 412 | 24.9 (22.4 to 27.7) | |||
| Lesbian, gay or bisexual | 71 | 50.8 (39.8 to 61.7) | 72 | 46.0 (35.3 to 57.0) | 40 | 31.3 (21.5 to 43.0) | |||
| Unspecified | 106 | 48.8 (41.0 to 56.8) | 100 | 39.2 (31.8-47.1) | 63 | 27.7 (21.3 to 35.1) | |||
| Cigarette smoking status | <0.001 | <0.001 | 0.028 | ||||||
| Current smoker | 534 | 39.4 (36.0 to 42.9) | 667 | 48.1 (44.5 to 51.6) | 296 | 23.4 (20.5 to 26.6) | |||
| Recent former smoker | 152 | 52.2 (45.1 to 59.2) | 114 | 41.2 (34.5 to 48.4) | 67 | 24.3 (18.7 to 31.0) | |||
| Long-term former smoker | 84 | 52.8 (43.5 to 62.0) | 79 | 39.2 (30.7 to 48.5) | 49 | 31.7 (23.4 to 41.4) | |||
| Never smoker | 175 | 56.6 (49.4 to 63.5) | 91 | 31.3 (24.8 to 38.6) | 99 | 33.2 (26.9 to 40.2) | |||
Flavoured e-cigarette users were allowed to report the use of more than one flavour and thus, proportions of specific flavour used may add to >100%.
p Value based on Satterthwaite-adjusted Wald χ2.
p Value not presented due to unstable estimates for one or more demographic groups.
The relative SE was ≥30% or denominator <50.
Other, Non-Hispanic includes Asian, Non-Hispanic; Native Hawaiian or Other Pacific Islander, Non-Hispanic; American Indian or Alaska Native, Non-Hispanic; Multiracial, Non-Hispanic and Other race, Non-Hispanic.
GED, general education development certificate; n, unweighted number of specific flavour users.
Table 4.
Demographic factors associated with the top three flavour types used with cigars/cigarillos/little filtered cigars in the past 30 days among past 30-day users of flavoured cigars/cigarillos/little filtered cigars, by specific flavour (n=829)
| Fruit flavour*
|
Candy, chocolate or other sweet flavour*
|
Alcohol flavour*
|
|||||||
|---|---|---|---|---|---|---|---|---|---|
| n | % (95% CI) | p Value† | n | % (95% CI) | p Value† | n | % (95% CI) | p Value† | |
| Overall | 429 | 52.4 (47.8 to 56.9) | 163 | 22.0 (18.2 to 26.4) | 96 | 14.5 (11.6 to 17.9) | |||
| Gender | 0.323 | 0.671 | 0.599 | ||||||
| Male | 299 | 51.1 (45.7 to 56.6) | 110 | 21.3 (16.9 to 26.6) | 70 | 15.1 (11.7 to 19.3) | |||
| Female | 126 | 56.2 (47.7 to 64.4) | 49 | 23.3 (16.4 to 32.0) | 25 | 13.3 (8.3 to 20.4) | |||
| Age group (years) | 0.005 | ‡ | ‡ | ||||||
| 18–24 | 128 | 61.4 (52.7 to 69.4) | 37 | 20.8 (14.6 to 28.7) | 37 | 21.9 (15.5 to 30.0) | |||
| 25–29 | 52 | 56.5 (45.2 to 67.1) | 25 | 21.5 (14.1 to 31.2) | 13 | 12.9 (7.1 to 22.3) | |||
| 30–44 | 119 | 53.7 (44.5 to 62.7) | 44 | 24.0 (16.1 to 34.2) | 22 | 12.6 (8.1 to 19.1) | |||
| 45–64 | 104 | 38.7 (31.2 to 46.8) | 46 | 22.2 (16.0 to 30.1) | 20 | 10.4 (6.0 to 17.5) | |||
| 65+ | 26 | 40.9 (26.8 to 56.6) | 11 | § | 3 | † | |||
| Race/ethnicity | <0.001 | ‡ | ‡ | ||||||
| White, Non-Hispanic | 271 | 54.1 (48.4 to 59.6) | 108 | 23.1 (18.7 to 28.3) | 53 | 14.2 (10.5 to 18.8) | |||
| Black, Non-Hispanic | 43 | 31.1 (22.4 to 41.3) | 25 | 20.3 (13.1 to 30.1) | 24 | 20.9 (13.3 to 31.2) | |||
| Hispanic | 51 | 49.4 (32.8 to 66.2) | 10 | § | 7 | § | |||
| Other, Non-Hispanic¶ | 58 | 70.5 (58.1 to 80.5) | 16 | § | 11 | § | |||
| Annual household income (US$) | 0.525 | 0.531 | ‡ | ||||||
| <20 000 | 70 | 49.7 (39.8 to 59.5) | 24 | 18.2 (11.9 to 26.8) | 9 | § | |||
| 20 000–49 999 | 150 | 55.1 (46.7 to 63.2) | 46 | 19.1 (12.6 to 27.8) | 25 | 11.5 (7.5 to 17.4) | |||
| 50 000–99 999 | 80 | 57.9 (47.0 to 68.0) | 35 | 25.6 (17.2 to 36.4) | 16 | 9.1 (5.2 to 15.5) | |||
| ≥100 000 | 34 | 46.9 (33.1 to 61.1) | 18 | 29.9 (18.4 to 44.7) | 12 | § | |||
| Unspecified | 95 | 48.1 (38.9 to 57.5) | 40 | 22.7 (15.3 to 32.3) | 34 | 24.5 (17.3 to 33.5) | |||
| Education | 0.656 | 0.908 | ‡ | ||||||
| Less than high School | 62 | 54.5 (43.1 to 65.5) | 23 | 21.6 (13.0 to 33.6) | 13 | 16.4 (9.3 to 27.4) | |||
| High school diploma/GED | 163 | 54.8 (47.0 to 62.4) | 52 | 20.6 (14.4 to 28.6) | 29 | 11.8 (8.0 to 17.1) | |||
| Some college | 138 | 50.8 (43.3 to 58.3) | 61 | 23.9 (17.9 to 31.1) | 41 | 17.9 (12.9 to 24.3) | |||
| Bachelor’s degree or higher | 59 | 45.5 (34.5 to 57.0) | 23 | 22.1 (13.6 to 33.7) | 12 | § | |||
| US census region | 0.065 | 0.196 | ‡ | ||||||
| Northeast | 44 | 40.7 (28.6 to 54.1) | 25 | 31.5 (19.5 to 46.6) | 13 | § | |||
| Midwest | 114 | 58.7 (49.6 to 67.2) | 27 | 15.2 (10.0 to 22.3) | 20 | 14.3 (8.8 to 2.4) | |||
| South | 147 | 49.1 (42.2 to 56.0) | 69 | 22.4 (17.1 to 28.8) | 43 | 14.3 (10.3 to 19.5) | |||
| West | 124 | 59.3 (48.5 to 69.3) | 42 | 23.3 (14.2 to 35.7) | 20 | 12.1 (7.5 to 19.1) | |||
| Sexual orientation | 0.306 | 0.688 | ‡ | ||||||
| Heterosexual/straight | 338 | 51.4 (46.2 to 56.6) | 129 | 22.7 (18.3 to 27.8) | 75 | 14.7 (11.4 to 18.7) | |||
| Lesbian, gay or bisexual | 35 | 63.1 (48.6 to 75.5) | 13 | 20.3 (11.4 to 33.5) | 5 | § | |||
| Unspecified | 56 | 50.8 (39.2 to 62.3) | 21 | 18.3 (10.4 to 30.2) | 16 | 18.8 (11.2 to 30.0) | |||
| Cigarette smoking status | 0.743 | ‡ | ‡ | ||||||
| Current smoker | 273 | 52.8 (47.0 to 58.6) | 97 | 21.5 (16.6 to 27.4) | 54 | 12.7 (9.4 to 17.0) | |||
| Recent former smoker | 24 | 58.1 (39.3 to 74.8) | 8 | † | 2 | § | |||
| Long-term former smoker | 43 | 45.6 (33.5 to 58.1) | 20 | 22.1 (13.3 to 34.4) | 12 | 18.8 (10.5 to 31.3) | |||
| Never smoker | 85 | 52.9 (43.0 to 62.6) | 36 | 24.2 (16.6 to 33.8) | 25 | 20.4 (13.4 to 29.8) | |||
Flavoured cigar users were allowed to report the use of more than one flavour and thus, proportions of specific flavour used may add to >100%.
p Value based on Satterthwaite-adjusted Wald χ2.
p Value not presented due to unstable estimates for one or more demographic groups.
The relative SE was ≥30% or denominator <50.
Other, Non-Hispanic includes Asian, Non-Hispanic; Native Hawaiian or Other Pacific Islander, Non-Hispanic; American Indian or Alaska Native, Non-Hispanic; Multiracial, Non-Hispanic and Other race, Non-Hispanic.
GED, general education development certificate; n, unweighted number of specific flavour users.
Among flavoured cigar users, correlates of flavour use (table 4) also varied by flavour type. Besides being more popular among younger smokers, fruit-flavoured cigar use was most prevalent among Other NH (70.5%), followed by White NH (54.1%), Hispanics (49.4%) and Black NH (31.1%). The low prevalence of alcohol-flavoured cigar use (14.5%) and of flavoured pipe use precluded bivariate analyses.
DISCUSSION
In this nationally representative sample of US adults, prevalence of past 30-day NCTP use was 14.5%, and 61.1% of past 30-day NCTP users used a flavoured NCTP. By product, the proportion of past 30-day flavoured NCTP users ranged from 25.8% for pipes to 82.3% for hookah. Consistent with studies of nationally representative adult samples,14,15,19 we found that age is inversely associated with flavoured tobacco use, with prevalence being greatest among young adults aged 18–24. This association was present across all NCTP types examined except hookah and pipes, for which estimates were unstable. These data suggest that appeal of flavoured tobacco products among younger adult users is not limited to certain tobacco products and underscore the importance of tobacco prevention and control strategies that address all forms of tobacco use, including flavoured tobacco products.
This study enhances our ability to characterise flavoured NCTP users by demographics and cigarette smoking status and also improves our understanding of NCTP use across subpopulations in the United States. We observed that flavour type use varied by NCTP type, as did associations between flavoured NCTP use and sex, race/ethnicity, sexual orientation and cigarette smoking status. Flavour types identified as most popular for smokeless tobacco and cigars were generally consistent with national sales data.9 25 26 Delnevo et al25 assessed Nielsen convenience store scanner data on smokeless tobacco sales and found that menthol/mint-flavoured smokeless tobacco comprised the vast majority of the flavoured smokeless tobacco market share. Similarly, Delnevo et al9 combined data on national convenience store cigar sales and brand level characteristics with usual cigar brand reported by cigar smokers and reported that in 2011, 49.5% of the convenience store cigar market sales comprised flavoured varieties, with fruit flavours (52.9%), sweet flavours (20.3%) and wine flavours (18.3%) comprising the majority of flavoured cigar sales; in contrast, menthol had a relatively small market share (3.4%). Consistent with the flavoured cigar market shares reported by Delnevo et al,9 fruit-flavoured, candy/sweet-flavoured and alcohol-flavoured cigars were the most popular among flavoured cigar smokers in the present analysis. In total, 12.9% of cigar smokers reported using menthol/mint-flavoured cigars, which translates to ~522 000 adult mentholated cigar smokers. Taken together, the current analysis builds on the aforementioned findings of Delnevo et al by directly assessing flavoured use and type of flavours used among users of all NCTPs. In keeping with their findings,15 flavoured cigar use was higher in women than men, younger adults and persons of nonwhite race/ethnicity.
The current analysis revealed variations in flavour type by tobacco product type. Research to identify reasons for using specific flavour type-product type combinations and to clarify how specific flavour types enhance user experience for each tobacco products may explain these variations and would improve our understanding of how specific flavour types influence tobacco use and the population health impact of flavoured tobacco use.
The present study also identified variations in flavour types by age and cigarette smoking status. The findings suggest that fruit-flavoured e-cigarettes and cigars may be particularly appealing to younger adults and never smokers, while menthol e-cigarettes are more frequently used by older adults and current and former cigarette smokers. Regarding smoking status, in this study the prevalence (1.4–2.9%) of e-cigarette, hookah, cigar and smokeless tobacco use among never smokers of cigarettes was low; however, a substantial proportion of never-cigarette users reported flavoured NCTP use, which ranged from 30.8% of cigar users to 84.8% of e-cigarette users (table 2). These findings suggest that flavoured NCTPs appeal to a wide range of tobacco users, including those who have never smoked cigarettes. Also, 78.1% of e-cigarette users who were recent former smokers and 63.2% of current cigarette smokers reported flavoured e-cigarette use, suggesting that flavoured e-cigarettes also appeal to current and former cigarette smokers. Longitudinal studies may elucidate the role of flavoured products in the trajectory of overall tobacco product use.
Cigar use was more prevalent among men compared to women; however, among cigar users, a higher proportion of women than men reported flavoured cigar use. We also found that cigar smokers with lower education and income were more likely to smoke flavoured cigars. This finding is consistent with a previous study that found those with lower education and income are more likely to smoke cigarillos and mass marketed cigars (MMC).23 We also found younger age and nonwhite, NH race/ethnicity, was associated with flavoured cigar use, which may also reflect marketing and promotional activities for little cigars and cigarillos (LCC) that have been documented in neighbourhoods that have a higher proportion of young adults and African-Americans.27,28 Future studies of flavoured cigar use in which prevalence and correlates of flavoured cigar use are assessed by cigar subtypes could provide additional insight on adult use of flavoured cigars, which in turn could inform regulatory activities.
Limitations
This study is subject to at least three limitations. First a small number of current users of hookah and pipes were excluded from the analyses of for each product (n=223) because we could not determine whether the respondent had used hookah, pipes or both in the past 30 days. Consequently, we may have underestimated prevalence of product use and flavoured product use among users of each pipe type. Second, self-reported flavour type assessment could be subject to recall bias; however, the tobacco product specific estimates align closely with available sales data.9,25 Third, the low response rate may have biased results; however, poststratification weighting minimised this bias.
CONCLUSIONS
The findings from this nationally representative survey document widespread use of flavoured NCTPs among US adult tobacco users, and a consistently higher prevalence of flavoured product use among young adult NCTP users compared with older users; fruit-flavoured and candy/chocolate/other sweet-flavoured product use was particularly common among younger adults. These findings expand current understanding of product appeal among consumers and underscore the importance of tobacco prevention and control strategies that address the diversity of tobacco product use, including flavoured tobacco products. To expand further understanding, continued monitoring of trends in flavoured tobacco use by NCTP type, flavour type and cigarette smoking status is warranted, as are longitudinal studies to further elucidate the role of flavoured products in the trajectory of overall tobacco product use.
Supplementary Material
What this paper adds.
This study provides national prevalence of flavoured product use and prevalence of specific flavour type use for hookah, e-cigarettes, smokeless tobacco, cigars and pipes. The study also describes the demographic characteristics and cigarette smoking status of users of flavoured non-cigarette tobacco products (NCTP) and of flavoured NCTP users who use specific flavour types. Findings will expand the evidence base that informs tobacco use prevention and regulatory activities in the USA.
Acknowledgments
The authors thank Dr Gabriella Anic, who independently replicated the data analysis for quality control.
Funding This work was supported by the Food and Drug Administration’s Center for Tobacco Products and the Centers for Disease Control and Prevention’s Office of Smoking and Health.
Footnotes
Contributors BKA and MGB developed the concept and design of the study. EH-H analysed the data, in consultation with MGB; MGB, EH-H, BKA and BJA interpreted the data; MGB prepared the initial manuscript; EH-H, BKA, BJA, SPF, CT and BAK critically reviewed and revised the manuscript for important intellectual content. All authors read and approved the final manuscript as submitted.
Additional material is published online only. To view please visit the journal online (http://dx.doi.org/10.1136/tobaccocontrol-2016-053373).
Disclaimer The findings and conclusions in this report are those of the authors. The information in this article is not a formal dissemination of information by either FDA or CDC and does not represent either agency’s positions or policies.
Competing interests None declared.
Ethics approval ICF International’s Institutional Review Board.
Provenance and peer review Not commissioned; externally peer reviewed.
References
- 1.US Department of Health and Human Services. The health consequences of smoking—50 years of progress: a report of the Surgeon General. Atlanta (GA): US Department of Health and Human Services, Centers for Disease Control and Prevention, National Center for Chronic Disease Prevention and Health Promotion, Office on Smoking and Health; 2014. http://www.cdc.gov/tobacco/data_statistics/sgr/50th-anniversary/index.htm (accessed 4 Aug 2016). [Google Scholar]
- 2.Jamal A, Homa DM, O’Connor E, et al. Current cigarette smoking among adults— United States, 2005–2014. MMWR Morb Mortal Wkly Rep. 2015;64:8. doi: 10.15585/mmwr.mm6444a2. https://www.cdc.gov/mmwr/preview/mmwrhtml/mm6444a2.htm (accessed 29 Apr 2016). [DOI] [PubMed] [Google Scholar]
- 3.NCHS. Chapter 8. Current smoking. In: Clark TC, Ward BW, Freeman G, et al., editors. Early release of selected estimates based on data from the January – March 2015 National Health Interview Survey. National Center for Health Statistics; 2015. pp. 52–8. http://www.cdc.gov/nchs/nhis.htm (accessed 24 May 2016) [Google Scholar]
- 4.SAMHSA Center for Behavioral Health Statistics and Quality. (HHS Publication No. SMA 15-4927, NSDUH Series H-50).Behavioral and health trends in the United States: results from the 2014 National Survey on Drug Use and Health. 2015 http://www.samhsa.gov/data (accessed 12 Jul 2016)
- 5.King BA, Patel R, Nguyen KH, et al. Trends in awareness and use of electronic cigarettes among US adults, 2010–2013. Nicotine Tob Res. 2015;17:219–27. doi: 10.1093/ntr/ntu191. [DOI] [PMC free article] [PubMed] [Google Scholar]
- 6.Morris DS, Fiala SC. Flavoured, non-cigarette tobacco for sale in the USA: an inventory analysis of Internet retailers. Tob Control. 2015;24:101–2. doi: 10.1136/tobaccocontrol-2013-051059. [DOI] [PubMed] [Google Scholar]
- 7.Zhu SH, Sun JY, Bonnevie E, et al. Four hundred and sixty brands of e-cigarettes and counting: implications for product regulation. Tob Control. 2014;23(Suppl 3):iii3–9. doi: 10.1136/tobaccocontrol-2014-051670. [DOI] [PMC free article] [PubMed] [Google Scholar]
- 8.Shiffman S, Sembower MA, Pillitteri JL, et al. The impact of flavor descriptors on nonsmoking teens’ and adult smokers’ interest in electronic cigarettes. Nicotine Tob Res. 2015;17:1255–62. doi: 10.1093/ntr/ntu333. [DOI] [PubMed] [Google Scholar]
- 9.Delnevo CD, Giovenco DP, Ambrose BK, et al. Preference for flavoured cigar brands among youth, young adults and adults in the USA. Tob Control. 2015;24:389–94. doi: 10.1136/tobaccocontrol-2013-051408. [DOI] [PMC free article] [PubMed] [Google Scholar]
- 10.Berg CJ. Preferred flavors and reasons for e-cigarette use and discontinued use among never, current, and former smokers. Int J Public Health. 2016;61:225–36. doi: 10.1007/s00038-015-0764-x. [DOI] [PMC free article] [PubMed] [Google Scholar]
- 11.Ashare RL, Hawk LW, Jr, Cummings KM, et al. Smoking expectancies for flavored and non-flavored cigarettes among college students. Addict Behav. 2007;32:1252–61. doi: 10.1016/j.addbeh.2006.08.011. [DOI] [PubMed] [Google Scholar]
- 12.Coleman BN, Johnson SE, Tessman GK, et al. “It’s not smoke. It’s not tar. It’s not 4000 chemicals. Case closed”: exploring attitudes, beliefs, and perceived social norms of e-cigarette use among adult users. Drug Alcohol Depend. 2016;159:80–5. doi: 10.1016/j.drugalcdep.2015.11.028. [DOI] [PMC free article] [PubMed] [Google Scholar]
- 13.Thrasher JF, Abad-Vivero EN, Moodie C, et al. Cigarette brands with flavour capsules in the filter: trends in use and brand perceptions among smokers in the USA, Mexico and Australia, 2012–2014. Tob Control. 2016;25:275–83. doi: 10.1136/tobaccocontrol-2014-052064. [DOI] [PMC free article] [PubMed] [Google Scholar]
- 14.Klein SM, Giovino GA, Barker DC, et al. Use of flavored cigarettes among older adolescent and adult smokers: United States, 2004–2005. Nicotine Tob Res. 2008;10:1209–14. doi: 10.1080/14622200802163159. [DOI] [PubMed] [Google Scholar]
- 15.Villanti AC, Richardson A, Vallone DM, et al. Flavored tobacco product use among US young adults. Am J Prev Med. 2013;44:388–91. doi: 10.1016/j.amepre.2012.11.031. [DOI] [PubMed] [Google Scholar]
- 16.Lawrence D, Rose A, Fagan P, et al. National patterns and correlates of mentholated cigarette use in the United States. Addiction. 2010;105(Suppl 1):13–31. doi: 10.1111/j.1360-0443.2010.03203.x. [DOI] [PubMed] [Google Scholar]
- 17.FDA. Menthol cigarettes and public health: review of the scientific evidence and recommendations. Washington (DC): Food and Drug Administration; 2011. (Tobacco Products Scientific Advisory Committee). http://www.fda.gov/downloads/AdvisoryCommittees/CommitteesMeetingMaterials/TobaccoProductsScientificAdvisoryCommittee/UCM269697.pdf (accessed 22 Oct 2015) [Google Scholar]
- 18.Corey CG, Ambrose BK, Apelberg BJ, et al. Flavored tobacco product use among middle and high school students—United States, 2014. MMWR Morb Mortal Wkly Rep. 2015;64:1066–70. doi: 10.15585/mmwr.mm6438a2. [DOI] [PubMed] [Google Scholar]
- 19.King BA, Dube SR, Tynan MA. Flavored cigar smoking among U.S. adults: findings from the 2009–2010 National Adult Tobacco Survey. Nicotine Tob Res. 2013;15:608–14. doi: 10.1093/ntr/nts178. [DOI] [PubMed] [Google Scholar]
- 20.Ambrose BK, Day HR, Rostron B, et al. Flavored tobacco product use among us youth aged 12–17 years, 2013–2014. JAMA. 2015;314:1871–3. doi: 10.1001/jama.2015.13802. [DOI] [PMC free article] [PubMed] [Google Scholar]
- 21.Regan AK, Dube SR, Arrazola R. Smokeless and flavored tobacco products in the U. S.: 2009 Styles survey results. Am J Prev Med. 2012;42:29–36. doi: 10.1016/j.amepre.2011.08.019. [DOI] [PubMed] [Google Scholar]
- 22.King BA, Tynan MA, Dube SR, et al. Flavored-little-cigar and flavored-cigarette use among U.S. middle and high school students. J Adolesc Health. 2014;54:40–6. doi: 10.1016/j.jadohealth.2013.07.033. [DOI] [PMC free article] [PubMed] [Google Scholar]
- 23.Corey CG, King BA, Coleman BN, et al. Little filtered cigar, cigarillo, and premium cigar smoking among adults—United States, 2012–2013. MMWR Morb Mortal Wkly Rep. 2014;63:650–4. [PMC free article] [PubMed] [Google Scholar]
- 24.Centers for Disease Control and Prevention. 2013–2014 National Adult Tobacco Survey Methodology Report. 2016 Jan; http://www.cdc.gov/tobacco/data_statistics/surveys/nats/pdfs/2014-methodology-report-tag508.pdf (accessed 4 Aug 2016)
- 25.Delnevo CD, Wackowski OA, Giovenco DP, et al. Examining market trends in the United States smokeless tobacco use: 2005–2011. Tob Control. 2014;23:107–12. doi: 10.1136/tobaccocontrol-2012-050739. [DOI] [PMC free article] [PubMed] [Google Scholar]
- 26.Viola AS, Giovenco DP, Miller Lo EJ, et al. A cigar by any other name would taste as sweet. Tob Control. 2016;25:605–6. doi: 10.1136/tobaccocontrol-2015-052518. [DOI] [PMC free article] [PubMed] [Google Scholar]
- 27.Cantrell J, Kreslake JM, Ganz O, et al. Marketing little cigars and cigarillos: advertising, price, and associations with neighborhood demographics. Am J Public Health. 2013;103:1902–9. doi: 10.2105/AJPH.2013.301362. [DOI] [PMC free article] [PubMed] [Google Scholar]
- 28.Kostygina G, Glantz SA, Ling PM. Tobacco industry use of flavours to recruit new users of little cigars and cigarillos. Tob Control. 2016;25:66–74. doi: 10.1136/tobaccocontrol-2014-051830. [DOI] [PMC free article] [PubMed] [Google Scholar]
Associated Data
This section collects any data citations, data availability statements, or supplementary materials included in this article.