Abstract
A Compton imaging method for medical applications that includes new energy determination and data filtering techniques has been tested using several point sources with known emission lines. Using a prototype Compton camera, a distance-of-closest approach technique has been employed to determine the initial energy of the incoming γs and to ensure the reconstructed source position is within an acceptable distance from the known γ source location. Further analysis is done by implementing a Compton line filtering technique, keeping only those interactions whose deposited energy in the first interaction matches the theoretical energy deposition predicted by the Compton equation. Using this new event filtering method, we see improvements in the full width at half maximum in the lateral profiles of γ point sources of up to 70% over standard Compton imaging methods, as well as achievable spatial resolutions in the reconstructed images of better than 2 mm. In addition, this new Compton imaging method was able to reconstruct an extended source of γ rays emitted during irradiation of a water tank with a clinical proton radiotherapy beam.
Index Terms: Compton camera, prompt gamma imaging, proton therapy
I. Introduction
Compton cameras (CCs) have been developed and used in a wide array of applications, from astronomy [1, 2] to security [3] to medicine [4–9]. In addition, there is also increasing interest in using CCs to image the prompt γ emission resulting from interactions of proton beams in tissue during proton beam radiation therapy as a means of verifying the dose delivered to the patient [10–13]. For all of these applications, images have traditionally been created by first recording the energy deposited and spatial coordinates (x, y, z) of γs that interact (Compton scatter, photoelectric absorption, or pair production) at least twice in the CC. For γs that interact twice in the CC (double scatter events) with “standard Compton imaging” the γ initial energy (E0) is determined as
| (1) |
where E1 and E2 are the energies deposited in the first and second γ interaction in the CC, respectively. For γs that interact at least three times (triple scatter events) in the CC, for standard Compton imaging E0 is determined using
| (2) |
where mec2 is the rest mass of the electron and θ2 is the second scattering angle defined as the angle between the vector, v1, defined by the positions of the first and second interactions and the vector, v2, defined by the second and third interactions in the CC [14]. Using the determined E0 of the incident γ, the initial scattering angle (θ1) is determined by
| (3) |
The emission point of the γ is then constrained to lie on a cone, known as the “cone-of-origin”, whose vertex is located at the point of first interaction in the CC, with a vertex angle of θ1, and with v1 as its central axis. This cone is then used to produce the image of the measured γ emission using either back projection or statistical image reconstruction methods.
Historically, signal-to-noise and spatial resolution of images produced using this method have been limited by the finite size of the detector pixels as well as the effects of the finite energy resolution of the CC detector components and Doppler broadening [15]. Additionally, determining E0 requires the γ to deposit its full energy (double scatter event) or to interact at least three times (triple scatter event), limiting the detector’s efficiency. In the case of medical imaging, however, the total radiotracer activity used for imaging procedures and the time available to acquire images are both limited, making detection efficiency very important. These CC limitations on detection efficiency and the accuracy of E0, combined with the limited time available to acquire the data, makes producing images with adequate signal-to-noise and spatial resolution difficult.
However, in the case of medical imaging, some information about the initial position of the γ emission may be known. For example, the location of the tumor could be known from CT images acquired in conjunction with the PET images and would be the most likely point of radiotracer γ emission (or at least the point of highest interest). Also, in the case of imaging of prompt γs during proton radiotherapy, the directional vector of a proton pencil beam used for cancer treatments would be known. Since prompt γs are only emitted where the proton beam interacts with the patient, the beam vector would be the most likely point of prompt γs created during proton radiotherapy. In fact, various methods of incorporating known information about the initial beam position and a priori guesses about the γ energy spectra as a means of improving Compton imaging have been studied [16–19].
In this paper, we describe a new event selection method for Compton imaging for instances in which information about the γ source position is known. This method consists of a combination of two data processing/filtering techniques: 1) the “Distance-of-Closest Approach” technique used to determine E0 of the γs and 2) the “Compton Line Filter” used to remove double or triple scatter events whose E1 and θ1 values do not match those predicted by the Compton scatter formula. Initial proof-of-principle studies were performed by imaging both point sources and an extended source of γs determining the improvement to spatial resolution of a prototype CC over that achievable with “standard Compton imaging” when the “Distance-of-Closest Approach” + “Compton Line” Compton (D2C) method is applied [20].
II. Description of the Polaris J Compton Imager
The prototype CC imager used for this study was the Polaris J detection system from H3D Inc. [21] shown in Fig. 1. The Polaris J contains four detector stages, each composed of an independent Polaris detection platform [22], electronically linked to form a single CC. Each detection stage contains 4 CdZnTe crystals arranged in a 2 × 2 (4 × 4 cm2) array (stages 1 and 2 with 20 mm × 15 mm × 20 mm crystals and stages 3 and 4 with 20 mm × 10 mm × 20 mm crystals) with each crystal pixelated 11 × 11 in the x and z directions on the cathode.
Figure 1.
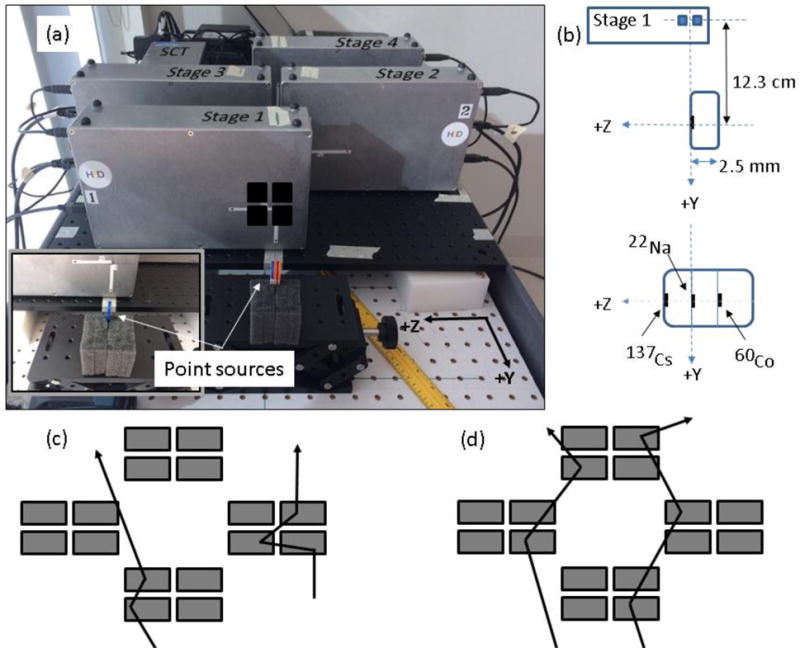
(a) The Polaris J detector setup to measure 137Cs, 22Na, and 60Co point sources placed back-to-back for simultaneous measurement of all γs. The inset shows the single source measurement setup. Black squares indicate CZT array location in the box. Detector stages 1, 2, 3, and 4 are placed at (0, −123 mm, 0), (0, −250 mm, −48 mm), (0, −250 mm, 48 mm) and (0, −377 mm, 0) respectively. (b) Schematic showing the point sources for the single source measurements and 3-point source measurement with respect to stage 1 of the CC (not drawn to scale). Also, (c) single-stage mode and (d) multi-stage mode double/triple scatter events are shown.
For Compton imaging, the Polaris J can be configured to measure γ events within each stage independently (single-stage mode) as shown in Fig. 1c, or require that multiple stages measure an event in coincidence using a synchronization-timing module (SCT) before the event is recorded (multi-stage mode) as shown in Fig. 1d. The CC’s triggering system has “double-coincidence” and “triple-coincidence” modes that record events with at least two or at least three simultaneous interactions, respectively. The data is recorded in list mode and includes the energy deposition, (x, y, z) coordinates of the interaction, and the stage in which the event occurred. In single-stage mode the stage would be the same for each recorded γ interaction, while for multi-stage mode, the stage would be different. For a more detailed description of the Polaris J detector system, refer to [23].
III. Measurements
To test the D2C Compton imaging method, measurements of γ emission from 60Co, 137Cs, and 22Na point sources were made with the Polaris J. The point sources, from Spectrum Techniques Inc. (Oak Ridge, Tennessee), are 2.5 cm diameter disk sources that are 2.5 mm thick, each with an active volume of 2 mm diameter (aligned along the y-axis, Fig. 1) by 50 μm thickness (aligned along the z-axis, Fig. 1) and an activity of 0.66 μCi, 0.93 μCi, and 0.42 μCi for 60Co, 137Cs, and 22Na respectively. Due to the size of the detector arrays in our prototype CC and the configuration of the stages, we found that the rate of double/triple scatters in a single stage is much higher than for multi-stage double/triple scatters. Therefore, to ensure adequate data could be measured in a timely manner with our low activity point sources, data was collected in single-stage/double-coincidence mode. First, separate measurements were taken with each source centered in front of the detector (z = 0 mm), as shown in Fig. 1 (inset).
Next, single-stage energy spectra measurements were made for 60Co and 137Cs sources together (positioned at z = 0 mm) in which the sum of the energy deposited for all interactions by a γ (single interactions and multiple interaction events) was recorded and saved in a histogram file with bins of 10 keV. Finally, to test the energy determination and achievable spatial resolution of the D2C method with the current CC, we carried out measurements either with each point source separately or all three point sources together placed back-to-back (shown in Fig. 1). For the 3-point source measurements, the 22Na source was centered in front of the CZT array in the first stage, while the 137Cs and 60Co sources were located at +/− 2.5 mm (see Fig. 1b), respectively with a setup uncertainty of ~1 mm.
To assess D2C imaging for extended γ sources, prompt γs (PGs) emitted during proton beam irradiation of a water phantom were performed at the Roberts Proton Therapy Center at the University of Pennsylvania. A description of the facility and proton beam irradiation conditions used for these measurements can be found in [12]. For the measurements presented in this study, 5 Gy of dose (~9 × 10⁸ protons) was delivered with a monoenergetic 150 MeV pencil beam using clinical beam currents, with the CC operating in multi-stage/double-coincidence mode. The beam delivery conditions and the experimental arrangement of the Polaris J CC stages for the beam measurements presented in this study were identical to those used in [12] (see Fig. 1 in [12]), except that the CZT array in stage 1 was at a distance of 20 cm from the central axis (z-axis described in Fig. 1) of the proton beam.
Since the CZT arrays in the Polaris J are only 4 × 4 cm2, the effective field of view of the CC is limited to only ~5 × 5 cm2 due to the CC stage configuration. Therefore, to image the entire range of the proton pencil beam in the water tank (~15 cm), three separate measurements were made with the CC. Each measurement was delivered on the same treatment gantry using a clinical treatment plan containing a single pencil beam. By delivering the beam in clinical treatment mode we could ensure the dose was delivered with an uncertainty of less than 3%, per clinical treatment guidelines. Additionally to ensure no build-up of background signal from induced positron emitters in the water phantom for each subsequent measurement, the water was drained and replaced between measurements. The first measurement was made with the stage 1 CZT array centered at z = 0 cm, the second with the CC shifted so that the stage 1 CZT array was centered at z = 4 cm, and the third with the CC shifted so that the stage 1 CZT array was centered at z = 8 cm. The results of the three measurements were combined prior to any data processing by interleaving them (using linux) to form a single list-mode text data file used for image reconstruction to simulate a CC with a 4 × 12 cm2 first stage CZT array.
We then compared images of the PG emission reconstructed using unfiltered data (“standard Compton imaging”), as well as using the D2C method (DCA + CL filtering of the data). Additionally, we compared these images to the dose delivered by the beam measured with either a PTW 34070 Bragg peak ion chamber (PTW-Freiburg, Freiburg, Germany) or EBT2 Gafchromic film (International Specialty Products, Wayne, NJ, USA).
IV. D2C Imaging Method
The D2C imaging method requires two separate steps to post-process the measured CC data prior to image reconstruction. These two steps are the:
distance-of-closest approach (DCA) processing and,
Compton line filtering,
which are both described below. A glossary of terms used to describe the DCA processing and CL filtering methods is provided in the online Supplemental Materials for this paper.
A. Distance-of-Closest Approach Processing
The DCA is defined as the shortest distance between the source position and the cone-of-origin surface [15, 24]. In previous applications [15, 24], DCA has been used as a metric to understand how the physical characteristics of a CC affect characteristics of a detected γ cone-of-origin, and how these effects impact image reconstruction. In this work DCA is used to process the measured data in two different ways. First, a novel DCA based energy determination method is used to calculate the initial energy (E0) of the incoming γ, and then DCA filtering is used to ensure cones-of-origin are within a predefined distance of the known source location.
DCA filtering can be used in the reconstruction of images of extended (line) sources as well as point sources. In the case of an extended line source, we must calculate the shortest distance between the cone-of-origin and the central axis of the line source. A full definition and derivation of the extended source DCA can also be found in the online Supplemental Materials for this paper.
1) DCA Energy Determination
To calculate the initial energy (E0) of the incoming γ using DCA, information about the energy deposited in the first scatter, coordinates of the first and second scatters, and an estimate (initial guess) of the initial energy (Ei) are needed. Using these values, the shortest distance between the source and a test cone-of-origin produced using Ei is calculated according to
| (5) |
In some cases the initial energy of the incoming γ will be known (e.g. 511 keV from PET radiotracers). In these instances, the known E0 is chosen for Ei and the DCA is calculated. In other cases, however, E0 may need to be determined. This may be because: 1) multiple distinct emission energies are possible (e.g. 60Co or prompt γ emission during proton beam radiotherapy [25,26]), or 2) the energy is completely unknown. For these two cases, the γ initial energy is determined as:
Case 1: multiple distinct emission energies are possible. The DCA is calculated for each possible emission line (by setting Ei in (5) equal to the known emission values), and the emission line with the smallest DCA is chosen as (the DCA determined initial energy), which we assign as E0 for the γ.
Case 2: the initial energy is completely unknown. The DCA can be calculated over a range of Ei values in increments of ΔEi (with both values being initial input parameters chosen by the user). The Ei value that gives the minimum DCA in the tested energy range is then chosen as and assigned as the γ E0.
In this initial feasibility study, for both Case 1 and Case 2, the E0 values were tested from lowest energy to highest energy. In the event that a cone was found to intersect the source position or the axis of the extended source (DCA = 0), this energy was chosen as E0. The DCA energy determination was stopped at this point and any higher emission energies were not tested for that γ scatter event.
To ensure the DCA method was able to correctly determine E0, we studied the simultaneous measurement of the 60Co and 137Cs point sources. Assuming the DCA correction was working as expected, the individual spectral lines from both sources should appear in the DCA determined spectrum of the combined data file for both Case 1 and Case 2. Since 60Co has lines at 1.17 and 1.33 MeV, and 137Cs has a line at 662 keV, we first used these three energy lines as Ei energy values for Case 1 to determine for each double/triple scattered γ. Next, the DCA was calculated using Case 2 for a range of γ energies from 0 to 1.5 MeV in increments of ΔE= 10 keV for determination of . Fig. 2 shows the resulting filtered spectrum from the 60Co/137Cs measurement data for Case 1 and Case 2 energy determination methods, compared with the measured spectrum from the CC. Both cases of the DCA method are able to identify the spectral lines present in the data, with an eliminated (i.e. Case 1) or greatly reduced (i.e. Case 2) background at low energies.
Figure 2.
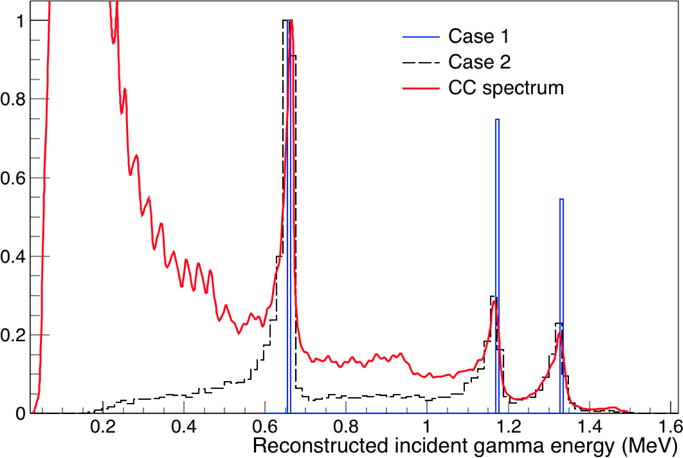
Combined 60Co/137Cs point source energy spectra from Compton camera compared to the spectrum determined using DCA energy determination.
2) DCA Filter
Once E0 for each γ is determined, a “DCA-filter” is applied to the data. The filter is used as a means of removing coincident γ events from the data whose cones do not come within a predefined distance of the source position. Since these cones do not intersect or lie in close proximity to the known source position, we surmise that they will only contribute noise to the final image, and therefore we wish to remove them from the data used for image reconstruction.
3) Compton Line Filtering
Following the determination of E0 and application of the DCA filter, “bad” scattering events (i.e. those not from double/triple scatter γs) can be further removed from the data using a Compton Line (CL) filter. Equation (3) can be rearranged to give the well-known Compton relation for the energy deposited in the first scatter (E1) as a function of scatter angle (θ1),
| (6) |
where α = E0/mec2. If E0 is known, then the theoretical value of E1 can be determined for a given θ1. Fig. 3a shows the measured E1 values versus the calculated scattering angle (θ1) for the case in which Eo was calculated in the Standard Compton imaging manner using equation (1) or (2) for the raw 60Co point source data, along with the theoretical CLs calculated with (6) for Eo = 1.17 MeV and 1.33 MeV γs. Two distinct bands of data can be seen in the measured data around the theoretical CLs. We identify the data points that lie within these bands as “good scatter events” that we wish to use for our image reconstruction, since they correspond to the theoretical predictions of the Compton scattering equation (6).
Figure 3.
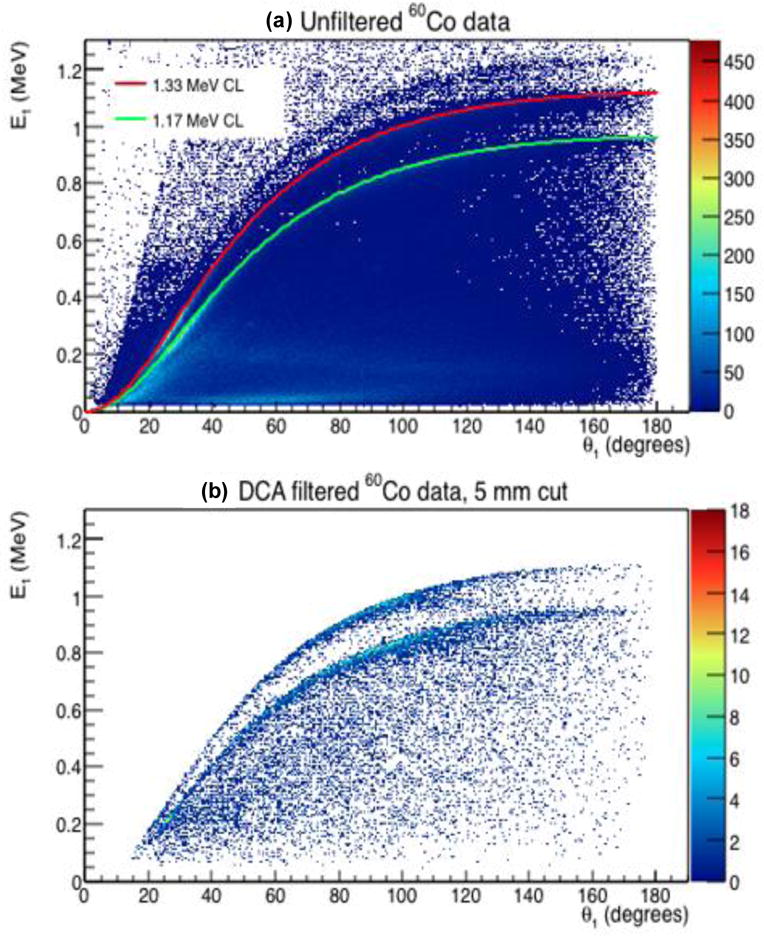
(a) Energy deposited in the first Compton interaction (E1) as a function of first scattering angle (θ1) for the raw (unfiltered) 60Co double scatter data. Both CLs are visible in the distribution. The theoretical CLs (calculated using (6)) for Eo = 1.17 MeV (green line) and 1.33 MeV (red line) γs are displayed. (b) E1 as a function of the scattering angle (θ1) for DCA filtered 60Co double scatter data.
Additionally, as seen in Fig. 3b, DCA filtering acts to remove most of the data that does not lie along the Compton lines, indicating that the data along these lines account for most of the γ events whose cones-of-origin lie closest to the source position. For larger DCA-filter limits, more cones were accepted for reconstruction. However these cones could be further from the source and result in more noise in the final image. If, on the other hand, the DCA-filter was too small, too few events were kept to allow reconstruction of a meaningful image. A DCA-filter of 5 mm was chosen for the point source studies because it gave the best balance between noise reduction and accepting an adequate number of events compared to other values tested (20 mm, 15 mm, 10 mm, and 2 mm). A further study of the images as a function of DCA filter size can be seen in the online Supplemental Materials. For the extended source studies, a value of DCA =1 cm (which corresponds to the 1-sigma width of the proton beam) was used for filtering.
For CL filtering of each γ, we test if the measured E1 for a given θ1 falls within a preset range around the theoretical value predicted by (6) by using its DCA determined E0 (see Section IV-A1) and θ1 (from (3)). This CL filter can then be described by the relationship
| (7a) |
| (7b) |
where CL+ and CL− are the upper and lower limits of the filter expressed in percentage above or below the theoretical E1 which is acceptable. For CL filtering, if the measured E1 value for a γ satisfies the relationships of (7a) and (7b) for the pre-determined CL+ and CL− limits, then the measured γ is kept and used for image reconstruction. If not, it is removed from the data used for reconstruction. Fig. 4a shows the E1 vs θ1 plot for the measured 60Co data after CL filtering. For both the point and extended source studies, we found that a CL+ = 1.04 (4% above the theoretical E1 value) and CL− = 0.9 (10% below the theoretical E1 value) provided the best results for image reconstruction (see online Supplemental Materials).
Figure 4.
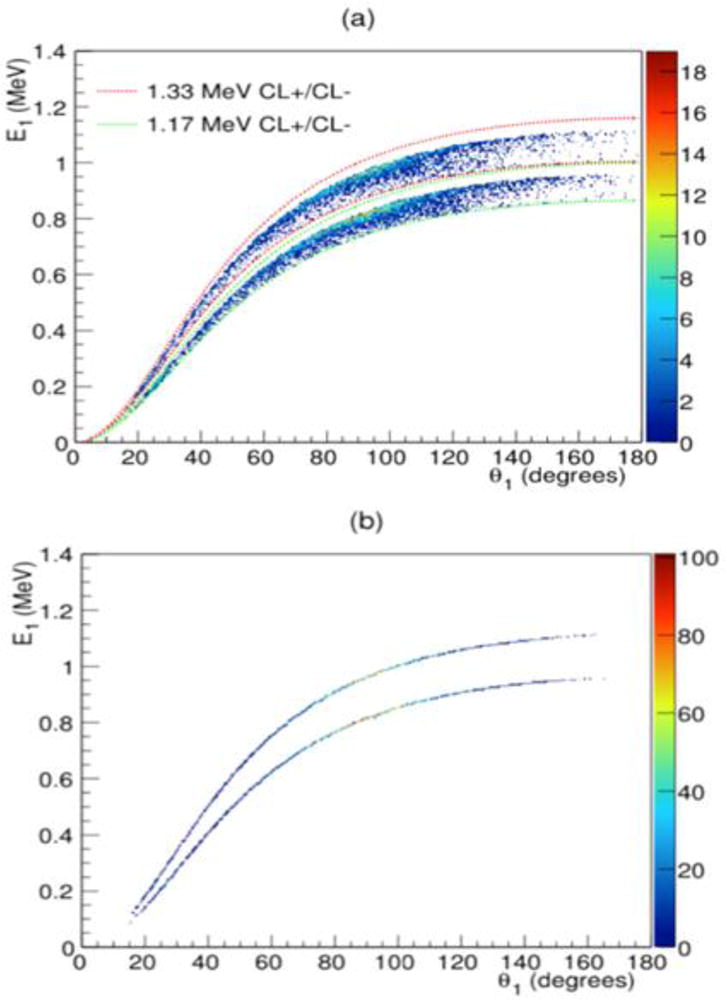
(a) Energy deposited in the first Compton interaction (E1) as a function of θ1 for D2C 60Co double scatter data with CL+ and CL− lines for the 1.17 MeV (green dashed line) and 1.33 MeV (red dashed line) emission lines shown. (b) E1 vs θ1 for final D2C data.
B. Reconstruction
Following DCA processing and CL filtering, one final correction was applied to the data to ensure the reconstruction software would identify the γ energy determined using DCA. In standard Compton imaging, the incident γ energy is determined using (1) for double scatter events or (2) for triple scatter events. Because the image reconstruction software we used to produce the final images uses (1) and (2) to determine the energy of the incident γ, for the D2C method, we must adjust the measured value of either E1 or E2 to ensure the energy calculated by the software matches that calculated using DCA. Since E1 is also used to calculate the scattering angle (see (3)), we could not alter it and therefore the measured E2 value is corrected prior to image reconstruction.
The correction we developed for E2 allows us to correct the energy detected back to the theoretical CL, shown in Fig. 4b. First, DCA processing is used to calculate the expected energy ( ) as described in Section IV-A1. Next, for double scatter events, the E2 is “corrected” by ensuring
| (8) |
A similar correction can also be made for triple scatter events, where
| (9) |
where is the initial γ energy from the DCA energy determination method, and θ2 is the second scattering angle as defined for (3). These two corrections ensure that the reconstruction software will correctly identify the energy of the incoming γ calculated using DCA.
After applying the energy correction, we reconstruct the data using a variation of the SOE algorithm [27–29], although any Compton imaging reconstruction algorithm (backprojection or statistical) could be used in principle.
V. Imaging Results
A. Point Source Imaging
Using the value of the source activity and the duration of the measurement, we estimated a raw (total number of events) double/triple scatter detection efficiency of 4.6 × 10⁻⁴ per emitted γ for the 60Co source (see online Supplemental Materials for full details). From the raw events, a total of 368,321 were found to have a cone-of-origin that intersected with the reconstruction volume, and thus were accepted by the software for reconstruction. Events rejected by the reconstruction software are believed to be mostly due to simultaneous detection of two separate γs and are thus not true double/triple scatter events of a single γ. Of these, 25,708, 97,188, and 6,203 events were used for the DCA filtered, CL filtered, and full D2C data reconstructions. From these numbers we estimate an efficiency of detecting double/triple scatters (both the 1.17 MeV and 1.33 MeV γs) used for reconstruction to be 1.4 × 10⁻⁴ per emitted γ for the unfiltered data and 9.7 × 10⁻⁶, 3.7 × 10⁻⁵, and 2.3 × 10⁻⁶ per emitted γ for the DCA, CL, and D2C filtered data respectively. For the 22Na source (both 511 keV and 1.224 MeV γs) the efficiencies for detecting reconstructable events were 6.6 × 10⁻⁴, 1.1 × 10⁻⁵, 1.1 × 10⁻⁵, and 1.8 × 10⁻⁶ per emitted γ, and for the 137Cs source 2.2 × 10⁻⁴, 3.5 × 10⁻⁶, 7.4 × 10⁻⁵, and 1.5 × 10⁻⁶ for the unfiltered, DCA, CL, and D2C filtered data respectively.
To demonstrate the effects of each step in the D2C process, Fig. 5 shows 2D projection images reconstructed using unfiltered data [“standard Compton imaging”] (a and e), DCA filtered data using Case 1 (b and f), CL filtered data (c and g), and full D2C (DCA+CL filtered) data (d and h) for the centered 60Co source (both 1.17 MeV and 1.33 MeV γs used). As seen in Fig. 5, the source position is properly located in the XZ plane for unfiltered data and for all steps in the D2C method. However, the source location in the YZ plane is only properly reconstructed with the full D2C method (DCA + CL filtering). We believe the large number of γs in the unfiltered data caused the failure of the reconstructions in the YZ plane. Since the detector array in the CC first stage (where ~95% of usable γs first scatter) is only 4 × 4 cm2, the cones-of-origin for the unfiltered data are very densely clustered as they come to an apex in the CCs first stage. The SOE algorithm used for image reconstruction will produce an estimation of the number of measured γ emissions in each voxel of the reconstruction volume that is maximum in the region that the cones-of-origin most densely overlap, resulting in a final image that is pushed toward the CC first stage (+y-direction boundary of the reconstruction volume). When the full D2C filtering is applied, many of the events that were not due to a “good” γ scatter were removed, and the highest density of cone-of-origin overlap in the reconstruction volume then is shifted to the source location, were the final image now forms.
Figure 5.
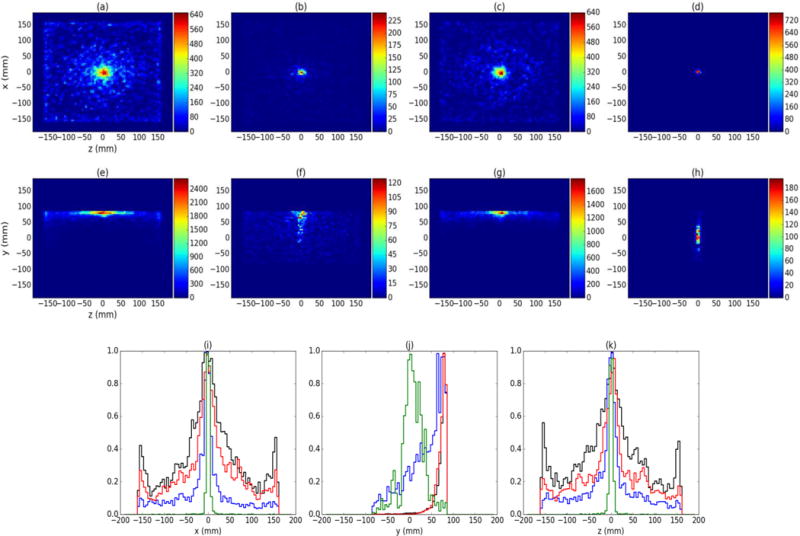
(a), (b), (c), and (d) show 2D (XZ) planar projections for the centered 60Co source for unfiltered, DCA filtered, CL filtered, and D2C data, respectively. (e), (f), (g), and (h) depict 2D planar projections in the YZ plane for the same data. (i) shows the x profiles of each data set, (j) shows the y profiles for each data set, and (k) shows the z profiles for each data set. Unfiltered data is shown in black, DCA filtered data is shown in blue, CL filtered data is shown in red, and D2C data is shown in green.
Even with the reduced number of events, image quality is greatly improved using the full D2C method with the image noise greatly reduced. To demonstrate this, we determined the full width at half maximum (FWHM) for each scenario by plotting 1D profiles, taken along each axis as shown in Fig. 5i, 5j, and 5k, and fitting Gaussians to them. Table 1 shows the results of these fits for the 60Co source, as well as the 22Na (511 keV and 1.227 MeV γs) and 137Cs (662 keV γs) sources for five separate measurements with each source. The D2C technique gives the smallest FWHM in the x and z directions, with improvements of 71% and 67% observed in the x and z directions for the 60Co source. Similar improvements are also seen with the other two point sources.
Table 1.
FWHM in x and z for all point sources studied.
| FWHM X (mm) | FWHM Z (mm) | |
|---|---|---|
| Unfiltered 60Co | 49.5 ± 2.9 | 49.2 ± 0.9 |
| CL 60Co | 37.5 ± 6.0 | 40.0 ± 3.0 |
| DCA 60Co | 28.2 ± 2.7 | 25.8 ± 3.0 |
| D2C 60Co | 14.6 ± 0.3 | 16.0 ± 2.2 |
| Unfiltered 22Na | 42.2 ± 5.6 | 43.7 ± 2.9 |
| CL 22Na | 36.8 ± 3.1 | 43.3 ± 4.6 |
| DCA 22Na | 19.6 ± 3.4 | 19.6 ± 4.4 |
| D2C 22Na | 11.6 ± 1.2 | 15.0 ± 1.7 |
| Unfiltered 137Cs | 63.1 ± 4.7 | 59.1 ± 2.0 |
| CL 137Cs | 41.0 ± 3.4 | 50.1 ± 6.8 |
| DCA 137Cs | 14.4 ± 2.4 | 20.2 ± 4.1 |
| D2C 137Cs | 12.7 ± 1.7 | 15.9 ± 1.1 |
To test the achievable resolution, we analyzed the simultaneous measurements of all 3 point sources. The effect of each filtering step of the D2C process on the measured three point source data is shown in Fig. 6. In the unfiltered data, the CL lines from the 511 keV and 662 keV γs are visible at all scatter angles. The higher energy lines (1.17 MeV, 1.227 MeV, and 1.33 MeV) are only visible at lower angles, as they are masked by the background caused by events not correlated to a true Compton double/triple scatter event. In the DCA filtered data (DCA = 5 mm) all the CLs are visible with the 1.227 MeV line being the weakest, which is not unexpected since the 22Na source (0.43 μCi) is the weakest of the three point sources. After CL filtering and D2C energy correction, the CL lines from the 5 selected γs are used for image reconstruction.
Figure 6.
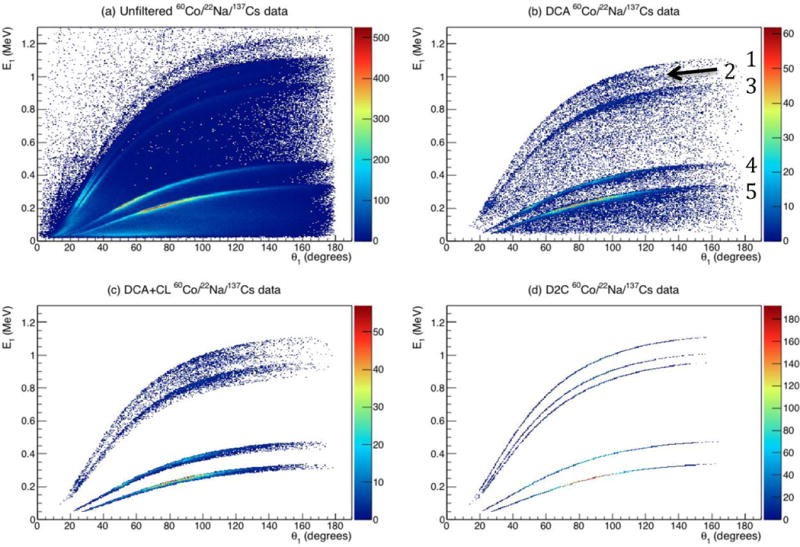
Measured E1 values vs calculated θ1 for (a) unfiltered three point source data and (b) DCA filtered, (c) DCA + CL filtered, and (d) full D2C filtering with energy correction. The CL lines from the (1) 1.33 MeV, (2) 1.227 MeV, (3) 1.17 MeV, (4) 662 keV, and (5) 511 keV γs from the 60Co, 22Na, and 137Cs sources are visible in the DCA, DCA+CL, and fill D2C filtered data.
Figure 7a and 7c show the 2D XZ and YZ planar projections for reconstructions of the unfiltered data, while 7b and 7d show the 2D XZ and YZ planar projections for reconstructions of the D2C data (using the same emission lines used for the individual source reconstructions). For the unfiltered data, the source location is only reconstructed correctly in the XZ plane, and the positions of the individual sources cannot be identified in the images. However, the individual sources are visible in both the XZ and YZ projections for the D2C data. From the D2C data, the sources were reconstructed at −3.3 mm, −0.8 mm, and 1.8 mm in z. The peaks of the sources were also separated by 2.5 mm, as expected based on source arrangement. These positions indicate a −0.8 mm offset from the expected position of each peak, which is very possible due to the 1 mm uncertainty in our ability to position the sources with respect to the center of the CZT array in CC stage 1.
Figure 7.
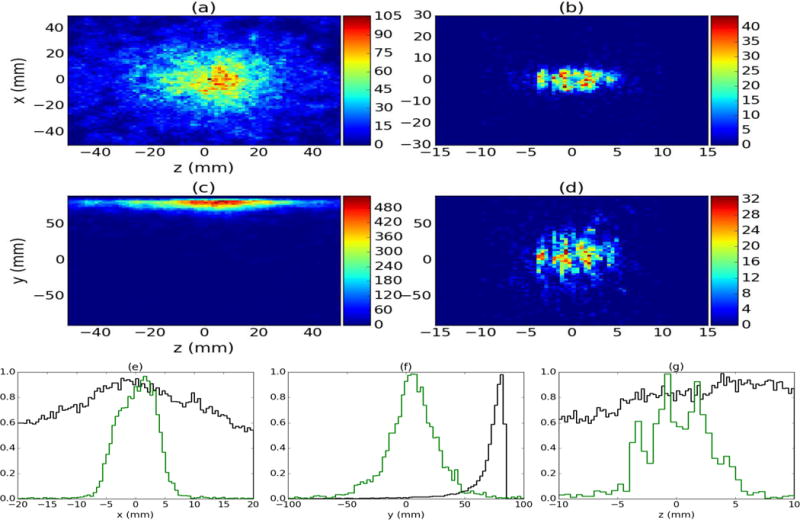
(a) and (c) show unfiltered 2D XZ and YZ reconstructions of the 60Co, 22Na, and 137Cs point sources placed at −2.5 mm, 0 mm, and +2.5 mm in z, respectively. (b) and (d) show D2C reconstructions in XZ and YZ for these same source. X (e), y (f), and z (g) profiles are shown for the unfiltered (black) and D2C (green) data.
B. Extended Source Imaging
Figure 8 shows the measured E1 values as a function of the calculated scatter angle for the extended source of PGs emitted during proton beam irradiation. No distinct Compton lines can be seen in the unfiltered data. We believe this is due to the high multi-stage count rate (~4000 per second) during irradiation, which overwhelmingly results in two (or more) separate PGs being detected simultaneously and being recorded by the CC as a coincidence event. The large number of these “bad” simultaneous detection events results in noise in the data, which mask the CL lines in Fig. 8.
Figure 8.
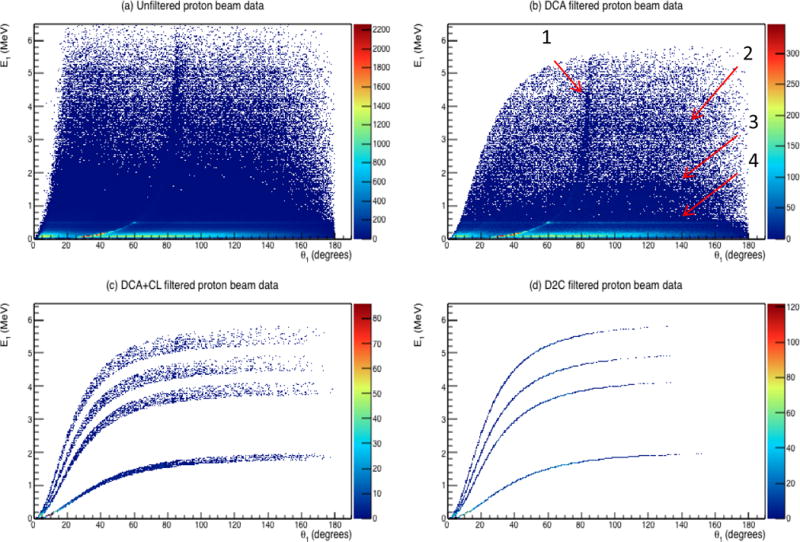
Measured E1 values versus calculated θ1 for (a) unfiltered PG data measured during proton irradiation along with (b) data filtered with DCA =1 cm, (c) CL filtered with +4%/−10% around each PG emission line, and the full energy corrected D2C data. Shown are (1) events due to the simultaneous PG Compton scatter and 511 keV γ photoelectric absorption, (2) events due to pair production interactions of 4.44 MeV PGs, (3) tiie CL for 2.2 MeV PGs, and (4) the interaction of 511 keV γs.
Previous studies have shown that specific γ emission lines from hydrogen-neutron capture, carbon, and oxygen are strongly correlated to the proton depth dose distribution and produce the best results for PG imaging [26, 30]. Therefore, in this feasibility study we used characteristic emission lines 2.2 MeV, from hydrogen-neutron capture, and 4.44 MeV, 5.2 MeV, and 6.12 MeV from proton scatters with oxygen nuclei [26, 30] along with Case 1 of the DCA-Energy determination technique.
When the DCA filter (DCA = 1 cm) is applied, many of the bad events are removed from the data and several features appear in the plot. This includes the CL correlating to the 2.2 MeV PG emission from hydrogen-neutron capture events. Also, a line at 511 keV across all scatter angles arising from the photoelectric absorption of positron annihilation γs emitted from the water tank (as E1) and a simultaneous interaction of a second γ (E2). A second type of event involving positron annihilation γs can be seen as a line starting at ~30°, intersecting 511 keV at ~60°, and asymptotically rising toward 90°. This line represents events in which a PG Compton scattered (E1) and a 511 keV γ was detected simultaneously (E2). Finally, a line at a fixed energy of ~3.4 MeV across all angles can be seen, which represents a pair production event of a 4.44 MeV PG (E1 = 4.44 – 1.022 MeV) detected simultaneously with another γ (E2). Since these last three types of interactions do not involve true coincident Compton scatters, they do not have the shape of an expected Compton line. As a final step, the CL filters are applied for the 2.2 MeV, 4.4 MeV, 5.2 MeV, and 6.1 MeV PGs and the energy correction applied to complete the D2C filtering process as shown in Fig. 8c–d.
Figure 9 shows 2D projection images using reconstructed unfiltered data (a and d) compared to a 2D projection image reconstructed using D2C data (b and e). For the measurement, 1.6 million double/triple scatter events were recorded by the CC. After full D2C filtering 4309 events remained in the measured data giving a PG measurement rate of ~1.7 × 10⁻³ events/proton and ~4.8 × 10⁻⁶ events/proton for the unfiltered and D2C data, respectively. Using unfiltered data (i.e. standard CC imaging), the range and shape of the proton beam is not easily discernible. However, with D2C, the direction and range of the beam is discernible in the images and the width in the x-direction better matches the measured lateral profiles (Fig 9c). Next we also looked at the 1D depth profiles of the beam for unfiltered data compared to the D2C data (Fig. 9f). The profile in depth obtained using the D2C data (green) shows much better correlation with the ion chamber depth dose measurement (black) than the unfiltered data profile (blue).
Figure 9.
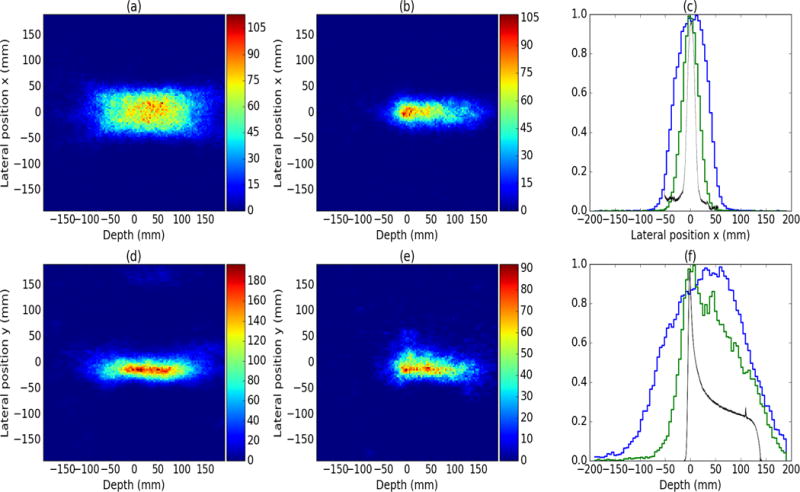
2D reconstructions of a 150 MeV proton pencil beam incident on a water phantom for standard Compton imaging with a 4 × 12 cm2 CC (a and d) as well as the D2C reconstructions with a 4 × 12 cm2 CC (b and e). (c) and (f) show the 1D depth profiles for the standard Compton data (green) and the D2C data (blue) compared to ion chamber measurement (black).
VI. Discussion and Conclusions
The D2C method for CC imaging represents a novel way to filter “bad” scatter events from the measured data that most likely did not originate from an actual double/triple γ scatter event in the CC. D2C filtering is applied before final reconstruction, and therefore any reconstruction algorithm could be used to produce the final images. Additionally, D2C retains the ability to reconstruct images in 3 spatial dimensions without becoming unwieldy in contrast to other methods [16, 17, 19], and can even produce “energy-windowed” images (if only one γ energy is chosen for D2C filtering).
The relative ease of implementation of D2C, we believe, lends it to a range of applications in medical imaging. In the case of in-vivo imaging of PGs during proton radiotherapy, this work shows that by using only “good” double/triple scatter γ interactions (identified with D2C), images of extended line sources can be reconstructed with many fewer events than previously reported [12,16].
For proton radiotherapy, this potentially reduces the PG measurement rate requirements and/or the total dose (i.e number of protons) required for Compton camera based PG imaging, which is an extremely important step for making Compton imaging an in vivo viable method.
Future work will be focused on further studies and analysis for improving the efficiency of “good” event measurement with subsequent CC designs and to improve the D2C method to allow high resolution images needed to detect small proton beam range shifts (≤ 2 mm), as well as study its potential for PET and other Nuclear Imaging applications.
Supplementary Material
Contributor Information
E. Draeger, Department of Radiation Oncology, University of Maryland School of Medicine, 22 South Greene St., Baltimore, MD USA
S. Peterson, Department of Physics, University of Cape Town, Rondebosch 7700, South Africa
D. Mackin, Department of Radiation Physics, University of Texas MD Anderson Cancer Center, 1515 Holcombe Blvd., Houston, TX USA
H. Chen, Department of Radiation Oncology, University of Maryland School of Medicine, 22 South Greene St., Baltimore, MD USA
S. Beddar, Department of Radiation Physics, University of Texas MD Anderson Cancer Center, 1515 Holcombe Blvd., Houston, TX USA, and The University of Texas Graduate School of Biomedical Science at Houston, Houston, TX USA
JC. Polf, Department of Radiation Oncology, University of Maryland School of Medicine, 22 South Greene St., Baltimore, MD 21201 USA
References
- 1.Aprile A, Curioni A, Giboni K, Kobayashi M, Oberlack U, Zhang S. Compton Imaging of MeV Gamma Rays with Liquid Xenon Gamma Ray Imaging Telescope (LXeGRIT) Nucl Instr Meth A. 2008;593:414–425. [Google Scholar]
- 2.Herbert TJ. Estimating the Sky Map in Gamma-Ray Astronomy with a Compton Telescope. IEEE Trans Nucl Sci. 1991;38:536–542. [Google Scholar]
- 3.Saull P, Sinclair L, Seywerd H, Hanna D, Boyle P, MacLeod A. First demonstration of a Compton gamma imager based on silicon photomultipliers. Nucl Instr Meth A. 2012;679:89–96. [Google Scholar]
- 4.Andreyev A, Stick A, Celler A. Reconstructed image spatial resolution of multiple coincidences Compton imager. IEEE T Nucl Sci. 2010;57:151–159. [Google Scholar]
- 5.Vernekohl D, Ahmad M, Chinn G, Xing L. Feasibility study of Compton cameras for x-ray fluorescence computed tomography with humans. Phys Med Biol. 2016;61:8521–8540. doi: 10.1088/0031-9155/61/24/8521. [DOI] [PMC free article] [PubMed] [Google Scholar]
- 6.Mundy D, Herman M. Uncertainty analysis of a Compton camera imaging system for radiation therapy dose reconstruction. Med Phys. 2010;37:2341–2350. doi: 10.1118/1.3399777. [DOI] [PubMed] [Google Scholar]
- 7.Cree M, Bones P. Towards direct reconstruction from a gamma camera based on Compton scattering. IEEE T Med Imaging. 1994;13:398–407. doi: 10.1109/42.293932. [DOI] [PubMed] [Google Scholar]
- 8.Thirolf P, Lang C, Parodi K. Perspectives for Highly-Sensitive PET-Based Medical Imaging Using B+γ Coincidences. Symposium on Positron Emission Tomography ACTA PHYSICA POLONICA A Krakow, Poland. 2004:1441–1445. [Google Scholar]
- 9.Singh M. An electronically collimated gamma camera for single photon emission computed tomography Part I: theoretical considerations and design criteria. Med Phys. 1983;10:421–427. doi: 10.1118/1.595313. [DOI] [PubMed] [Google Scholar]
- 10.Frandes M, Zoglauer A, Maxim V, Prost R. A tracking Compton-scattering imaging system for hadron therapy monitoring. Med Phys. 2012;39:1001–1005. [Google Scholar]
- 11.Kormoll T, Fiedler F, Schone S, Wustemann J, Zuber K, Enghardt W. A Compton imager for in vivo dosimetry for proton beams - a design study. Nucl Instr Meth A. 2011;626–627:114–119. [Google Scholar]
- 12.Polf JC, Avery S, Mackin D, Beddar S. Imaging of prompt γs emitted during delivery of clinical proton beams with a Compton camera: feasibility studies for range verification. Phys Med Biol. 2015;16:7085–7099. doi: 10.1088/0031-9155/60/18/7085. [DOI] [PubMed] [Google Scholar]
- 13.Hueso-Gonzalez F, Golnik C, Berthel M, Dreyer A, Enghardt W, Fiedler F, Heidel K, Kormoll T, Rohling H, Schone S, Schwengner R, Wagner A, Pausch G. Test of Compton camera components for prompt gamma imaging at the ELBE bremsstrahlung beam. J Instrum. 2014;9:P05002. [Google Scholar]
- 14.Kroeger R, Johnson W, Kurfess J, Philips B, Wulf E. Three-Compton telescope: theory, simulations, and performance. IEEE T Nucl Sci. 2002;49:1887–92. [Google Scholar]
- 15.Mackin D, Polf J, Peterson S, Beddar S. The effects of Doppler broadening and detector resolution on the performance of three-stage Compton cameras. Med Phys. 2013;40:012402. doi: 10.1118/1.4767756. [DOI] [PMC free article] [PubMed] [Google Scholar]
- 16.Gillam JE, Lacasta C, Torres-Espallardo I, Juan C Candela, Llosa G, Solevi P, Barrio J, Rafecas M. A Compton imaging algorithm for on-line monitoring in hadron therapy. Proc SPIE 7961, Medical Imaging 2011: Physics of Medical Imaging 2011 [Google Scholar]
- 17.Gillam JE, Torres-Espallardo I, Lacasta C, Llosa G, Barrio J, Stankova V, Solaz C, Rafecas M. Nuclear Science Symposium and Medical Imaging Conference (NSS/MIC) IEEE; 2011. Hodoscope coincidence imaging for hadron therapy using a Compton camera. [DOI] [Google Scholar]
- 18.Xu D, He Z. Gamma-ray energy-imaging integrated spectral deconvolution. Nucl Instr Meth A. 2007;574:98–109. [Google Scholar]
- 19.Richard MH, Chevallier M, Dauvergne D, Freud N, Henriquet P, Le Foulher F, Letang JM, Montarou G, Ray C, Roellinghoff E, Testa E, Testa M, Walenta AH. Design Guidelines for a Double Scattering Compton Camera for Prompt Imaging During Ion Beam Therapy: A Monte Carlo Simulation Study. IEEE T Nucl Sci. 2011;58:87–94. [Google Scholar]
- 20.Polf JC, Draeger E, Peterson S, Mackin D, Beddar S. Techniques for producing an image of radioactive emissions using a Compton camera. US, International Patent Appl PCT/U S2017/021340. Filed March 8, 2017. [Google Scholar]
- 21.H3D inc., 3250 Plymouth Rd, Suite 202, Ann Arbor MI 48105 http://www.h3dgamma.com/.
- 22.Zhang F, He Z, Seifert C. A Prototype Three-Dimensional Position Sensitive CdZnTe Detector Array. IEEE T Nucl Sci. 2007;NS-54(4):843. [Google Scholar]
- 23.McCleskey M, Kaye W, Mackin D, Beddar S, He Z, Polf J. Evaluation of a multistage CdZnTe Compton Camera for prompt gamma imaging for proton therapy. Nucl Instr Meth A. 2015;785:163–169. [Google Scholar]
- 24.Wilderman SJ, Rogers WL, Knoll GF, Engdahl JC. MonteCarlo calculation of point-spread functions of Compton scatter cameras. IEEE T Nucl Sci. 1997;44:250–254. [Google Scholar]
- 25.Polf JC, Peterson S, McCleskey M, Roeder BT, Spiridon A, Beddar S, Trache L. Measurement and calculation of characteristic prompt gamma ray spectra emitted during proton irradiation. Phys Med Biol. 2009;54:N519–N527. doi: 10.1088/0031-9155/54/22/N02. [DOI] [PubMed] [Google Scholar]
- 26.Verburg J, Seco J. Proton range verification through prompt gamma-ray spectroscopy. Phys Med Biol. 2014;59:7089–106. doi: 10.1088/0031-9155/59/23/7089. [DOI] [PubMed] [Google Scholar]
- 27.Mackin D, Peterson S, Beddar S, Polf JC. Evaluation of a stochastic reconstruction algorithm for use in a Compton camera imaging and beam range verification from secondary gamma emission during proton therapy. Phys Med Biol. 2012;57(11):3537. doi: 10.1088/0031-9155/57/11/3537. [DOI] [PMC free article] [PubMed] [Google Scholar]
- 28.Andreyev A, Sitek A, Celler A. Fast image reconstruction for Compton camera using stochastic origin ensemble approach. Med Phys. 2011;38:429–435. doi: 10.1118/1.3528170. [DOI] [PubMed] [Google Scholar]
- 29.Sitek A. Representation of photon limited data in emission tomography using origin ensembles. Phys Med Biol. 2008;53:3201–3216. doi: 10.1088/0031-9155/53/12/009. [DOI] [PMC free article] [PubMed] [Google Scholar]
- 30.Hilaire E, Sarrut D, Peyrin F, Maxim V. Proton therapy monitoring by Compton imaging: influence of the large energy spectrum of the prompt-gamma radiation. Phys Med Biol. 2016;61:3127–3146. doi: 10.1088/0031-9155/61/8/3127. [DOI] [PubMed] [Google Scholar]
Associated Data
This section collects any data citations, data availability statements, or supplementary materials included in this article.


