

Abstract
Huntington’s disease (HD) is caused by a mutation in the huntingtin gene (HTT), resulting in profound striatal neurodegeneration through an unknown mechanism. Perturbations in the urea cycle have been reported in HD models and in HD patient blood and brain. In neurons, arginase is a central urea cycle enzyme, and the metal manganese (Mn) is an essential cofactor. Deficient biological responses to Mn, and reduced Mn accumulation have been observed in HD striatal mouse and cell models. Here we report in vivo and ex vivo evidence of a urea cycle metabolic phenotype in a prodromal HD mouse model. Further, either in vivo or in vitro Mn supplementation reverses the urea-cycle pathology by restoring arginase activity. We show that Arginase 2 (ARG2) is the arginase enzyme present in these mouse brain models, with ARG2 protein levels directly increased by Mn exposure. ARG2 protein is not reduced in the prodromal stage, though enzyme activity is reduced, indicating that altered Mn bioavailability as a cofactor leads to the deficient enzymatic activity. These data support a hypothesis that mutant HTT leads to a selective deficiency of neuronal Mn at an early disease stage, contributing to HD striatal urea-cycle pathophysiology through an effect on arginase activity.
Keywords: Huntington’s, neurodegeneration, manganese, arginase, striatum, urea
Graphical Abstract
1. Introduction
A CAG expansion in the huntingtin (HTT) gene leads to the diverse neuropathology of Huntington’s Disease (HD), including selective neurodegeneration of striatal medium spiny neurons (MSNs) as well as subsets of neurons in the cortex and other brain regions. We previously reported prodromal deficits in striatal Mn accumulation and altered responses of the proteome, metabolome, dopamine metabolism, p53 signaling, and dendritic morphology in human and mouse neuronal cells and HD mouse model brain tissue exposed to Mn [1–3]. There are subtle but significant reductions in cortical Mn levels in patients [4]. We hypothesized that these deficits of Mn responsiveness in HD models are consequences of Mn dyshomeostasis, and that loss of essential functions requiring Mn may occur early in HD pathophysiology.
Many enzymes require Mn as a cofactor [2, 5] including arginase (ARG1 and ARG2; L-arginine amidinohydrolase) and agmatinase (AGMAT; agmatine ureahydrolase), which are components of the partial urea cycle found in brain (Fig. 1, A). Agmatinase-like protein (ALP), an isoform of LIM And Calponin Homology Domains 1 (LIMCH1), also has been identified in rodent brain [6]. Notably, peripheral urea cycle dysregulation has been reported in HD [7, 8] and recent studies revealed excess urea [9, 10], deficient ornithine and other urea cycle metabolic perturbations [10] in the post mortem brain tissue of late-stage HD patients. ARG2 is associated with regulation of neuronal nitric oxide signaling [11, 12], which is altered in HD [13]. These studies suggest neuronal urea cycle abnormalities in the presence of mutant HTT, however brain arginases and agmatinases have not been examined in HD models.
Fig. 1.

Urea cycle metabolites and arginase enzyme activity are altered in a Huntington’s disease mouse model (YAC128Q) and normalized following either in vivo manganese (Mn) exposure or ex vivo Mn supplementation. (A) Schematic of the partial urea cycle present in brain. (B) Striatal urea cycle metabolites are increased in the HD model, and normalized after Mn-exposure. Metabolites measured by liquid chromatography-mass spectrometry (LC-MS), n=6–8, wildtype (WT), mutant (HD), vehicle-(Veh) or Mn-exposed. (C) Baseline striatal arginase enzyme activity is reduced in the HD model, and increased to WT levels with Mn-exposure in vivo. Striatal arginase activity, vehicle-exposed (n=18 mice, 6 experiments) and Mn-exposed (n=12 mice, 4 experiments). (D) Mn supplementation eliminates arginase enzyme activity difference between genotypes. These are the same samples as in (C) subsequently activated with Mn ex vivo. (E) Baseline striatal arginase activity is also reduced in C57B/6J (C57) background, and is negligible in cortex in both backgrounds. Vehicle-exposed striatal arginase activity (n=6 mice, 2 experiments, C57 background), and cortical (2 experiments, 3 mice each, mixed C57, FVB, ns). Data presented as +sem, *p< .05, **p< .01, ***p< .001, ****p< .0001, post-hoc binary comparisons by t-test following a significant (p=< .05) ANOVA. All samples from YAC128Q model, males, 13 weeks of age, FVB background unless indicated as C57.
We hypothesized that prodromal striatal metabolic changes may occur in an HD mouse model due to loss of Mn-dependent enzyme activity, and that increasing levels of Mn in brain would reverse this pathophysiology. To test this hypothesis we exposed wild type (WT) and YAC128Q (HD) mice (12 weeks of age, preceding neuroinflammation and neurodegeneration) to subcutaneous injections of vehicle or MnCl2 [14].
2. Materials and Methods
2.1. Animals and experimental design
All animal experiments were approved by the Vanderbilt University Medical Center Institutional Animal Care and Use Committee and were designed to minimize pain. Males were weaned with Diet Gel 76A (ClearH2O 72-07-5022) and housed in groups of 2–4, with disposable cardboard houses. The FVB-Tg(YAC128)53Hay/J mouse line (YAC128Q) was purchased from Jackson Laboratory (Bar Harbor, ME). The C57-YAC128Q line was generated by crossing YAC128Q mice with WT C57BL/6J animals followed by backcrossing with C57BL/6J mice for more than 10 generations. Both lines were maintained in their genetic backgrounds by crossing hemizygous transgenic animals with their WT littermates. Mice were genotyped by PCR according to the protocol provided by the company (#004938; Jackson Laboratory) and/or by Transnetyx for qPCR-based genotyping (Htt Wildtype Forward Primer: GAGAAAGAGAATGTTTAACTCTCCAAGAGA, Reverse Primer: CACATGCACTTTCTACAGCTAGGT, Reporter 1: AAGCAGCTCCAATATC; Htt mutant Forward Primer: CCACTTCCCTCTTCTAGTCTGAGA, Reverse Primer: CCACATCTCTCCAGCTCCAAA, Reporter 1: CCCCGCCTCCTCTCG). WT and transgenic littermates were used for experiments.
Mn exposure followed the previously published sub-chronic, 7-day paradigm[14, 15]. Briefly, 12-week-old male animals [at an age prior to neurodegeneration and neurogliosis[16]] or 42-week-old female animals were injected subcutaneously with a 1% solution of MnCl2 × 4H2O in filtered MilliQ water at 50 mg/kg body weight, or with vehicle (filtered water), on experimental days 0, 3 and 6. Though the HD mice take up less striatal Mn than WT, this exposure paradigm increases Mn levels in both mutant and WT more than 5-fold in the striatum at the time of tissue collection [17], while a 3-fold increase is considered to be the threshold for toxicity[18]. Mice were then sacrificed by cervical dislocation on day 7; the brain was removed, and cerebellum, hippocampus, striatum, pre-frontal cortex and remaining cortex immediately dissected on ice. Kidney and liver were also isolated and all tissues were snap-frozen in liquid nitrogen and stored at −80°C.
R6/2 and B6CBA colonies were maintained in the animal facility at IRCCS Neuromed. Mice were sacrificed by cervical dislocation and all the procedures were performed in accordance with approved protocols by the IRCCS Neuromed Animal Care Review Board and by “Instituto Superiore di Sanita” (permit number: 1163/2015-PR) and were conducted according to EU Directive 2010/63/EU for animal experiments.
2.2. Sample preparation
For metabolite measurements, frozen tissues were added to ice cold buffer (100 mM trichloroacetic acid, 10 mM CH3COONa, 100 μM EDTA, 10.5% MetOH, pH 3.8) and homogenized in Potter-Elvehjem glass/PTFE tissue grinders (Kimble Kontes, Vineland, NJ). For western blotting, tissue was homogenized in RIPA lysis buffer (50 mM Tris pH8.0, 1mM Ethylenediaminetetraacetic acid [EDTA], 150 mM NaCl, .01% Triton X-100, 1% SDS, 1% sodium deoxycholate, protease inhibitor cocktail [Sigma P8340], 1:100 and phosphatase inhibitor cocktails 2 and 3 [Sigma P5726 and P0044], 1:100) using a 23G × 1 needle for brain tissue, and glass homogenizers for liver and kidney. Homogenates were then centrifugated at 4° at 13000 rcf for 5 min and supernatant was collected and kept on ice.
For the arginase enzymatic activity assay, tissue was disrupted on ice with 23G × 1 needle in lysis buffer (10mM Tris-HCl, in 0.4% Triton-X100 at pH 7.4, supplemented with protease inhibitors: Leupeptin (leupeptin hydrochloride, microbial, Sigma-Aldrich at 1:1000) and Pepstatin-A (microbial, Sigma-Aldrich at 1:1000). The homogenate was centrifuged at 13000 rcf for 5 min at 4°C and supernatant was used for the activity analysis.
Protein content for all experiments was measured using either the DC protein assay kit (Bio-Rad, Hercules, CA) and/or the BCA protein assay (Pierce™ BCA Protein Assay Kit, Thermo), in pellet solubilized with 0.5 M NaOH in the samples prepared for metabolite measurements and in aliquots of supernatants for the samples prepared for activity assays and Western blotting.
For quantitative PCR, tissue was homogenized in RLT Plus Buffer (Qiagen 1053393) using needle method as described above and flash frozen in liquid nitrogen.
2.3. Metabolite measurements
Arginine and its metabolites were measured by liquid chromatography-mass spectrometry (LC-MS). Prior to the analysis, samples were supplemented with internal standard, homoagmatine (hAgm)[19], and purified by centrifugation with Amicon centrifugal filters (Millipore) at 14000 × g, for 10 min., at room temp. The resulting filtrate was then evaporated under N2 gas and reconstituted with 50% acetonitrile containing 100 mM NaHCO3 (pH 8.0) and derivatized with 20 mM dansyl chloride (Sigma) at 50°C for 20 min. Next, samples were diluted with H2O, centrifuged at 18000 × g, for 10 min at room temp, and transferred to autosampler vials. LC-MS system was equipped with ThermoPal autosampler, Accela UHP quaternary pump (Thermo Fisher Scientific), Zorbax SB-C18 Rapid Resolution HT column (2.1 mm × 50 mm, 1.8 μm, Agilent Technologies, Santa Clara, CA) with Acquity UPLC in-line 0.2 μm steel filter unit (Waters, Milford, MA), TSQ Quantum Access triple-stage quadrupole mass spectrometer with an electrospray ion source and a 100 μm ID deactivated fused silica capillary (Thermo Fisher Scientific). The autosampler was set at 10°C and separations were performed at RT. Mobile phases were composed of 0.5% formic acid in (A) 5% acetonitrile and in (B) 10% 2-propanol/85% acetonitrile. The flow rate was set at 350 μl/min and the gradient was as follows: B=0%, 3 min; B=0–90%, 3 min; B=90%, 3 min; B=90-0%, 1 min; B=0%, 5 min. MS/MS detection was performed in positive-ion mode. Quantification was based on multiple reaction monitoring detection at a collision energy of 30 V (agmatine (Agm): m/z 364 → 347; hAgm: m/z 378 → 361; Arg: m/z 408 → 391; Orn: m/z 599 → 303; Cit: m/z 409 → 392; putrescine (Put): m/z 555 → 304; spermine (Spm): m/z 1135 → 360, 669, 900; spermidine (Spmd): m/z 845 → 360). Data were acquired with Xcalibur 2.0.7, and analyzed with LCQuan 2.5.6 (Thermo Fisher Scientific).
2.4. Arginase activity
Arginase activity was measured on the basis of urea produced from arginine added to tissue homogenate, according to a previously described assay[20], with optimization as noted, to permit assessment of enzyme activity in the absence of ex vivo supplemented Mn. All procedures were performed as quickly as possible, with a maximum of 12 samples (n=3) in a single experiment to minimize the effect of time. Additionally, plates were designed to minimize plate- and time-loading effects by alternating wells between genotypes. Heating blocks were pre-set to 56°C and 37°C. Microcentrifuge tubes were pre-loaded with either 20μL of Mn-pos Activation Solution (10 mM MnCl2-4(H2O)/50 mM Tris-HCl pH 7.5), or 20μL Mn-neg Activation Solution (50 mM Tris-HCl ph 7.5), or 30μL of Arginase Substrate Solution (0.5 M L-arginine/H20 pH 9.7) and kept on ice. Microcentrifuge tubes and 96-well plates (Costar 3370) were pre-labeled to be loaded quickly with variable-width pipettes. Tissue samples of approximately 12 mg were prepared in 190 μL of lysis buffer, as described above, and kept on ice until added to dialysis filter tubes (Slide-A-Lyzer® MINI Dialysis Devices, 10K MWCO, 0.5 mL) pre-loaded with 14 mL of ice-cold Tris lysis buffer. Samples were dialyzed on a rocker on ice for 45 min, then filter tubes were transferred to fresh Tris lysis buffer and dialyzed a second time for 45 min. After dialysis, samples were moved into microcentrifuge tubes and kept on ice, with an aliquot removed and diluted 1:3 into lysis buffer for protein assay. The enzyme assay was begun by simultaneously adding 20μL of each sample with a variable-width pipette to the microcentrifuge tubes, which had been pre-loaded with 20μL of Mn-pos Activation Solution (Mn-Supp). The tubes were immediately placed in the 56°C heating block for 10 mins. Another 20μL of each sample was added to the tubes, which had been pre-loaded with 20μL of Mn-neg Activation Solution (Mn-Unsupp), and then placed on ice. At the end of the 10 min incubation period, both Mn-Supp and Mn-Unsupp tubes were placed in a rack with matching tubes preloaded with 30μL of Arginase Substrate Solution, and 30μL from each activated sample were rapidly loaded into the substrate tubes, which were immediately placed into the 37°C heating block, to be incubated for 30min. During this incubation period, the urea standard was prepared. Standard was made on ice in diluted lysate (1:2) from equal amounts of each vehicle-treated sample lysate spiked with urea prepared in Tris lysis buffer and subsequently diluted 1:2 for a range of 1.92mg/mL urea to 0.0075mg/mL with 0mg/mL urea in the final standard tube. Five minutes before the end of the 37° C incubation period, 20μL of each standard was transferred to tubes pre-loaded with 20μL of Mn-neg Activation Solution (Mn-Unsupp) and mixed well. Immediately after mixing, 30μL of each mixture was transferred to tubes pre-loaded with 30μL of Arginase Substrate Solution and mixed well on ice. At the end of the 37°C incubation period, sample tubes and standard tubes were arranged into a rack matching the design of the 96-well plate. Using multi-channel pipettes 25μL of each sample and standard were transferred into duplicate wells, and 200μL of the freshly prepared Urea Assay Kit mixture (QuantiChrom™ ABIN1000249) was added to each well. The plates were incubated in the dark at room temperature for 10–12 min, bubbles were then popped with a needle, and the absorbance was read at 520 nm, exactly 15 min after loading.
2.5. Western blotting
Tissue homogenates in RIPA lysis buffer were diluted with sample buffer (4x Laemmlli sample buffer [Bio-Rad 061–0747, 5% β-mercaptoethanol added]), heated for 5 min. at 95°C and 40 μg of protein of each sample loaded onto Mini-Protean TGX Pre-cast gels (4–20% 456–1094). Proteins were transferred for 7–9 min to 0.22μm nitrocellulose membrane (IB301002) using the iBlot™ system. Gels were rinsed with MilliQ water and stained with Coomassie (Bio-Rad 161–0786) for 45 min, then rinsed 3–5 times with MilliQ water. Membranes were dried, blocked with Odyssey blocking buffer (927–40000 PBS) for 1 hour, and incubated overnight in primary antibodies (in Odyssey blocking buffer with 0.1% Tween-20) at room temperature. Blots were washed 5 times for 5 min each with 1x TBST buffer (150mM NaCl, 56mM Tris-HCl, 44mM Tris base, 0.05% Tween-20) and incubated in secondary antibodies (in Odyssey blocking buffer with 0.1% Tween-20) for 90 min then washed again with TBST as above. Primary antibodies used were ARG1: Abcam ab912795 at 1:1000, Proteintech 16001-1-AP at 1:2000, Millipore ABS535 at 1:1000; ARG2: Abcam ab81505 at 1:4000, Santa Cruz sc-20151 at 1:1000, Proteintech 14825-1-AP at 1:2000; AGMAT: Santa Cruz sc-46716 at 1:1000; LIMCH1: Abcam ab96178 at 1:1000; Anti-Polyglutamine-Expansion Diseases Marker (5TF1-1C2): Millipore MAB1574 at 1:5000; ACTIN: Millipore MAB1501 1:10,000 and Sigma A5441 at 1:10,000. Secondary antibodies: anti-rabbit, anti-mouse, anti-chicken or anti-goat (Licor IRDye 700 or 800CW) diluted at 1:10000. Protein was detected using the Odyssey infrared system and analyzed with ImageStudio (www.licor.com) and normalized to total protein quantified from Coomassie stained Gel or ACTIN signal.
2.6. Immunohistochemistry
Free floating formalin-fixed 35μm sections were washed and treated with 88% formic acid for 30 min., aldehydes were blocked with ethanolamine acetate pH 9.5 for 1 h followed by the addition of 10 mM ascorbic acid for 10 min. Sections were treated with 0.5% Triton X-100 in PBS (TxPBS) for 50 min. and incubated overnight with a polyclonal rabbit antibody to arginase-2 at 1:5,000 in TxPBS. Sections were washed and incubated with for 90 min in biotinylated anti-rabbit IgG (Vector) at 1 μg/ml in TxPBS. Peroxidase detection of biotinylated secondary antibody was performed with ABC Elite Kit (Vector) with nickel enhanced DAB in the presence of glucose and glucose oxidase in Tris-imidazole buffer after a single round of tyramide amplification using biotin-PEG-tyramide. Sections were mounted on gelatinized glass slides, dried and cover-slipped using Xylene substitute mountant. Digital images of striatum were collected on a Nikon Eclipse Ni microscope equipped with a DS camera.
2.7. Quantitative RT-PCR
Arginase 1 (Arg1), arginase 2 (Arg2), agmatinase (Agmat) and the agmatinase-like protein predicted domain of Limch1 (Limch1) transcript levels were measured by quantitative reverse-transcriptase PCR (qPCR). Frozen homogenates were subjected to RNA purification using RNAeasy Plus Mini kit (QIAGEN 74134) according to manufacturer’s protocol. RNA concentrations were determined by absorbance measurements at 260 nm and 280 nm using NanoDrop spectrophotometer (ND-1000 Thermo Fisher Scientific, Waltham, MA). cDNA was reverse-transcribed from isolated RNA with SuperScript III Reverse Transcriptase kit (Invitrogen 18080044), using Mycycler thermocycler (Bio-Rad) according to manufacturer’s directions for random hexamers. The qPCR reaction was run on an ABI 7900HT real-time PCR detections system (Invitrogen) using Power SYBR Green Master Mix (Life Technologies Applied Biosystems 4367659) according to the manufacturer’s instructions, and the results were analyzed using SDS software(Invitrogen). The following primers were used: Arg1: F: 5′-TGGCTTGCGAGACGTAGA-3′, R: 5′-CCAATCCCCAGCTTGTCT-3′, Arg2: F: 5′-GGGATGCCACCTAAAAGAC-3′, R: 5′-GCCCACTGAACGAGGATAC-3′, Agmat: F: 5′-CTCTGACCTTGGGTGGAGAC-3′, R: 5′-GAGGTTTGTCCGTGGTGTT-3′, Limch1: F: 5′-GCAGCAACAGCATCGAGATC-3′, R: 5′-CATCCTCTTGGCCGTTCGAT-3′, Actin: F: 5′-CAGCCTTCCTTCTTGGGTAT-3′, R: 5′-CGGATGTCAACGTCACACTT-3′. Arg1, Arg2, Agmat, Limch1 transcript levels were normalized to the levels of Actin.
2.8. Statistics
General Linear Model (GLM) multivariate or univariate ANOVA was performed using Graphpad Prism or SPSS Statistics 19 (IBM, Armonk, NY). For post-hoc pairwise comparisons between experimental groups, a Student’s t-test was used (Excel 2008; Microsoft, Redmond, WA).
3. Results
3.1 Urea cycle metabolites are increased in HD model striata and normalized with Mn exposure
We measured urea cycle related metabolites in striatal brain tissue via liquid chromatography mass spectroscopy (LCMS). We found significantly increased arginine (Arg), citrulline (Cit) and ornithine (Orn) levels in vehicle-exposed HD versus WT striatum (Fig. 1, B). All three of these metabolites were normalized in HD striatum by Mn exposure. Mn evoked no change in Cit or Orn in WT, but both WT and HD animals had significantly reduced Arg with Mn. Metabolites further downstream from arginase, including agmatine (Agm), were not affected (Supplemental Fig. 1). We hypothesized that reduced Mn bioavailability in HD striatum underlies this metabolic phenotype by restricting arginase activity, and that in vivo exposure of the HD mice to its cofactor Mn would restore arginase enzymatic activity.
3.2 Striatal arginase enzyme activity is reduced in the HD model mice
We directly assessed ex vivo arginase activity by customizing an established assay [20] to allow measurement of basal arginase activity in mouse striatal tissue extracts in the absence of added Mn (Supplemental Fig. 2). Basal arginase activity was approximately 10-fold higher in striatal extracts than in cortical extracts. Consistent with our hypothesis, basal arginase activity was reduced in striatal extracts from HD mice in both FVB/NJ (FVB) and C57BL/6J (C57) backgrounds (Fig. 1, C–E), but not in cortical extracts. The deficit in HD striatal arginase activity was rescued by in vivo Mn exposure, which increased enzymatic activity in the HD model to levels observed in WT mice (Fig. 1, C, Supplemental Fig. 3, A). An inadequate bioavailability of Mn in HD striatum likely underlies this enzymatic deficit, as in vitro addition of Mn after tissue extraction eliminated the genotype difference in enzyme activity, increasing arginase activity in both vehicle and Mn exposed animals, (Fig. 1, D, Supplemental Fig. 3, B).
3.3. ARG2 protein increased with Mn exposure, but was not reduced at baseline
To ascertain whether changes in arginase protein levels contribute to changes in enzyme activities at this prodromal stage, we measured striatal ARG1 and ARG2 by western blot. ARG1 was undetectable in all tested brain tissues, while ARG2 was detected in all but cerebellum (Fig. 2, A–D, Supplemental Figs. 4–5, 6, A). Striatal ARG2 levels were unaltered in HD mice at this prodromal stage; though surprisingly, in vivo Mn exposure increased ARG2 levels in both WT and HD mice (~3-fold in striatum) (Fig. 2, A–D, Supplemental Figs. 4–6). Reflecting the increased enzyme activity levels, ARG2 protein was much more abundant in striatum than in cortex (Fig. 2, B). The level of ARG2 protein was almost as high in hippocampus as in striatum, and ARG2 was significantly increased by Mn exposure across all brain regions where it was detected. AGMAT was undetectable in these mouse brain tissues, and LIMCH1 was unchanged by Mn-exposure and genotype, corroborating findings on ALP [21] (Fig. 2, C, Supplemental Fig. 6). Immunohistochemical staining revealed a substantially increased signal in Mn-exposed striatum in both genotypes, and a punctate pattern consistent with its reported mitochondrial localization in other tissues [35] (Fig. 2, E).
Fig. 2.

ARG2 protein levels are similar in brains of mutant (HD) mice at the prodromal stage and wildtype (WT) mice, and ARG2 protein is elevated by Mn-exposure; ARG1 is undetectable. (A) ARG2 increases with Mn exposure. ARG2 and ACTIN (ACT) protein in C57 striatum (Str), vehicle-exposed (Veh) or Mn-exposed, representative blot. (B) In brain, ARG2 is more abundant in striatum than other tissues. ARG2 protein measured in WT kidney (Kid), Str, cortex (Ctx), hippocampus (Hip), prefrontal cortex (Pfctx), cerebellum (Cer), normalized to WT vehicle-exposed striatal tissue on each blot, n=6–9. LIMCH1 protein expression is similar across these tissues, though neglible in kidney. (C) ARG2 protein increases with Mn-exposure in every tissue where it was detected. Representative blots for ARG2 (42kDa) and LIMCH1 (150kDa) with ACTIN (42kDa) as loading control. 40μgs protein loaded in each lane. (D) Quantification of ARG2/ACTIN, normed to WT Veh, FVB Str, n=7, C57 Str n=4 (for quantification of other regions see Supplemental Fig. 6) (E) Immunohistochemical (IHC) staining revealed a substantially increased signal in Mn-exposed striatum in both genotypes, and a punctate pattern consistent with its reported mitochondrial localization in other tissues [35]. Representative striatal images closest to average for genotype. Data presented as +sem, *p< .05, **p< .01, ***p< .001, ****p< .0001, post-hoc binary comparisons by t-test following a significant (p=< .05) ANOVA. All samples from YAC128Q model, males, 13 weeks of age, FVB background unless indicated by C57.
3.4. ARG2 protein is significantly reduced at advanced disease stages
Though ARG2 protein levels were not measurably reduced in the prodromal stage of the YAC128Q HD model, ARG2 protein was significantly reduced in both striatum and hippocampus in another HD mouse model (the R6/2) which represents a more advanced disease stage at the 12 week age point [22] (Fig. 3, A–B). LIMCH1 protein was unchanged by genotype in these tissues. Furthermore, striatal ARG2 protein was reduced in YAC128Q animals aged to 42 weeks compared to wildtype animals, with a similar trend in hippocampus (Fig. 3, C–D). Mn exposure had the same effect of increasing ARG2 protein ~3 fold over baseline in the aged YAC128Q mice (Supplemental Fig. 7), as it did in the prodromal stage mice also eliminating the genotype difference (Fig. 2, D).
Fig. 3.

ARG2 protein is reduced in aged HD models. (A) Model of Huntington’s disease at a symptomatic stage (the R6/2 at 11–12 weeks[22, 36]) exhibits reduced ARG2 protein in both mutant (HD) striatum (Str) and hippocampus (Hip) compared to wildtype (WT), while LIMCH1 protein is unchanged by genotype. Str and Hip samples from same mice, both regions, unexposed, 11–12 weeks of age, mixed gender, 40μgs protein loaded per lane, Poly-Q (MAB1574/IC2), ARG2 protein (sc-20151), LIMCH1 (ab96178). Representative blots. (B) Quantification of ARG2 in samples described in (A) normed to ACTIN and to average FVB-WT-Str-Veh on each blot. (C and D) Aged YAC128Q mice at 42 weeks of age exhibit significantly reduced ARG2 protein in mutants (HD) compared to WT in striatum, representative blots are shown (C) and quantification with n=6 (D); there is a trend (p=0.1041) towards reduction in HD vehicle-exposed hippocampus versus WT vehicle-exposed hippocampus, also n=6. Data shown as +sem, post-hoc binary comparisons by t-test following a significant (p=<.05) ANOVA, see supplemental Fig. 7,*p=<.02, ***p=<.0004, ****p<.0001.
3.5. Arg2 mRNA expression did not increase with Mn exposure
We next explored whether the Mn-induced increase in ARG2 protein levels correlated with changes in mRNA by performing QRT-PCR on striatal extracts. There was no increase in striatal Arg2 mRNA expression after Mn exposure in the HD model, and striatal Arg2 mRNA decreased following Mn exposure in WT (Fig. 4, A), suggesting that the reduction in enzyme activity, as well as the increase in ARG2 protein after Mn exposure, were due to post-transcriptional mechanisms. Baseline Limch1 was increased only in the HD model and expression levels were unaffected by Mn exposure (Fig. 4, B). While both Arg2 and Limch1 were detectable in striatum, neither Arg1 nor Agmat were present, although both were expressed in liver, (Fig. 4, C–E).
Fig. 4.

Striatal Arg2 mRNA expression is reduced after Mn exposure in WT only, while Limch1 is affected by genotype but not treatment, and Arg1 and Agmat are undetectable. (A) Striatal Arg2, n=12. (B) Striatal Limch1, n=6. (C) Baseline striatal Arg1 (n=6), Arg2 (n=12), Agmat (n=3), Limch1 (n=3). (D) Liver and, (E) Kidney baseline Arg1 (n=6), Arg2 (n=6), Agmat (n=3), Limch1 (n=3). Data presented as +sem, *p< .05, **p< .01, post-hoc binary comparisons by t-test following a significant (p=< .05) ANOVA. All samples from YAC128Q model, males, 13 weeks of age, FVB background.
4. Discussion
We report a prodromal HD striatal metabolic phenotype due to an apparent deficit in striatal Mn bioavailability, an essential cofactor for arginase enzymatic activity. Our data, for the first time, directly implicates Mn biology in HD pathogenesis. Though short-term Mn exposure mitigated the metabolic alterations in the HD model, a robust homeostatic mechanism in the WT appears to tightly regulate the urea cycle in brain, as upregulation of arginase by ~3-fold caused a reduction of arginine without significant change in other metabolites (Fig. 1, B and 2, D). Given the near absence of ARG1 in striatum at this age in both genotypes, our findings strongly suggest that ARG2 is the isoform responsible for striatal arginase enzymatic activity deficits in this HD model at this early stage that precedes neuroinflammation [16].
The difference in arginase enzyme activity between WT and HD at baseline is most likely explained by insufficient bioavailable Mn, because supplementation of the extract with this co-factor ex vivo equalized activity between genotypes, suggesting a pool of dormant ARG2 in the mutant. In contrast, the increase in arginase activity after Mn-exposure in vivo is consistent with the increase of ARG2 protein; arginase is known to be stabilized in vitro by incorporation of Mn into each homomer [23]. Because the striatum exhibited more ARG2 than any other brain region, and because striatum normally accumulates Mn preferentially [14], the region may be especially vulnerable to Mn deficiency [24], though there is not a detectable difference in total striatal Mn levels between WT and YAC128Q at this stage [1]. The reduction in arginase enzyme activity in this HD model therefore suggests a specific cellular or subcellular deficit in Mn bioavailability for this enzyme.
The substantial technical hurdles to measuring Mn, or Mn-bound proteins, at subregional and sub-cellular resolution limits analysis of brain Mn bioavailability. Astrocytes have very low Arg2 expression [25], but sequester more Mn than neurons [2], which could cause total regional measures of Mn content to be increased with gliosis despite lower neuronal levels. ARG1 is primarily cytosolic, while ARG2 is primarily mitochondrial [26], and Mn accumulates preferentially in the mitochondria [27], so a change in the subcellular location of either Mn or ARG2 could change both enzyme activity and Mn accumulation. Changes in arginase activity may be exacerbated at symptomatic stages with further reductions in brain ARG2 protein levels in both striatum and hippocampus (Fig. 3). Examination and analysis of raw data from a recently published genomics/proteomics study supports these findings, as striatal ARG2 protein was reduced in mouse knock-in HD models in a manner correlating with increasing CAG length, while gene expression (mRNA) remained unchanged until a more advanced age [28] (Supplemental Fig. 8, Supplemental Table 1). The stability of LIMCH1 protein in both early stage HD models (Supplemental Fig. 6) and late stage (Fig. 3, Supplemental Fig. 8, Supplemental Table 1) suggests that the changes to ARG2 are specific. Furthermore, Arg2 is among the most abundant transcripts in D2-receptor containing MSNs, those most susceptible to HD neuropathology [29].
The process by which mutant HTT may alter Mn homeostasis is unknown. Chronic systemic treatment with Mn is not expected to be a viable treatment strategy, as prolonged systemic exposure to Mn could cause toxicity in regions or cells less affected in HD than striatum. Indeed the Mn exposure paradigm we used elevates brain Mn levels into the toxic range, and negative effects of this short-term exposure have been seen. Four weeks after the last injection, HD animals exhibit a reduction in numbers of striatal dendritic spines and loss of complexity, though this was not seen in WT animals[30], indicating that Mn exposure causes detrimental as well as beneficial effects in the same brain regions. It may be possible to genetically engineer increased Mn accumulation into specific brain regions and neuronal subtypes in future mouse models to test whether or not normalization of striatal Mn accumulation alone could prevent motor impairment and other behavioral alterations seen in HD models.
The connection between Mn exposure, arginase activation and nitric oxide (NO) production is complex due to the existence of multiple isoforms of both arginase and nitric oxide synthase (NOS) sharing the same substrate, arginine. There are three isoforms of NOS; neuronal NOS (nNOS), inducible NOS (iNOS) and endothelial NOS (eNOS). While ARG1 and ARG2 are both found in endothelial cells, it is likely that only ARG2 is found in neurons[25] and only ARG1 is found in glia[26]. Mn overexposure has been shown to increase iNOS which leads to increases in NO[31] and glial activation, but iNOS is exclusively produced in glia, so this connection may be more related to the metabolism of arginine through ARG1 rather than ARG2. On the other hand, although both ARG1 and ARG2 are present in endothelial cells, ARG2 predominates, and arginase inhibition stimulates NO through eNOS[32] as well as increasing urea production in endothelial tissue, suggesting that a decrease of ARG2 activity could have the same effect on nNOS in neurons. In fact, deletion of ARG2 causes mice to be more susceptible to brain injury from ischemic and excitotoxic challenges[33], though the same deletion is protective against retinal vascular degeneration[34], demonstrating that even ARG2/nNOS activity may be regionally diverse, or sensitive to regional Mn accumulation.
Potentially, delivery of bioavailable Mn to brain regions or specific cells may be a future treatment strategy. It will be important to test our findings with regional knockdown of ARG2, with and without Mn delivery, to directly assess the role of ARG2 on the long-term behavioral and molecular phenotypes seen in HD models and establish the specificity of ARG2 to the urea-cycle deficits. It is noteworthy that several Mn-dependent enzymes are mechanistically tied to HD pathobiology (e.g. Mre11, Glutamine synthetase, SOD2), and in all cases, observed HD phenotypes are consistent with a loss of activity in the Mn-dependent enzyme [2]. The findings in the present study provide the first direct evidence that a deficiency in bioavailable Mn contributes to HD striatal pathology, manifested early as a urea cycle deficit (Fig. 5).
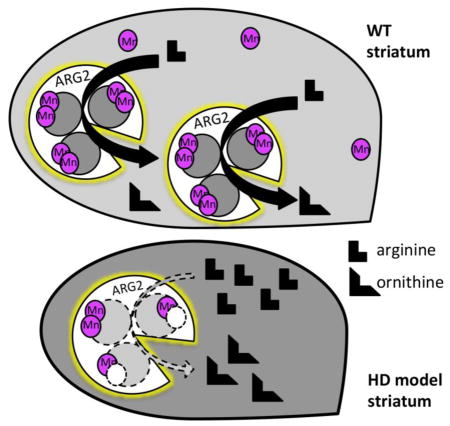
Fig. 5.

The urea cycle is influenced by Mn, which is an essential cofactor for three enzymes: Arginases (ARG), Agmatinases (AGM) and Glutamine Synthetase (GS). Arginase pathway related metabolites are altered in HD striatum; and Mn exposure ameliorates this phenotype. (A) Representation of the urea cycle in WT striatum with the presence of adequate Mn (Note: ARG is a homotrimer with 2 Mn ions per monomer, AGM is a hexamer composed of dimers, and GS is composed of 8–12 identical subunits, each with two Mn ions, though Mg can substitute for Mn in GS). (B) Representation of the striatal urea cycle in the HD model with reduced bioavailable Mn, resulting in increased metabolites (indicated in pink).
Supplementary Material
Supplemental Fig. 1. Arginine (Arg) is the most abundant of the direct urea cycle metabolites found in striatum and agmatine (Agm) is the least [citrulline (Cit), ornithine (Orn), putrecine (Put)]. Related metabolites, spermidine (Spmd), spermine (Spm), though more abundant, were not significantly affected by genotype or exposure. Striatal tissue from male, FVB, 13 week old, WT, vehicle-exposed animals, metabolites measured by Laser Coupled Mass Spectroscopy (LCMS), normalized to homo-agmatine, fmol/ug, n=6–8. Data are presented as means +sem on log2 scale.
Supplemental Table 1. Protein Expression, Striatum, 6 months of Age, Langfelder et al [27]
Red arrows in (a–c) indicate parameters used in the assay. (A) Arginase activity is time-dependent (liver tissue, thus primarily ARG1) incubated at 0, 30, and 90 minutes at 37° after addition of substrate solution, subtracting background (raw value at zero time point) from all data points. Significant effect of time by univariate ANOVA: WT Mn [F(2,6)=146.2, p<.0001], WT Veh [F(2,6)=15.53, p<.0042]. (B) Arginase activity is arginine-dependent (kidney tissue, thus primarily ARG2), Km=324.8 mM Arg, Vmax standards completed without added arginine. (C) Arginase activity is dependent on the co-factor Mn (kidney tissue, thus primarily ARG2). Data shown is arginase activity induced by supplemental Mn, Ka=0.377mM Mn, Vmax The increase in arginase activity is not explained simply by the amount of striatal Mn in Mn-exposed animals, because in vivo Mn exposure itself is not calculated to raise the concentration of endogenous Mn in the ex vivo striatal extracts higher than 0.8 μM in striatum[17]. We used 2.5 mM Mn as in the published assay[20], which is well above the amount needed to stimulate arginase activity[37]. (D) Extracted urea concentration measured in undialysed striatal samples, FVB, n=3, not significant by two-way ANOVA. Michaelis-Menten parameters calculated with GraphPad Prism.
(A) Arginase activity, vehicle (Veh): n=6 mice, 2 experiments. (B) The same samples as in (A) subsequently activated with Mn ex vivo. . YAC128Q model male mice, C57 background, 13 weeks of age. Data presented as +sem, *p<.05, **p<.01, ***p<.001, ****p<.0001, post-hoc binary comparisons by t-test following a significant (p=<.05) ANOVA.
Shown in (A) and (B) are the same samples of WT, FVB, vehicle-exposed striatum (Str), liver (Liv) and kidney (Kid) run on different gels with two different ARG1 antibodies (A) Abcam, (B) Proteintech, and additional striatal samples exposed to Millipore shown in (C), ladder (lad). ARG1 protein is observed as a doublet band at approximately 35–37kDa with all three antibodies in liver tissue and is absent from kidney and striatum. There were strong, non-specific bands at other molecular weights with the Proteintech antibody. (D) Mn exposure did not affect hepatic ARG1 protein levels (Abcam ab91279), samples from YAC128Q mutant (HD) or wildtype (WT), 13 week old male mice. (E) Quantification of ARG1/ACTIN normalized to WT-Vehicle (Veh), n=3. Data presented as +sem.
Shown are representative blots on the same samples run on three different gels and exposed to three different antibodies (A) Abcam, (B) Proteintech, (C) and (D) Santa Cruz; vehicle (Veh). These blots have only one band in common, at 37kDa, and this band shows the same pattern of change for all three after in vivo Mn exposure, suggesting that all other bands are non-specific and may be cross-reacting with ARG1. (D) Striatal tissue (40μg) from ARG1 heterozygous knockout[38] and ARG2 homozygous knockout[39] mouse with WT kidney (Kid) (20μg) and striatum (Str) for controls. For experiments shown in Fig. 2, Fig 3 and Supplemental Fig. 5 we used sc-20151 because it had no evidence of cross-reactivity. Quantifications are ARG2/ACTIN, normed to WT Veh, FVB, +sem, post-hoc binary comparisons by t-test following a significant (p=<.05) ANOVA, *p=<.05, ***p<.001.
(A) ARG1 (ab91279), ARG2 (sc-20151) and LIMCH1 (Abcam ab96178 at 150kDa) in cerebellum. Striatal tissue used as control. (B) LIMCH1 in cortex (Ctx), prefrontal cortex (Pfctx), and hippocampus (Hip), 40μgs/lane of each tissue, striatal tissue used as control (Abcam ab96178). (C) Quantification of LIMCH1 vs. ARG2 in cortex, normalized to Str WT Veh, n=3. (D) Quantification of ARG2 protein (sc-20151), FVB kid (n=6, *p=.05), FVB pfctx (n=3 experiments, ***p=.001), FVB ctx (n=3 *p=.01, #p=.028), FVB hip (n=6, *p=.0253, **p=.0013, #p=.0076), representative blots shown in Figure. 2c. Ctx and Pfctx protein levels are very low relative to Str (see Figure. 2b). Data are presented as means +s.e.m post-hoc binary comparisons by t-test following a significant (p=<.05) ANOVA.
ARG2 (sc-20151)/ACTIN normalized to WT-13week-Veh-Str on each blot. Striatal tissue from females, aged to 42 weeks, FVB background, n=4,6. Data are presented as means +s.e.m, comparisons by t-test following a significant (p=<.05) ANOVA. ARG2 is significantly elevated (p<0.0001 for WT, p=.0226 for HD) by Mn-exposure above vehicle (vehicle data plotted in Fig. 3D); with no differences in ARG2 levels between genotypes following Mn-exposure (p=0.18).
(A) and (B) Z-score change in protein by CAG repeat length compared to 20 CAG repeats, using striatal tissue from 6 month old mice with CAG repeats inserted into exon 1 of a human/mouse Htt. (A) Striatal ARG2 and (B) Striatal LIMCH1. Table of results and significance for data shown in Supplemental Table 1.
Highlights.
Metabolites of the urea cycle are altered in Huntington’s model striata.
Exposure to manganese ameliorates urea cycle alterations.
Reduced enzymatic activity of arginase 2, is rescued with exposure to the co-factor.
Exposure to manganese increases arginase2 protein without increasing gene expression.
Baseline reductions in arginase 2 are revealed as disease progresses.
Acknowledgments
The authors would like to thank Dr. M. Wade Calcutt from the Mass Spectrometry Core for training on the LC-MS system, and Dr. Anthony Tharp and the VBI Core Facility for equipment and technical support. We thank Dr. Elena Uribe Perez for providing ALP antibody (data not shown). We thank Drs. William Caldwell and Ruth Caldwell for Arg1 and Arg2 knockout tissue. QRT-PCR experiments were performed through the Molecular Genetics Core and LC-MS through the MSRC Mass Spectrometry Core at Vanderbilt University Medical Center.
Funding
This work was supported by the National Institutes of Health [NIH/NIEHS RO1 ES016931 and NINDS F31 NS077632] and the Training Program in Environmental Toxicology [NIEHS T32 ES007028].
Footnotes
Current affiliations for the following authors have changed since work on the project was completed, as indicated:
Wegrzynowicz, Cambridge University
Bradley, Thomas Jefferson Medical College
Uhouse, New York Medical College
Stubbs, University of Texas Southwestern Medical Center
Holt, University of Illinois, Chicago
Kwakye, Oberlin College
Tidball, University of Michigan
The authors have declared that no conflict of interest exists.
Author contributions. Studies were conceived and designed by T.J.V.B., M.W., R.C., M.A., A.O. and A.B.B. Experiments were performed by T.J.V.B., M.W., K.G.T., E.M.B., M.A.U., N.F., K.D., T.H., P.U., A.D.S., H.K.H. and A.O. with contributions from R.C. for enzyme assays; G.K. for western blots; A.M.T. for QRT-PCR; and A.D. and V.M. for R6/2 experiments. Data analysis, interpretation and hypotheses by T.J.V.B., M.W., M.B., K.H., M.D.N., R.C., M.A., A.O. and A.B.B. The paper was written by T.J.V.B., M.W. and A.B.B. and was edited by the other authors.
Publisher's Disclaimer: This is a PDF file of an unedited manuscript that has been accepted for publication. As a service to our customers we are providing this early version of the manuscript. The manuscript will undergo copyediting, typesetting, and review of the resulting proof before it is published in its final citable form. Please note that during the production process errors may be discovered which could affect the content, and all legal disclaimers that apply to the journal pertain.
References
- 1.Williams BB, Li D, Wegrzynowicz M, Vadodaria BK, Anderson JG, Kwakye GF, Aschner M, Erikson KM, Bowman AB. Disease-toxicant screen reveals a neuroprotective interaction between Huntington’s disease and manganese exposure. J Neurochem. 2010;112:227–237. doi: 10.1111/j.1471-4159.2009.06445.x. [DOI] [PMC free article] [PubMed] [Google Scholar]
- 2.Horning KJ, Caito SW, Tipps KG, Bowman AB, Aschner M. Manganese Is Essential for Neuronal Health. Annu Rev Nutr. 2015;35:71–108. doi: 10.1146/annurev-nutr-071714-034419. [DOI] [PMC free article] [PubMed] [Google Scholar]
- 3.Tidball AM, Bryan MR, Uhouse MA, Kumar KK, Aboud AA, Feist JE, Ess KC, Neely MD, Aschner M, Bowman AB. A novel manganese-dependent ATM-p53 signaling pathway is selectively impaired in patient-based neuroprogenitor and murine striatal models of Huntington’s disease. Hum Mol Genet. 2015;24:1929–1944. doi: 10.1093/hmg/ddu609. [DOI] [PMC free article] [PubMed] [Google Scholar]
- 4.Rosas HD, Chen YI, Doros G, Salat DH, Chen NK, Kwong KK, Bush A, Fox J, Hersch SM. Alterations in brain transition metals in Huntington disease: an evolving and intricate story. Arch Neurol. 2012;69:887–893. doi: 10.1001/archneurol.2011.2945. [DOI] [PMC free article] [PubMed] [Google Scholar]
- 5.Perl DP, Olanow CW. The neuropathology of manganese-induced Parkinsonism. J Neuropathol Exp Neurol. 2007;66:675–682. doi: 10.1097/nen.0b013e31812503cf. [DOI] [PubMed] [Google Scholar]
- 6.Quinones M, Cofre J, Benitez J, Garcia D, Romero N, Gonzalez A, Carvajal N, Garcia M, Lopez V, Schenk G, Uribe E. Insight on the interaction of an agmatinase-like protein with Mn(2+) activator ions. J Inorg Biochem. 2015;145:65–69. doi: 10.1016/j.jinorgbio.2015.01.008. [DOI] [PubMed] [Google Scholar]
- 7.Gruber B, Klaczkow G, Jaworska M, Krzyszton-Russjan J, Anuszewska EL, Zielonka D, Klimberg A, Marcinkowski JT. Huntington’ disease--imbalance of amino acid levels in plasma of patients and mutation carriers. Ann Agric Environ Med. 2013;20:779–783. [PubMed] [Google Scholar]
- 8.Chiang MC, Chen HM, Lai HL, Chen HW, Chou SY, Chen CM, Tsai FJ, Chern Y. The A2A adenosine receptor rescues the urea cycle deficiency of Huntington’s disease by enhancing the activity of the ubiquitin-proteasome system. Hum Mol Genet. 2009;18:2929–2942. doi: 10.1093/hmg/ddp230. [DOI] [PubMed] [Google Scholar]
- 9.Patassini S, Begley P, Reid SJ, Xu J, Church SJ, Curtis M, Dragunow M, Waldvogel HJ, Unwin RD, Snell RG, Faull RL, Cooper GJ. Identification of elevated urea as a severe, ubiquitous metabolic defect in the brain of patients with Huntington’s disease. Biochem Biophys Res Commun. 2015;468:161–166. doi: 10.1016/j.bbrc.2015.10.140. [DOI] [PubMed] [Google Scholar]
- 10.Patassini S, Begley P, Xu J, Church SJ, Reid SJ, Kim EH, Curtis MA, Dragunow M, Waldvogel HJ, Snell RG, Unwin RD, Faull RL, Cooper GJ. Metabolite mapping reveals severe widespread perturbation of multiple metabolic processes in Huntington’s disease human brain. Biochim Biophys Acta. 2016;1862:1650–1662. doi: 10.1016/j.bbadis.2016.06.002. [DOI] [PubMed] [Google Scholar]
- 11.Narayanan SP, Suwanpradid J, Saul A, Xu Z, Still A, Caldwell RW, Caldwell RB. Arginase 2 deletion reduces neuro-glial injury and improves retinal function in a model of retinopathy of prematurity. PLoS One. 2011;6:e22460. doi: 10.1371/journal.pone.0022460. [DOI] [PMC free article] [PubMed] [Google Scholar]
- 12.Wiesinger H. Arginine metabolism and the synthesis of nitric oxide in the nervous system. Prog Neurobiol. 2001;64:365–391. doi: 10.1016/s0301-0082(00)00056-3. [DOI] [PubMed] [Google Scholar]
- 13.Perez-Severiano F, Escalante B, Vergara P, Rios C, Segovia J. Age-dependent changes in nitric oxide synthase activity and protein expression in striata of mice transgenic for the Huntington’s disease mutation. Brain Res. 2002;951:36–42. doi: 10.1016/s0006-8993(02)03102-5. [DOI] [PubMed] [Google Scholar]
- 14.Dodd CA, Ward DL, Klein BG. Basal Ganglia accumulation and motor assessment following manganese chloride exposure in the C57BL/6 mouse. Int J Toxicol. 2005;24:389–397. doi: 10.1080/10915810500366500. [DOI] [PubMed] [Google Scholar]
- 15.Wegrzynowicz M, Holt HK, Friedman DB, Bowman AB. Changes in the striatal proteome of YAC128Q mice exhibit gene-environment interactions between mutant huntingtin and manganese. J Proteome Res. 2012;11:1118–1132. doi: 10.1021/pr200839d. [DOI] [PMC free article] [PubMed] [Google Scholar]
- 16.Franciosi S, Ryu JK, Shim Y, Hill A, Connolly C, Hayden MR, McLarnon JG, Leavitt BR. Age-dependent neurovascular abnormalities and altered microglial morphology in the YAC128 mouse model of Huntington disease. Neurobiol Dis. 2012;45:438–449. doi: 10.1016/j.nbd.2011.09.003. [DOI] [PubMed] [Google Scholar]
- 17.Madison JL, Wegrzynowicz M, Aschner M, Bowman AB. Disease-toxicant interactions in manganese exposed Huntington disease mice: early changes in striatal neuron morphology and dopamine metabolism. PLoS One. 2012;7:e31024. doi: 10.1371/journal.pone.0031024. [DOI] [PMC free article] [PubMed] [Google Scholar]
- 18.Bowman AB, Aschner M. Considerations on manganese (Mn) treatments for in vitro studies. Neurotoxicology. 2014;41:141–142. doi: 10.1016/j.neuro.2014.01.010. [DOI] [PMC free article] [PubMed] [Google Scholar]
- 19.Williams BJ, Du RH, Calcutt MW, Abdolrasulnia R, Christman BW, Blackwell TS. Discovery of an operon that participates in agmatine metabolism and regulates biofilm formation in Pseudomonas aeruginosa. Mol Microbiol. 2010;76:104–119. doi: 10.1111/j.1365-2958.2010.07083.x. [DOI] [PMC free article] [PubMed] [Google Scholar]
- 20.Wynn TA, Barron L, Thompson RW, Madala SK, Wilson MS, Cheever AW, Ramalingam T. Quantitative assessment of macrophage functions in repair and fibrosis. Curr Protoc Immunol. 2011;Chapter 14(Unit14):22. doi: 10.1002/0471142735.im1422s93. [DOI] [PMC free article] [PubMed] [Google Scholar]
- 21.Garcia D, Ordenes P, Benitez J, Gonzalez A, Garcia-Robles MA, Lopez V, Carvajal N, Uribe E. Cloning of two LIMCH1 isoforms: characterization of their distribution in rat brain and their agmatinase activity. Histochem Cell Biol. 2016;145:305–313. doi: 10.1007/s00418-015-1389-0. [DOI] [PubMed] [Google Scholar]
- 22.Li JY, Popovic N, Brundin P. The use of the R6 transgenic mouse models of Huntington’s disease in attempts to develop novel therapeutic strategies. NeuroRx. 2005;2:447–464. doi: 10.1602/neurorx.2.3.447. [DOI] [PMC free article] [PubMed] [Google Scholar]
- 23.Romero PA, Stone E, Lamb C, Chantranupong L, Krause A, Miklos AE, Hughes RA, Fechtel B, Ellington AD, Arnold FH, Georgiou G. SCHEMA-designed variants of human Arginase I and II reveal sequence elements important to stability and catalysis. ACS Synth Biol. 2012;1:221–228. doi: 10.1021/sb300014t. [DOI] [PMC free article] [PubMed] [Google Scholar]
- 24.Ramos P, Santos A, Pinto NR, Mendes R, Magalhaes T, Almeida A. Anatomical region differences and age-related changes in copper, zinc, and manganese levels in the human brain. Biol Trace Elem Res. 2014;161:190–201. doi: 10.1007/s12011-014-0093-6. [DOI] [PubMed] [Google Scholar]
- 25.Cahoy JD, Emery B, Kaushal A, Foo LC, Zamanian JL, Christopherson KS, Xing Y, Lubischer JL, Krieg PA, Krupenko SA, Thompson WJ, Barres BA. A transcriptome database for astrocytes, neurons, and oligodendrocytes: a new resource for understanding brain development and function. J Neurosci. 2008;28:264–278. doi: 10.1523/JNEUROSCI.4178-07.2008. [DOI] [PMC free article] [PubMed] [Google Scholar]
- 26.Chen F, Lucas R, Fulton D. The subcellular compartmentalization of arginine metabolizing enzymes and their role in endothelial dysfunction. Front Immunol. 2013;4:184. doi: 10.3389/fimmu.2013.00184. [DOI] [PMC free article] [PubMed] [Google Scholar]
- 27.Gunter TE, Gavin CE, Aschner M, Gunter KK. Speciation of manganese in cells and mitochondria: a search for the proximal cause of manganese neurotoxicity. Neurotoxicology. 2006;27:765–776. doi: 10.1016/j.neuro.2006.05.002. [DOI] [PubMed] [Google Scholar]
- 28.Langfelder P, Cantle JP, Chatzopoulou D, Wang N, Gao F, Al-Ramahi I, Lu XH, Ramos EM, El-Zein K, Zhao Y, Deverasetty S, Tebbe A, Schaab C, Lavery DJ, Howland D, Kwak S, Botas J, Aaronson JS, Rosinski J, Coppola G, Horvath S, Yang XW. Integrated genomics and proteomics define huntingtin CAG length-dependent networks in mice. Nat Neurosci. 2016 doi: 10.1038/nn.4256. [DOI] [PMC free article] [PubMed] [Google Scholar]
- 29.Doyle JP, Dougherty JD, Heiman M, Schmidt EF, Stevens TR, Ma G, Bupp S, Shrestha P, Shah RD, Doughty ML, Gong S, Greengard P, Heintz N. Application of a translational profiling approach for the comparative analysis of CNS cell types. Cell. 2008;135:749–762. doi: 10.1016/j.cell.2008.10.029. [DOI] [PMC free article] [PubMed] [Google Scholar]
- 30.Madison JL, Wegrzynowicz M, Aschner M, Bowman AB. Gender and manganese exposure interactions on mouse striatal neuron morphology. Neurotoxicology. 2011;32:896–906. doi: 10.1016/j.neuro.2011.05.007. [DOI] [PMC free article] [PubMed] [Google Scholar]
- 31.Streifel KM, Moreno JA, Hanneman WH, Legare ME, Tjalkens RB. Gene deletion of nos2 protects against manganese-induced neurological dysfunction in juvenile mice. Toxicol Sci. 2012;126:183–192. doi: 10.1093/toxsci/kfr335. [DOI] [PMC free article] [PubMed] [Google Scholar]
- 32.Chicoine LG, Paffett ML, Young TL, Nelin LD. Arginase inhibition increases nitric oxide production in bovine pulmonary arterial endothelial cells. Am J Physiol Lung Cell Mol Physiol. 2004;287:L60–68. doi: 10.1152/ajplung.00194.2003. [DOI] [PubMed] [Google Scholar]
- 33.Ahmad AS, Shah ZA, Dore S. Protective Role of Arginase II in Cerebral Ischemia and Excitotoxicity. J Neurol Neurosci. 2016;7 doi: 10.21767/2171-6625.100088. [DOI] [PMC free article] [PubMed] [Google Scholar]
- 34.Suwanpradid J, Rojas M, Behzadian MA, Caldwell RW, Caldwell RB. Arginase 2 deficiency prevents oxidative stress and limits hyperoxia-induced retinal vascular degeneration. PLoS One. 2014;9:e110604. doi: 10.1371/journal.pone.0110604. [DOI] [PMC free article] [PubMed] [Google Scholar]
- 35.Pandey D, Sikka G, Bergman Y, Kim JH, Ryoo S, Romer L, Berkowitz D. Transcriptional regulation of endothelial arginase 2 by histone deacetylase 2. Arterioscler Thromb Vasc Biol. 2014;34:1556–1566. doi: 10.1161/ATVBAHA.114.303685. [DOI] [PMC free article] [PubMed] [Google Scholar]
- 36.Mangiarini L, Sathasivam K, Seller M, Cozens B, Harper A, Hetherington C, Lawton M, Trottier Y, Lehrach H, Davies SW, Bates GP. Exon 1 of the HD gene with an expanded CAG repeat is sufficient to cause a progressive neurological phenotype in transgenic mice. Cell. 1996;87:493–506. doi: 10.1016/s0092-8674(00)81369-0. [DOI] [PubMed] [Google Scholar]
- 37.Kuhn NJ, Talbot J, Ward S. pH-sensitive control of arginase by Mn(II) ions at submicromolar concentrations. Arch Biochem Biophys. 1991;286:217–221. doi: 10.1016/0003-9861(91)90031-d. [DOI] [PubMed] [Google Scholar]
- 38.Iyer RK, Yoo PK, Kern RM, Rozengurt N, Tsoa R, O’Brien WE, Yu H, Grody WW, Cederbaum SD. Mouse model for human arginase deficiency. Mol Cell Biol. 2002;22:4491–4498. doi: 10.1128/MCB.22.13.4491-4498.2002. [DOI] [PMC free article] [PubMed] [Google Scholar]
- 39.Shi O, Morris SM, Jr, Zoghbi H, Porter CW, O’Brien WE. Generation of a mouse model for arginase II deficiency by targeted disruption of the arginase II gene. Mol Cell Biol. 2001;21:811–813. doi: 10.1128/MCB.21.3.811-813.2001. [DOI] [PMC free article] [PubMed] [Google Scholar]
Associated Data
This section collects any data citations, data availability statements, or supplementary materials included in this article.
Supplementary Materials
Supplemental Fig. 1. Arginine (Arg) is the most abundant of the direct urea cycle metabolites found in striatum and agmatine (Agm) is the least [citrulline (Cit), ornithine (Orn), putrecine (Put)]. Related metabolites, spermidine (Spmd), spermine (Spm), though more abundant, were not significantly affected by genotype or exposure. Striatal tissue from male, FVB, 13 week old, WT, vehicle-exposed animals, metabolites measured by Laser Coupled Mass Spectroscopy (LCMS), normalized to homo-agmatine, fmol/ug, n=6–8. Data are presented as means +sem on log2 scale.
Supplemental Table 1. Protein Expression, Striatum, 6 months of Age, Langfelder et al [27]
Red arrows in (a–c) indicate parameters used in the assay. (A) Arginase activity is time-dependent (liver tissue, thus primarily ARG1) incubated at 0, 30, and 90 minutes at 37° after addition of substrate solution, subtracting background (raw value at zero time point) from all data points. Significant effect of time by univariate ANOVA: WT Mn [F(2,6)=146.2, p<.0001], WT Veh [F(2,6)=15.53, p<.0042]. (B) Arginase activity is arginine-dependent (kidney tissue, thus primarily ARG2), Km=324.8 mM Arg, Vmax standards completed without added arginine. (C) Arginase activity is dependent on the co-factor Mn (kidney tissue, thus primarily ARG2). Data shown is arginase activity induced by supplemental Mn, Ka=0.377mM Mn, Vmax The increase in arginase activity is not explained simply by the amount of striatal Mn in Mn-exposed animals, because in vivo Mn exposure itself is not calculated to raise the concentration of endogenous Mn in the ex vivo striatal extracts higher than 0.8 μM in striatum[17]. We used 2.5 mM Mn as in the published assay[20], which is well above the amount needed to stimulate arginase activity[37]. (D) Extracted urea concentration measured in undialysed striatal samples, FVB, n=3, not significant by two-way ANOVA. Michaelis-Menten parameters calculated with GraphPad Prism.
(A) Arginase activity, vehicle (Veh): n=6 mice, 2 experiments. (B) The same samples as in (A) subsequently activated with Mn ex vivo. . YAC128Q model male mice, C57 background, 13 weeks of age. Data presented as +sem, *p<.05, **p<.01, ***p<.001, ****p<.0001, post-hoc binary comparisons by t-test following a significant (p=<.05) ANOVA.
Shown in (A) and (B) are the same samples of WT, FVB, vehicle-exposed striatum (Str), liver (Liv) and kidney (Kid) run on different gels with two different ARG1 antibodies (A) Abcam, (B) Proteintech, and additional striatal samples exposed to Millipore shown in (C), ladder (lad). ARG1 protein is observed as a doublet band at approximately 35–37kDa with all three antibodies in liver tissue and is absent from kidney and striatum. There were strong, non-specific bands at other molecular weights with the Proteintech antibody. (D) Mn exposure did not affect hepatic ARG1 protein levels (Abcam ab91279), samples from YAC128Q mutant (HD) or wildtype (WT), 13 week old male mice. (E) Quantification of ARG1/ACTIN normalized to WT-Vehicle (Veh), n=3. Data presented as +sem.
Shown are representative blots on the same samples run on three different gels and exposed to three different antibodies (A) Abcam, (B) Proteintech, (C) and (D) Santa Cruz; vehicle (Veh). These blots have only one band in common, at 37kDa, and this band shows the same pattern of change for all three after in vivo Mn exposure, suggesting that all other bands are non-specific and may be cross-reacting with ARG1. (D) Striatal tissue (40μg) from ARG1 heterozygous knockout[38] and ARG2 homozygous knockout[39] mouse with WT kidney (Kid) (20μg) and striatum (Str) for controls. For experiments shown in Fig. 2, Fig 3 and Supplemental Fig. 5 we used sc-20151 because it had no evidence of cross-reactivity. Quantifications are ARG2/ACTIN, normed to WT Veh, FVB, +sem, post-hoc binary comparisons by t-test following a significant (p=<.05) ANOVA, *p=<.05, ***p<.001.
(A) ARG1 (ab91279), ARG2 (sc-20151) and LIMCH1 (Abcam ab96178 at 150kDa) in cerebellum. Striatal tissue used as control. (B) LIMCH1 in cortex (Ctx), prefrontal cortex (Pfctx), and hippocampus (Hip), 40μgs/lane of each tissue, striatal tissue used as control (Abcam ab96178). (C) Quantification of LIMCH1 vs. ARG2 in cortex, normalized to Str WT Veh, n=3. (D) Quantification of ARG2 protein (sc-20151), FVB kid (n=6, *p=.05), FVB pfctx (n=3 experiments, ***p=.001), FVB ctx (n=3 *p=.01, #p=.028), FVB hip (n=6, *p=.0253, **p=.0013, #p=.0076), representative blots shown in Figure. 2c. Ctx and Pfctx protein levels are very low relative to Str (see Figure. 2b). Data are presented as means +s.e.m post-hoc binary comparisons by t-test following a significant (p=<.05) ANOVA.
ARG2 (sc-20151)/ACTIN normalized to WT-13week-Veh-Str on each blot. Striatal tissue from females, aged to 42 weeks, FVB background, n=4,6. Data are presented as means +s.e.m, comparisons by t-test following a significant (p=<.05) ANOVA. ARG2 is significantly elevated (p<0.0001 for WT, p=.0226 for HD) by Mn-exposure above vehicle (vehicle data plotted in Fig. 3D); with no differences in ARG2 levels between genotypes following Mn-exposure (p=0.18).
(A) and (B) Z-score change in protein by CAG repeat length compared to 20 CAG repeats, using striatal tissue from 6 month old mice with CAG repeats inserted into exon 1 of a human/mouse Htt. (A) Striatal ARG2 and (B) Striatal LIMCH1. Table of results and significance for data shown in Supplemental Table 1.