Abstract
Background
During ablation for atrial fibrillation (AF), it is challenging to anticipate transitions to organized tachycardia (AT). Defining indices of this transition may help to understand fibrillatory conduction and help track therapy.
Objective
To determine the timescale over which atrial fibrillation (AF) organizes en route to atrial tachycardia (AT) using the ECG referenced to intracardiac electrograms.
Methods
In 17 AF patients at ablation (58.7±9.6 years; 53% persistent AF) we analyzed spatial loops of atrial activity on the ECG and intracardiac electrograms over successive timepoints. Loops were tracked at precisely 15, 10, 5, 3 and 1 minute prior to defined transitions of AF to AT.
Results
Organizational indices reliably quantified changes from AF to AT. Spatiotemporal AF organization on the ECG was identifiable at least 15 minutes before AT was established (p=0.02).
Conclusions
AF shows anticipatory global organization on the ECG minutes before AT is clinically evident. These results offer a foundation to establish when AF therapy is on an effective path, and for a quantitative classification separating AT from AF.
Keywords: Atrial tachycardia, fibrillation, ECG, signal processing, ablation
INTRODUCTION
Atrial fibrillation (AF) is the most common sustained arrhythmia in the world and a leading cause of hospitalization and death. Ablation is a widely used alternative to drug strategies to eliminate AF, but there are few indices to monitor whether current lesion sets are effectively organizing the arrhythmia or not. Hence, while AF frequently transitions to atrial tachycardia (AT) (Figure 1), it is undefined if this organization occurs abruptly or gradually, and over what time period. This has mechanistic implications and hinders the development of indices to guide therapy.
Figure 1.
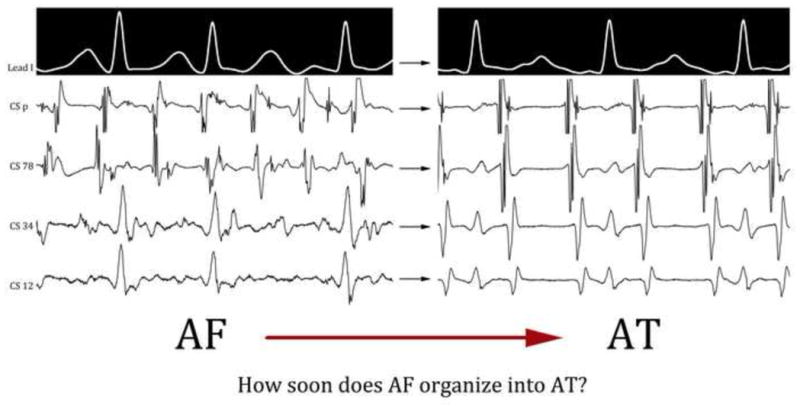
Transition from AF to AT in a 33 year old male with persistent AF. The tracings were recorded 90 seconds from each other, and clinically, this appears to be an abrupt transition during ablation on visual inspection of surface and intracardiac electrograms
We hypothesized that organization of AF towards AT may show stereotypical spatial patterns. This followed from our reasoning that AF termination to AT may reflect elimination of localized AF sources leaving a residual source (1), the anchoring of wavelets to ablation lesions (2), or the extensive compartmentalization of wavelets to organize them (3), that are often encountered clinically yet rarely tracked.
We set out to test our hypothesis by studying electrophysiologic organization transitions from AF to organized AT or atrial flutter in patients undergoing ablation for atrial fibrillation, using quantitative analyses of continuous ECG and intracardiac recordings.
METHODS
Clinical Protocol
We recruited 17 consecutive patients with AF undergoing ablation for routine clinical indications in whom ablation transitioned AF to organized atrial tachycardia. Patients were >21 years of age with AF refractory to at least 1 anti-arrhythmic medication, and were studied according to the Institutional Review Board of the University of California, San Diego.
All patients underwent clinical electrophysiological study after discontinuing anti-arrhythmic medications for at least 5 half-lives except amiodarone (>30 days). In addition to routine catheters, all patients had intracardiac recordings selected in predetermined locations in the proximal coronary sinus, distal coronary sinus, and one additional intracardiac electrode in left or right atria. Right atrial data were unavailable in one patient.
AF ablation proceeded via the standard-of-care approach of pulmonary vein isolation with substrate ablation in the left or right atria depending on clinical judgement. Extensive linear ablation was not performed in this series. In each case in this series, ablation converted AF to organized atrial tachycardia, which was also ablated in standard fashion using activation and entrainment mapping.
Rhythm Diagnosis
All studies were performed in AF. Patients either presented initially in AF, or if in sinus rhythm, AF was induced with pacing and allowed to continue for >10 minutes before mapping was pursued. Patients presenting with clinical atrial tachycardia, those whose AF terminated in <10 minutes or those without continuous electrophysiological recordings at transitions from AF to AT were not included in this population.
Atrial fibrillation was defined in usual fashion as varying temporal and spatial atrial activation, using variable F-wave shape and cycle lengths on the ECG and in coronary sinus activation sequence (i.e. between CS electrodes) and timing (i.e. over time).
Organized atrial tachycardia was diagnosed as reproducible activation sequence, defined as consistent F-wave shape on the ECG or between CS electrodes. Macro-reentrant AT was confirmed by concealed entrainment and successful ablation (4,5), focal AT by intra-atrial activation occupying a short proportion of the tachycardia cycle arising from a small location (4) and confirmed by successful ablation (6). Electroanatomic mapping systems were used when needed.
Measuring Epochs of Organization
First, we observed AF during a baseline period of 15 minutes prior to ablation under an IRB-approved protocol. Organizational indices were computed in this period to assess baseline. Second, we studied organization from AF to AT during ablation. The study design was to examine spatiotemporal dynamics of AF relative to the time of AT onset.
The transition from AF to AT was defined to ~1 second resolution by careful evaluation of annotated digital intracardiac and ECG recordings (Bard LabSystem Pro, Billerica, MA). The time point when spatial variations in atrial electrogram sequence (e.g. between CS electrodes) disappeared was considered the transition time to AT, confirmed by the consensus between 3 observers (TB, RT, JZ).
Acquisition of Data and Data Processing
We recorded 12-lead surface ECGs (0.05–100 Hz bandpass-filtered) and bipolar intracardiac electrograms (30–250 Hz), each of which was digitized at 1kHz and exported from our recorder (Bard, Billerica, MA). ECG analysis was performed on a PC using software developed by SMN in Labview (National Instruments, TX) (7). ECG analysis used leads V5, aVF and V1 to represent orthogonal leads X, Y and Z, respectively (Figure 2A). Intracardiac electrograms were obtained from Coronary Sinus (CS) proximal, CS distal and a bipole at the right atrial free wall (during right atrial ablation) or left atrial lateral wall (during left atrial ablation), analyzed at 200 mm/sec scale. Analysis was applied directly to each selected ECG or intracardiac leads (8).
Figure 2. Methodology for Spatiotemporal Organizational Indices.
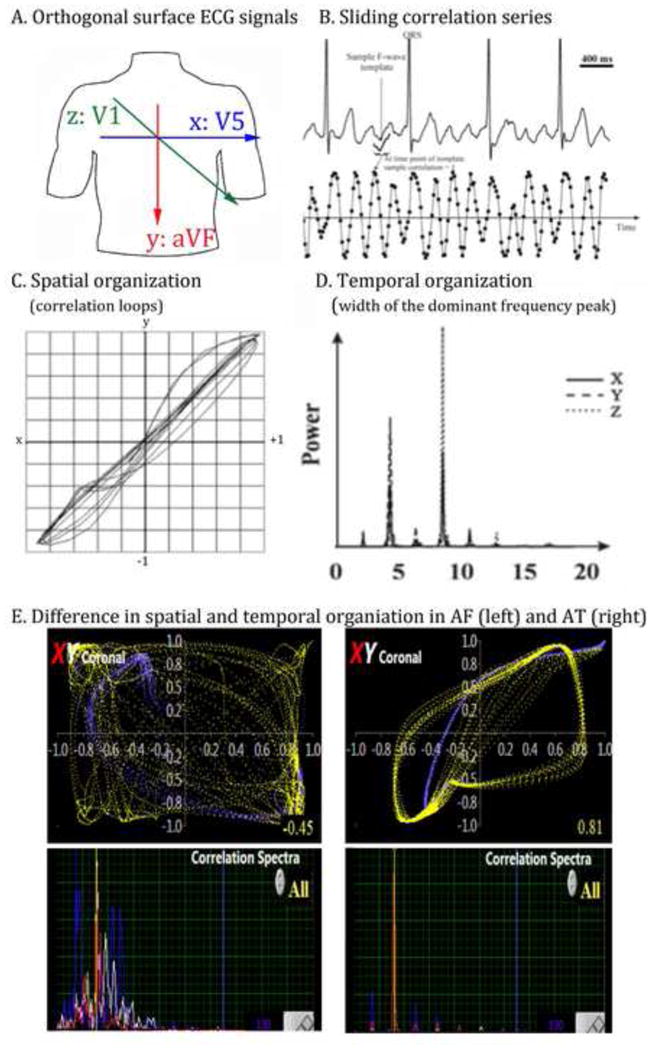
A. Orthogonal surface electrodes are used to measure activation (spatial) and rate (temporal) organization. B. Sliding correlation series at each ECG lead (and intra-cardiac electrode location) is measured. C. Correlation loops are generated for spatial organization; D. Spectral analysis shows regularity (narrow peaks, in AT). E. Higher spatial (top) and temporal (bottom) organization in AT (right) compared to AF (left). Width of the dominant frequency is greater for AF (i.e. less temporally organized) than for AT.
Measures of Spatiotemporal Organization
Organization was assessed using loops of atrial activity over time using our described (7,9) and validated (10) method of generating time series of successive correlations to an atrial electrogram. This has the effect of filtering QRS complexes. In the XY plane, phase was computed by plotting X- versus Y-axis correlation-time series (for the ECG, leads V5 versus aVF) at each time-point (Fig. 2A–C); similarly for YZ (aVF/V1) and XZ (V5/V1) planes. This resulted in loops for successive cycles that represent spatial regularity. We also analyzed dominant frequency using a 8192 point Fast Fourier Transform to measure organization.
Correlation Analysis
ECG F-waves were represented by a 120-ms sample selected to avoid isoelectric ECG segments, preceding a subsequent QRS complex. This was adjusted manually, if necessary, to avoid T waves. Each 120ms sample was then cross-correlated to its original electrogram channel at successive time-points using the Pearson coefficient on M pairs of data (Ak+i, Bj+i), where Ak+i and Bj+i are corresponding points of the F-wave sample and native ECG:
where rj is the coefficient at the jth timepoint; j ranges from the first ECG point to Q-M, (0 ≤j ≤Q-M), Q being the last ECG point. k ranges from L to L+M (0≤L≤Q-M). Repeating this operation for all ECG time points results in correlation-time series. Figure 2B–C shows this analysis, where r approximates 1 when F waves recur, and ranges from −1 to +1 elsewhere. The resulting correlation time-series reflects atrial activity across the selected channel (ECG or intracardiac) by normalizing the F-wave amplitude and reducing the magnitude of variations during the arrhythmia (Figure 2B).
Organized atrial wavefronts should maintain spatial vectors over time, so that plots should co-vary between axes over time with loops approaching (1,1). We applied the term spatial regularity (temporospatial coherence) if the upper right turnaround point of each loop passed (0.75, 0.75) in each plane. In 3-axes, this was indicated by distance from the origin R ≥ √(0.752+0.752+0.752); i.e. R ≥ 1.30. For loop reproducibility, we applied SD of R ≤ 0.15 (11).
Continuous Assessment of Spatiotemporal Organization
The time of AF to AT transition was designated time zero, and indices of organization determined up to this time. First, we measured baseline indices in AF at 15–30 minutes prior to AT. Second, we measured spatiotemporal organization at 15, 10, 5, 3 and 1 minute prior to AT onset. Third, we measured spatiotemporal organization at 1 minute post AT onset.
Statistical Analysis and Sample Size Considerations
Continuous variables were presented as mean ± standard deviation (SD). The two-tailed t-test was used to compare continuous variables between groups. Because of the small sample sizes, exact confidence limits for sensitivity and specificity were computed using binomial probabilities. Probabilities below 5% (p < 0.05) were considered significant.
A one-way repeated measures ANOVA was conducted to determine whether there were statistically significant differences in spatial and temporal correlation coefficients over the course of 15 minutes prior to AF to AT transitions. There were few outliers and the data was mostly normally distributed, as assessed by Shapiro-Wilk test (p > .05). If the assumption of sphericity was violated, as assessed by Mauchly’s test of sphericity, a Greenhouse-Geisser correction was applied. A mixed ANOVA test was used to determine whether there were statistically significant differences in spatial correlation coefficients in patients who remained stable in AF for 15 minutes versus patients who had AF-AT transition over the course of 15 minutes.
RESULTS
Demographics
Table 1 summarizes the clinical characteristics of all patients. The cohort consisted of 17 patients with age 58.7±9.0 years and approximately equal numbers with paroxysmal and persistent AF.
Table 1.
Patient Characteristics
| Demographics | N=17 |
|---|---|
| Age (years) | 58.7±9.6 |
| Hypertension | 14 (82%) |
| Diabetes Mellitus | 1 (6%) |
| Hyperlipidemia | 12 (71%) |
| Obstructive Sleap Apnea | 10 (59%) |
| Congestive Heart Failure | 7 (41.2) |
| Left ventricular ejection fraction (%) | 51.4±20.4 |
| Left atrial diameter (mm) | 43.1±5.9 |
| CHADS2 Score | 1.4±1.0 |
|
| |
| AF characteristics | |
|
| |
| Persistent/Paroxysmal AF | 9/8 (53%) |
| AF history (days) | 2230±2380 |
| Prior atrial fibrillation Ablation | 7 (41%) |
Evaluation of Stability of Organization Indices in AF (Baseline)
Baseline stability of AF, measured by our organizational indices, was established for 15 minutes. Figure 3A, left panel shows spatiotemporal indices of organization in a predetermined baseline subset of patients. These individuals were observed during AF under an IRB-approved protocol for >30 minutes with no interventions and no rhythm transitions (n=5). Spatial organization in these patients during ‘stable AF’ was −0.10±0.23, with no trends and hence indicating reproducibility of these metrics during baseline AF (Figure 3A).
Figure 3.
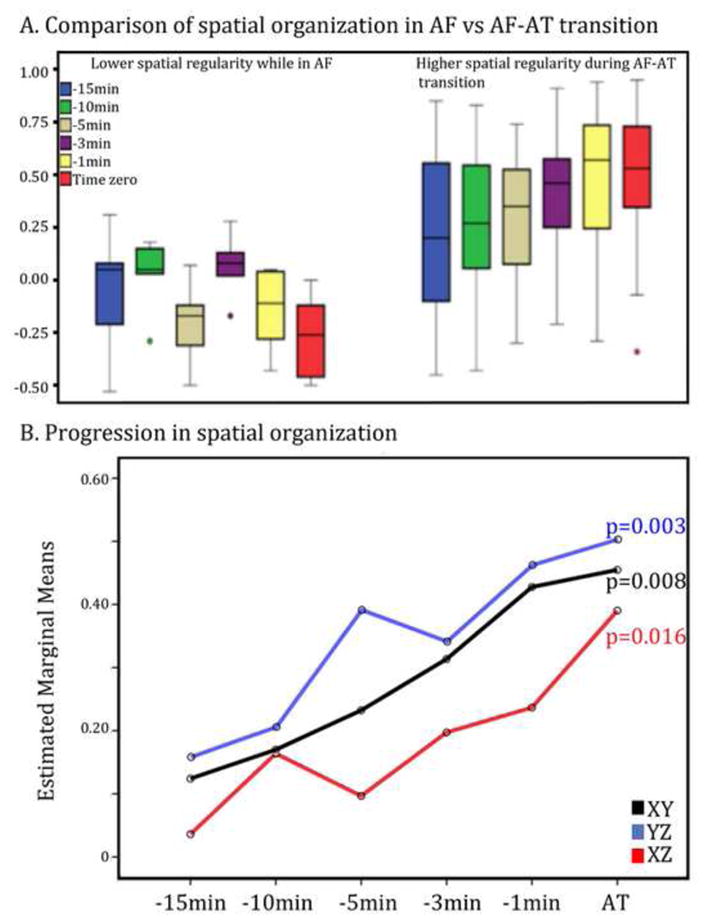
A. Spatial organization index in XY plane (ECG: V5-aVF) is low and stable during AF over 30 minutes (left cluster); and elevates at incremental time points culminating in AT (red; right cluster). B. Spatial organization index (y-axis) for the group is summarized at time points culminating in AT. In both panels; X, Y, Z leads represent surface ECG leads V5, aVF and V1 respectively; X axis: time, Y axis: spatial organizational index.
Evolution Of Spatiotemporal Organization During Transitions to AT
We detected a gradual spatial organization on the ECG during the 15 minutes from AF to defined AT. Figure 3B indicates that spatial correlation coefficients increased in the XY plane (p=0.008), YZ plane (p=0.003) and in the XZ plane (p=0.016) across patients.
In a 56 year old male with undergoing AF ablation, figure 4 demonstrates ECG metrics during transition from AF to AT by ablation. Gradual spatial organization is shown in the correlation loops in all 3 planes (XY, YZ, XZ; middle panels) as well as temporal correlation spectra (bottom panel).
Figure 4.
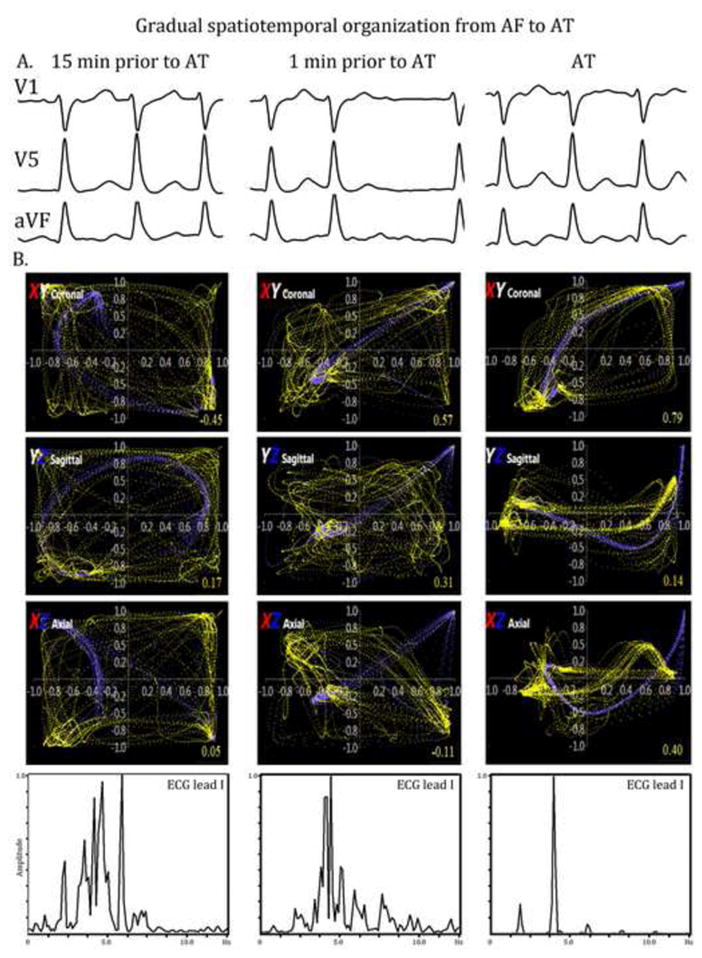
A. ECGs of AF over 15 minutes culminating in AT (leads V1, aVF, V5 shown). B. Gradual spatial (top panels) and temporal (bottom panel) organization in a 56 year-old man during AF ablation. X, Y, Z leads represent surface ECG leads V5, aVF and V1 respectively.
Intracardiac Spatial Organization
Intracardiac leads showed abrupt increases in organization the time of AT onset, at predetermined locations (coronary sinus, lateral right atrial wall or left atrial wall). Temporal organization had a similar abrupt increase at the time of AT in intracardiac planes. (Figure 5)
Figure 5.
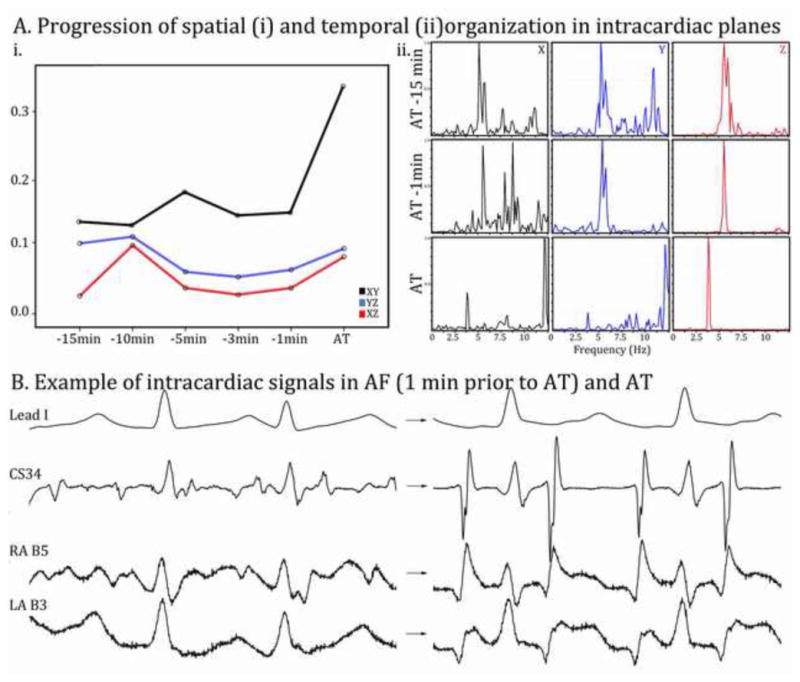
A (i, ii). Abrupt rather than gradual organization is observed in intracardiac leads. X: CS proximal electrode, Y: CS distal, Z: intracardiac electrodes on spatial loops (graph) and dominant frequency analysis. B. Example of signals used for intracardiac planes: CS electrode, RA basket catheter electrode B-5, LA basket catheter electrode B-3.
Discussion
This study shows that the organization of AF by ablation en route to AT was not abrupt, as suggested by clinical experience, but gradual over a period of several minutes before AT was established. Thus, rather than dichotomizing AF and AT as disorganized or organized, respectively, it may be more accurate to place both rhythms along a continuous spectrum that can be tracked quantitatively. This extends the variability detected in otherwise regular non-cavotricuspid isthmus dependent macro-reentry (9,12,13) or forms of focal AT (14), or the ‘regularization’ in AF sometimes apparent to the naked eye. Results from this study provide spatiotemporal indices that could be used to track effective ablation lesion sets during ongoing AF ablation, to identify times of organization when cardioversion may require less energy, or ultimately for a functional classification of AF that enables therapy to be tailored to individual phenotypes.
Mechanistic Insights into AF Organization to AT
The gradual ‘anticipatory’ organization in this study on the ECG but abrupt organization on intracardiac tracings extend prior reports that AF organizes quantitatively with antiarrhytmic drugs (15) and that organization can guide cardioversion (16). Interpretation of the time course of organization depends on the model of AF mechanisms, that fall into two camps. The prolonged timecourse of organization concurs with recent studies (17) that showed a stepwise organization consistent with localized rotors.
The localized rotor hypothesis of AF is supported by clinical evidence from many centers (18–20) and is supported by optical studies of AF in human atria. Results of our study could be consistent with this model, in which AF transitions to AT by progressive elimination of fibrillatory conduction or progressive extinction of sources to leave a focal or reentrant AT.
Alternatively, the disorganized or non-hierarchical model of AF posits that wavelets self-sustain, with no spatially localized source (21). Our study may also support this model, in which AF likely transitions to AT by constraining wavelets over time. Further studies are required to determine if spatial planes of preferred organization (e.g. ECG planes YZ) reflect a preponderence of localized sources in that plane, or potentially more organized multiple wavelets in that plane.
Difference between ECG and Intracardiac Organization
Gradual ‘anticipatory’ organization on the ECG but abrupt organization on intracardiac tracings may reflect the global view of the ECG, versus focused fields of a specific electrode potentially remote from primary regions of organization. The ECG provides a global view of cardiac activity, weighted physiologically. For instance, organization in plane YZ (leads aVF/V1) may reflect the fact that the RA is better represented on the surface ECG than the LA, due to the more posterior location of the LA relative to the anterior standard ECG leads (22) (23).
Intracardiac organization is likely exquisitely sensitive to placement of each small bipolar electrode relative each AF mechanism. Indeed, we have reported that electrograms can be highly organized near localized AF sources yet disorganized at neighboring sites (24). Similarly, regularity in AT on intracardiac electrodes also reflects their anatomic distance from the AT circuit, and electrograms may be less regular at a distance (9). This may explain differences between surface and intracardiac trends in organization.
Clinical Implications
During AF ablation, it is often clinically unclear if the ongoing ablation lesions have an impact on the organization of the underlying rhythm; or which lesions have more impact. This study provides spatiotemporal indices that may track effective ablation, or to identify times when cardioversion may require less energy. These results also may provide a mechanistic basis for individualized phenotyping, for instance those with relatively organized AF who may respond better to antiarrhythmic medications. Such ECG based classifications have been proposed by others (25). These hypotheses require further testing.
Limitations
This study does not address the clinical scenario in which AF interconverts to and from AT. However, that scenario is uncommon. The more common scenario is abrupt conversions of paroxysmal AF mostly to and from sinus rhythm. This likely differs in mechanism from the transitions from AF to AT studied here.
Other limitations include the lack of women, but prior studies have shown no clear gender differences in AF temporal or spatial characteristics between genders. The study was small, in part because of the need for datasets measuring intracardiac organization from consistent spatial electrode positions during ablation for tens of minutes preceding conversions to AT. Nevertheless, studies in larger populations are planned.
Conclusions
During ablation, AF shows anticipatory organization minutes before it converts to AT. This organization is evident spatially and temporally, and is best indicated by global analyses from the ECG. Studies should determine how this anticipatory organization may guide clinical ablation, individualization of antiarrhythmic drug use and whether such indices may help in forming a quantitative classification separating AT from AF.
Highlights.
During ablation, organization of AF to AT was not abrupt, as suggested by clinical experience, but gradual over a period of several minutes before AT was established.
This organization is evident spatially and temporally, and is best indicated by global analyses from the ECG.
Future studies could determine how this anticipatory organization may guide clinical ablation, individualization of antiarrhythmic drug use and whether such indices may help in forming a quantitative classification separating AT from AF.
Acknowledgments
We are grateful to Paul Clopton, MS, for statistical advice, and to Kathleen Mills, BA, for helping to coordinate these studies.
Footnotes
Disclosures
Dr. Baykaner: None
Mr. Trikha: None
Dr. Zaman: None
Dr. Krummen: Fellowship support from Medtronic, Boston Scientific, St. Jude Medical and Biotronik.
Dr Wang: None
Dr. Narayan: Co-inventor on intellectual property owned by the University of California and licensed to Topera Medical, Inc; held equity in Topera; received honoraria from Medtronic and St. Jude Medical and consulting fees from the American College of Cardiology and Uptodate.
References
- 1.Narayan SM, Krummen DE, Shivkumar K, Clopton P, Rappel WJ, Miller JM. Treatment of atrial fibrillation by the ablation of localized sources: CONFIRM (Conventional Ablation for Atrial Fibrillation With or Without Focal Impulse and Rotor Modulation) trial. Journal of the American College of Cardiology. 2012;60:628–36. doi: 10.1016/j.jacc.2012.05.022. [DOI] [PMC free article] [PubMed] [Google Scholar]
- 2.Rappel WJ, Zaman JA, Narayan SM. Mechanisms for the Termination of Atrial Fibrillation by Localized Ablation: Computational and Clinical Studies. Circ Arrhythm Electrophysiol. 2015 doi: 10.1161/CIRCEP.115.002956. [DOI] [PMC free article] [PubMed] [Google Scholar]
- 3.Carrick RT, Benson B, Habel N, Bates OR, Bates JH, Spector PS. Ablation of multiwavelet re-entry guided by circuit-density and distribution: maximizing the probability of circuit annihilation. Circ Arrhythm Electrophysiol. 2013;6:1229–35. doi: 10.1161/CIRCEP.113.000759. [DOI] [PubMed] [Google Scholar]
- 4.Saoudi N, Cosio F, Waldo A, et al. Classification of Atrial Flutter and Regular Atrial Tachycardia According to Electrophysiologic Mechanism and Anatomic Bases: A Statement from a Joint Expert Group From the Working Group of Arrhythmias of the European Society of Cardiology and the North American Society of Pacing and Electrophysiology. J Cardiovasc Electrophysiol. 2001;12:852–866. doi: 10.1046/j.1540-8167.2001.00852.x. [DOI] [PubMed] [Google Scholar]
- 5.Bochoeyer A, Yang Y, Cheng J, et al. Surface Electrocardiographic Characteristics of Right and Left Atrial Flutter. Circulation. 2003;108:60–66. doi: 10.1161/01.CIR.0000079140.35025.1E. [DOI] [PubMed] [Google Scholar]
- 6.Gerstenfeld EP, Callans DJ, Dixit S, et al. Mechanisms of Organized Left Atrial Tachycardias Occurring After Pulmonary Vein Isolation. Circulation. 2004;110:1351–1357. doi: 10.1161/01.CIR.0000141369.50476.D3. [DOI] [PubMed] [Google Scholar]
- 7.Narayan SM, Feld GK, Hassankhani A, Bhargava V. Quantifying Intra-Cardiac Organization of Atrial Arrhythmias Using Temporospatial Phase of the Electrocardiogram. J Cardiovasc Electrophysiol. 2003;14:971–981. doi: 10.1046/j.1540-8167.2003.03213.x. [DOI] [PubMed] [Google Scholar]
- 8.Forclaz A, Narayan SM, Scherr D, et al. Early temporal and spatial regularization of persistent atrial fibrillation predicts termination and arrhythmia-free outcome. Heart Rhythm. 2011;8:1374–82. doi: 10.1016/j.hrthm.2011.05.008. [DOI] [PMC free article] [PubMed] [Google Scholar]
- 9.Narayan SM, Hassankhani A, Feld GK, Bhargava V. Separating non-isthmus- from isthmus-dependent atrial flutter using wavefront variability. J Am Coll Cardiol. 2005;45:1269–79. doi: 10.1016/j.jacc.2004.12.070. [DOI] [PubMed] [Google Scholar]
- 10.Krummen DE, Patel M, Nguyen H, et al. Accurate ECG Diagnosis of Atrial Tachyarrhythmias Using Quantitative Analysis: A Prospective Diagnostic and Cost-Effectiveness Study. J Cardiovasc Electrophysiol. 2010;21:1251–9. doi: 10.1111/j.1540-8167.2010.01809.x. [DOI] [PMC free article] [PubMed] [Google Scholar]
- 11.Narayan SM, Bhargava V. Temporal and Spatial Phase Analyses of the Electrocardiogram Stratifies Intra-Atrial and Intra-Ventricular Organization. IEEE Trans Biomed Eng. 2004d;51:1749–1764. doi: 10.1109/TBME.2004.827536. [DOI] [PubMed] [Google Scholar]
- 12.Hoppe BL, Kahn AM, Feld GK, Hassankhani A, Narayan SM. Separating Atrial Flutter from Atrial Fibrillation with Apparent ECG Organization Using Dominant and Narrow F-wave Spectra. J Am Coll Cardiol. 2005;46:2079–2087. doi: 10.1016/j.jacc.2005.08.048. [DOI] [PubMed] [Google Scholar]
- 13.Brown JP, Krummen DE, Feld GK, Narayan SM. Using Electrocardiographic Activation Time and Diastolic Intervals to Separate Focal from Macroreentrant Atrial Tachycardias. J Am Coll Cardiol. 2007;49:1965–1973. doi: 10.1016/j.jacc.2006.10.080. [DOI] [PubMed] [Google Scholar]
- 14.Jais P, Matsuo S, Knecht S, et al. A deductive mapping strategy for atrial tachycardia following atrial fibrillation ablation: importance of localized reentry. J Cardiovasc Electrophysiol. 2009;20:480–91. doi: 10.1111/j.1540-8167.2008.01373.x. [DOI] [PubMed] [Google Scholar]
- 15.Raine D, Langley P, Murray A, Dunuwille A, Bourke JP. Surface atrial frequency analysis in patients with atrial fibrillation: a tool for evaluating the effects of intervention. J Cardiovasc Electrophysiol. 2004;15:1021–6. doi: 10.1046/j.1540-8167.2004.04032.x. [DOI] [PubMed] [Google Scholar]
- 16.Bollmann A, Langberg J. Frequency analysis of human atrial fibrillation using surface electrocardiogram and its response to ibutilide. American Journal of Cardiology. 1998;81:1439–1445. doi: 10.1016/s0002-9149(98)00210-0. [DOI] [PubMed] [Google Scholar]
- 17.Iravanian S, Langberg JJ. Spatiotemporal organization during ablation of persistent atrial fibrillation. Heart Rhythm. 2015;12:1937–44. doi: 10.1016/j.hrthm.2015.04.027. [DOI] [PubMed] [Google Scholar]
- 18.Miller JM, Daubert J, Day J, et al. Long-Term Results of Patients Receiving Focal Impulse and Rotor Modulation (FIRM) for Atrial Fibrillation: Extended Multi-center Experience (abstract) Circulation. 2014:128. [Google Scholar]
- 19.Sommer P, Kircher S, Rolf S, et al. Successful Repeat Catheter Ablation of Recurrent Longstanding Persistent Atrial Fibrillation with Rotor Elimination as the Procedural Endpoint: A Case Series. J Cardiovasc Electrophysiol. 2016;27:274–80. doi: 10.1111/jce.12874. [DOI] [PubMed] [Google Scholar]
- 20.Spitzer SG, Karolyi L, Rammler C, et al. Treatment of Recurrent Non-Paroxysmal Atrial Fibrillation Using Focal Impulse and Rotor Mapping (FIRM)-Guided Rotor Ablation: Early Recurrence and Long-Term Outcomes. J Cardiovasc Electrophysiol. 2016 doi: 10.1111/jce.13110. [DOI] [PubMed] [Google Scholar]
- 21.Allessie MA, de Groot NM, Houben RP, et al. The ElectroPathological Substrate of Longstanding Persistent Atrial Fibrillation in Patients with Structural Heart Disease: Longitudinal Dissociation. Circ Arrhythm Electrophysiol. 2010;122:1674–82. doi: 10.1161/CIRCEP.109.910125. [DOI] [PubMed] [Google Scholar]
- 22.SippensGroenewegen A, Peeters HA, Jessurun ER, et al. Body surface mapping during pacing at multiple sites in the human atrium: P-wave morphology of ectopic right atrial activation. Circulation. 1998;97:369–80. doi: 10.1161/01.cir.97.4.369. [DOI] [PubMed] [Google Scholar]
- 23.Roithinger FX, SippensGroenewegen A, Karch MR, Steiner PR, Ellis WS, Lesh MD. Organized activation during atrial fibrillation in man: endocardial and electrocardiographic manifestations. J Cardiovasc Electrophysiol. 1998;9:451–61. doi: 10.1111/j.1540-8167.1998.tb01836.x. [DOI] [PubMed] [Google Scholar]
- 24.Krummen DE, Peng KA, Bullinga JR, Narayan SM. Centrifugal Gradients of Rate and Organization in Human Atrial Fibrillation. Pacing Clin Electrophysiol. 2009;32:1366–1378. doi: 10.1111/j.1540-8159.2009.02525.x. [DOI] [PMC free article] [PubMed] [Google Scholar]
- 25.Potse M, Lankveld TA, Zeemering S, et al. P-wave complexity in normal subjects and computer models. J Electrocardiol. 2016;49:545–53. doi: 10.1016/j.jelectrocard.2016.05.005. [DOI] [PubMed] [Google Scholar]


