Abstract
The optical properties of plasmonic nanoparticles are strongly dependent on interactions with other nanoparticles, which complicates analysis for systems larger than a few particles. In this work we examined heat dissipation in aggregated nanoparticles, and its influence on surface enhanced Raman scattering (SERS), through correlated photothermal heterodyne imaging, electron microscopy and SERS measurements. For dimers the per particle absorption cross-sections show evidence of interparticle coupling, however, the effects are much smaller than those for the field enhancements that are important for SERS. For larger aggregates the total absorption was observed to be simply proportional to aggregate volume. This observation allows us to model light absorption and heating in the aggregates by assuming that the particles act as independent heat sources. The heat dissipation calculations show that very high temperatures can be created at the nanoparticle surface, and that the temperature decreases with increasing thermal conductivity of the surroundings. This is in agreement with the SERS measurements that show faster signal degradation for air compared to water environments.
Graphical Abstract
INTRODUCTION
Gold nanoparticles (NPs) exhibit unique properties associated with localized surface plasmon resonances (SPRs), resulting in both enhanced light scattering and absorption.1 The SPR essentially acts to concentrate the light flux into small volumes near the surface of the nanoparticle, inducing an intense electric field around the particle. These localized regions of high electric field (hot spots) have been associated with surface enhanced Raman scattering (SERS).2–4 The surface plasmon decays by radiating its energy through light scattering, or nonradiatively creating a transient population of nonequilibrium (hot) charge carriers.5–6 In a chemically inert environment, the hot carriers transfer their energy to the metal lattice, converting the absorbed light into heat.5, 7–8 These plasmonic properties of gold NPs have been used for various applications, such as: SERS,9–13 TERS,14–15 solar energy conversion,16–18 photocatalysis,19–20 and photothermal therapy.21–23
In the field of plasmonics, local heating is an important consideration for many applications. The enhanced light absorption of NPs provides a way to control thermal-induced phenomena at the nanoscale.24–26 In many instances local heating is beneficial, such as for heat-assisted catalysis,20, 27–28 nanofabrication,29 optical injection of NPs into cells30 and photothermal therapy.21–23 For other applications, local heating may cause unwanted physical or chemical changes. This heating can be extremely destructive for both the application/experiment and for the NPs themselves. Heat generated by the NPs can vaporize the surrounding medium31 or affect molecules, like proteins, that are in close proximity.32 Depending on the excitation power of the heating beam, NPs can even be reshaped or melted,33–35 thus strongly altering their properties.
The temperature increase resulting from excitation of the SPR is believed to be a limiting factor for SERS based chemical sensing, particularly in temperature sensitive samples like biological systems.36 The heating effect may destroy the “hot spot”, or induce molecular desorption or pyrolysis, reducing the SERS signal and causing the signal to be unstable. Limiting the excitation laser power density can minimize these effects, but the actual temperatures created during SERS measurements are not well known. Various methodologies have been developed to measure temperatures at the nanoscale, including scanning thermal microscopy,37 fluorescent thermometry,38 Raman thermometry,39–40 and optical scattering spectral thermometry.41–42 In this work photothermal heterodyne imaging (PHI) is combined with SERS and scanning electron microscopy (SEM) to study local heating in SERS measurements with NP aggregates. The goal of the study is to determine the temperature at the surface of the nanoparticles under typical experimental conditions. PHI was chosen for these measurements as it can be easily incorporated into our SERS microscope, and does not require additional molecular species for a temperature read-out.
In PHI, absorption is detected by monitoring the heat deposited into the sample by a modulated pump laser using a non-resonant probe beam.43–44 PHI is extremely sensitive, and a single molecule at room temperature can be detected.45 PHI can also be used to obtain absorption spectra,46–47 and the absorption cross-section of nano-objects can be determined by comparing the PHI signal to a reference (in our experiments isolated Au NPs).43, 48–49 We use PHI to measure the absorption cross-sections of NP aggregates, which are then used in a Finite Element (FE) simulation to determine the heat flux in the aggregates. This allows us to estimate the temperature in the system. These temperature estimates are then correlated to SERS measurements that interrogate laser heating induced sample degradation.
EXPERIMENTAL AND SIMULATION METHODS
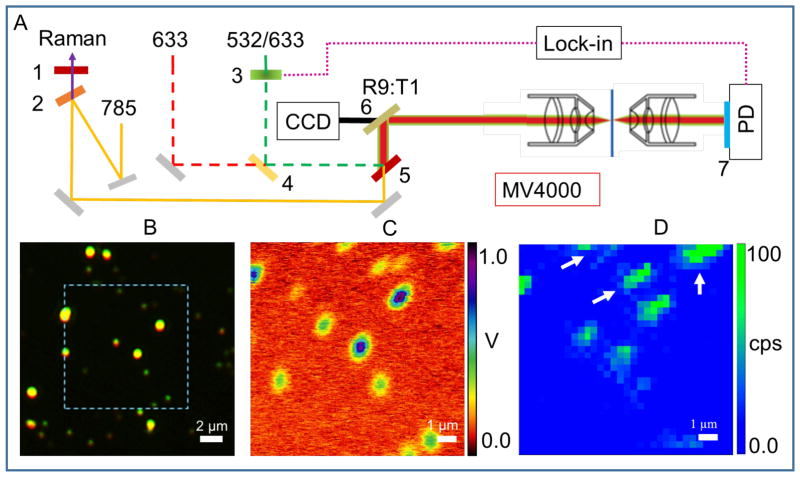
Figure 1(A) shows a diagram of the experimental PHI/SERS system. The piezo scanner and software control are taken from a Nanonics MV 4000 atomic force microscope. The different wavelength combinations available for the PHI experiments are 532 nm pump + 633 nm probe, or 532/633 nm pump + 785 nm probe. The 633 nm laser was also used for Raman detection. The long-pass dichroic mirror (4, Thorlabs, DMLP567) was used to combine the 532 nm laser (Innovation photonic solution, I0532SL0100MF) with the 633 nm laser (HeNe, Melles Griot, 25-LHP-925). The 785 nm laser (Innovation photonic solution, I0785SH0090B-IS-TH-L) was reflected by a short-pass filter (2, Semrock, SP01-785RU-25) and then transmitted through the 633 nm long pass edge filter (5, LPD02-633RU-25) to the microscope. A beam splitter (6, Chroma, 21011) enabled the collection of a white light image. We used a λ/2 waveplate to control the polarization of pump beam, and used λ/4 waveplate to circularly polarize the probe beam. A mechanical chopper (3, Thorlabs, MC2000) was used for intensity modulation of the pump beam at 10 kHz. The probe beam was adjusted carefully and overlapped with the pump beam, and both beams were directed onto the sample through a dark field objective (Olympus, 50X, NA=0.5, LMPLFLN50xBD). The transmitted probe beam was collected by a second objective (Olympus, 10x, NA=0.25) and sent to a Si photodiode (Thorlabs, PDA100A). A band pass filter was used to block the pump beam. The change in the probe intensity at the detector induced by the pump laser was detected by a lock-in amplifier (Stanford Research Systems, SR-530). The Raman signal was focused onto the 100 μm entrance slit of an imaging spectrograph (Horiba Jobin Yvon, iHR320), dispersed by a 600 g/mm grating and detected with a CCD camera (Horiba, Synapse). The PHI and SERS images were collected concurrently. However, the PHI images are 100×100 pixels while the SERS image is sampled at 32×32 pixels during the same image acquisition. This is due to the scanning method in the piezo software (Nanonics Imaging, LTD), which acquires the PHI signal from each line and then repeats the line for the SERS signal, ensuring a high resolution PHI image.
Figure 1.
Principle of PHI + SERS microscopy. (A) Instrument setup. The illustration shows photothermal microscopy in transmission geometry employing lock-in detection and equipped with a reflection mode dark field objective. The sample is translated with a piezo stage (MV4000, Nanonics Imaging LTD). 1, 633 nm long pass edge filter. 2, 785 nm short pass edge filter. 3, chopper. 4–5, dichroic laser beam combiner. 6, beam splitter. 7, band pass filter. PD, photodiode. (B) True color dark field image is shown for 80 nm gold dispersion on ITO substrate immersed in glycerol solution using a dark field objective with NA = 0.5. (C) The measured photothermal signal is plotted for the highlighted region in (B). The experimental parameters used are: heating beam intensity at 532 nm = 0.3 mW; probe beam intensity at 633 nm = 0.6 mW, time constant of lock-in is 30 ms, chopper modulation frequency = 10 KHz. (D) The SERS signal measured over the same region is shown. The experimental parameters for the SERS measurement are: Raman collection time = 1 s per pixel, 32×32 pixels. The SERS intensity is derived from the 2216 cm−1 Raman band of 4-Cyanothiophenol molecules adsorbed onto the aggregates.
Gold nanoparticles (80 nm citrate NanoXact™ gold) were purchased from nanoComposix (San Diego, CA). The Au sol was centrifuged twice before the optical measurements to remove excess reactants and surfactant. A small drop of the sol was placed on a clean substrate, such as a cover glass or ITO coated cover slips (SPI Supplies Brand, 70–100 ohms), and the dried substrate was immersed in 1 mM 4-Cyanothiophenol ethanol (spectrographic grade) solution overnight. The substrate was then rinsed with ethanol to remove the weak physically adsorbed molecules. The ITO coated cover slips were ultrasonically cleaned in acetone for 10 min and treated with an argon plasma for 5 min before use. Ultrapure water with a resistivity of 18.2 MW cm from a Barnstead Nano-pure filtration system was used for all experiments. The ITO substrates were marked by an index grid to allow SEM images to be recorded of the aggregates examined in the optical experiments. The SEM images were recorded with a FEI Magellan 400 Scanning Electron Microscope.
Finite Element (FE) simulations of the optical response and heat dissipation in the aggregates were performed using COMSOL Multiphysics. For calculations of the temperature rise, we consider that each particle acts as an independent heat source (justification for this approximation is presented below). The temperature increase depends on the amount of energy absorbed and dissipated. The absorbed power is given by P = σabs * I, where I is the irradiance of the incoming light and σabs is the absorption cross-section of the nano-object. The dissipated power creates a temperature profile, ΔT(r, t), around the nano absorber, which depends on the thermal conductivity, k, and heat capacity per unit volume, Cp, of the medium. This information is put into the COMSOL model and it is straightforward to calculate the final steady-state temperature.
The absorption cross sections were calculated in COMSOL by performing an Electromagnetic Waves, Frequency Domain simulation. Specifically, the absorption cross section was evaluated as
where Q is the power dissipation, Pin is the input power, and the integral is performed over the volume of the particle. See the Supporting Information for more details. For the dimers calculations were performed with the background field polarized parallel or perpendicular to the inter-particle axis of the dimer.
RESULTS AND DISCUSSION
A representative true color dark field image of 80 nm diameter gold NPs on an ITO substrate, immersed in glycerol solution is shown in Figure 1B. The high contrast, bright yellow spots in the image indicate large aggregates of NPs. Figure 1C shows that these spots also exhibit the strongest PHI signal. This is expected as the PHI signal is proportional to the total absorption cross-section,43–45 which increases with the number of NPs in the aggregate. However, the image in Figure 1D shows that the SERS signal does not necessarily increase with the aggregate size. The arrows in Figure 1D indicate aggregates with small PHI signals that still produce strong Raman signals. This difference is due to the fact that the SERS signal arises from the enhanced electric fields (hot spots) created in the junctions between particles and, thus, is very sensitive to the exact spacing and arrangement of the particles in the aggregates.50–54
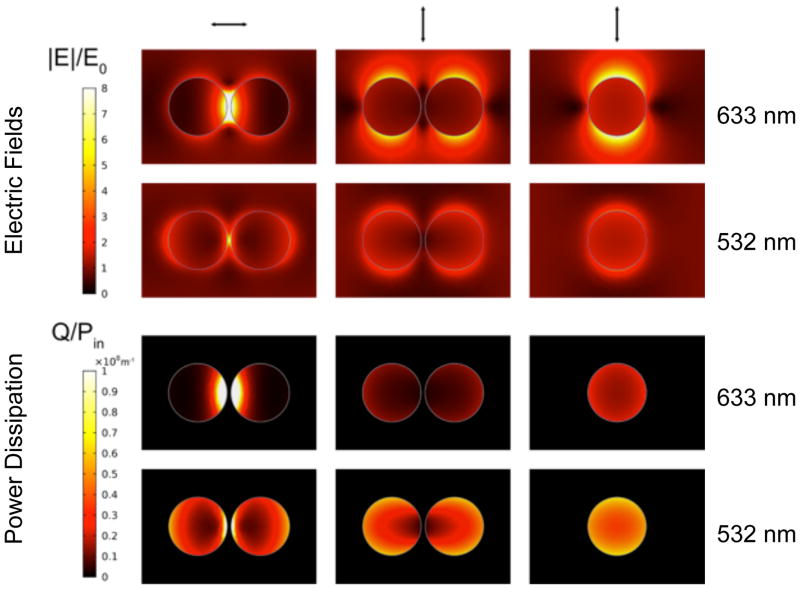
Figure 2 shows plots of the electric field and power dissipation density (which is essentially the absorption) for a single nanoparticle and a dimer at 633 nm and 532 nm. For the dimer the electric field is strongly enhanced in the gap when the light is polarized along the dimer axis. (Note that a factor of ~8 enhancement in the electric field would cause a |E|4 ≈ 4000 enhancement in the SERS signal). The power dissipation density also shows some localization in the gap region for the dimer. However, because the absorption is the integral of the power dissipation density over the volume, the absorption cross-sections for the aggregates are not as sensitive to the arrangement of the particles as the SERS signal. This is illustrated in more detail in Figure 3 below.
Figure 2.
COMSOL calculations of the normalized electric fields and the power dissipation density for the dimer and monomer at 633 (top) and 532 nm (bottom) are shown. The polarization of the pump beam is indicated by arrows at the top of each column. The gap size for the dimer was 5 nm.
Figure 3.
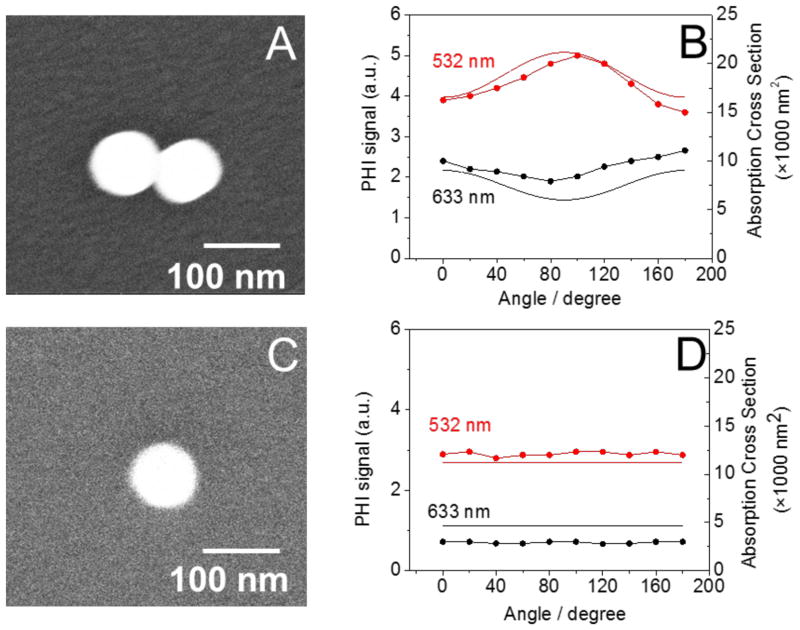
The polarization dependence of the photothermal signal is shown. Here we used two configuration for photothermal detection: 532 nm pump + 785 nm probe and 633 nm pump + 785 nm probe. SEM images of the particles are shown in panels A and C. The experimental photothermal signal (B & D, points) shows the polarization dependence at each pump wavelength and that predicted by the COMSOL simulations (B & D, solid line). A–B shows a dimer with < 5 nm gap distance, while C–D is a single particle. Experimental parameters: ITO substrate, beam intensity = 0.9 mW for both 532 nm and 633 nm beam, and the lock-in time constant is 1 s.
To address how the absorption cross-section depends on geometry of the aggregates, we carried out correlated SEM and PHI measurements, examples of which are shown in Figures 3 and 4. The dark field image and PHI measurements were correlated to the SEM image using an ITO substrate with an index grid. The PHI measurements in Figures 3 and 4 were performed with ethanol for the medium. Ethanol was chosen because its refractive index (1.36) is closer to water (1.33) than glycerol (1.47). This makes the absorption cross-section of NPs in ethanol similar to that in water (an important solvent for biological science applications). Ethanol also has high variation of refractive index with temperature (∂n/∂T). Because of this the figure-of-merit for photothermal measurements is 2 times better for ethanol than glycerol, and 10 times better than water.44 This improves the sensitivity of the PHI measurement and allows the use of a low power heating beam. Third, ethanol’s thermal conductivity (0.171 W/m/K) and boiling point (78 °C) are much lower than water (0.56 W/m/K, 100 °C), which means that under the same conditions, the temperature will increase more in ethanol than in water. This makes it possible to observe bubble formation in the experiment with ethanol (vida infra).
Figure 4.
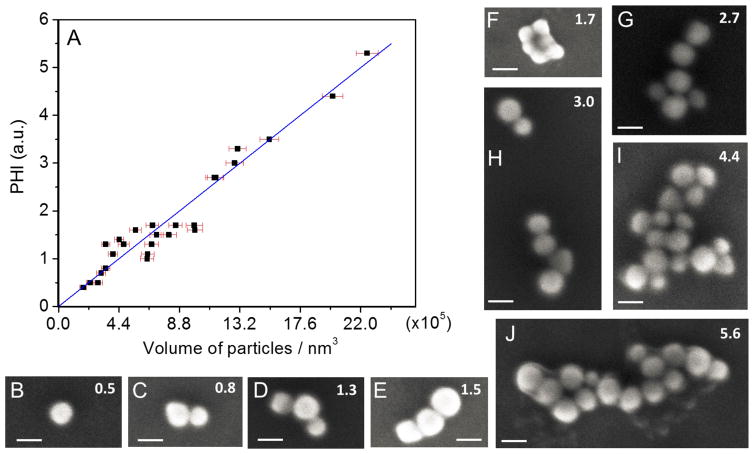
(A) The photothermal signal measured from aggregates comprised of different numbers of nanoparticles is shown. The number of particles changes from 1 to 16. (B–J) Typical SEM images are shown for the nanoparticles in (A). The scale bar in all images is 80 nm. The corresponding value of the photothermal signal for each aggregate is reported in the upper right corner of each SEM image.
The first step in our analysis is to confirm that PHI measurements give reliable information about absorption cross-sections. Figure 3(A) shows an SEM image of a nanoparticle dimer with a gap distance of < 5 nm. Polarization dependent photothermal measurements at 532 nm and 633 nm are presented in Figure 3(B), and Figure 3(B) also shows absorption cross-sections calculated using FE simulations performed in COMSOL Multiphysics. In these calculations the size of the particles was determined from the SEM images, and an effective medium approximation was used for the dielectric constant of the environment (i.e., the environment was treated as an average of the refractive indexes of ITO and ethanol). Figures 3(C) – (D) shows analogous images and PHI and calculated absorption cross-section for an isolated particle. For the dimer both the experimental PHI signal and the absorption cross-section calculations show a strong polarization dependence. For 633 nm the absorption is maximized when the laser polarization is parallel to the interparticle axis, whereas, for 532 nm the absorption is maximized when the polarization is perpendicular to the axis. The relative magnitude of the experimental 532 nm and 633 nm PHI signals are in good agreement with the FE simulations for the two systems shown in Figure 3. Thus, the PHI measurements give reliable information about the relative absorption cross-sections at a given wavelength. The data in Figure 3 also shows that bringing two particles together to form a dimer only causes modest changes in the absorption cross-sections: the cross-section for the dimer is close to (but not exactly) twice the cross-section for the monomer. On the other hand, the calculated electric field in the gap between the particles shows large changes with polarization, see Figure 2, consistent with previous studies.51, 54
In the following, we concentrate on 532 nm pump experiments with a depolarized pump laser beam. Control experiments on nanoparticle aggregates with different gap spacing show that the effective absorption cross-section is just the average of the parallel and perpendicular absorption cross-sections.48 Figure 4 shows SEM images and PHI experiments for different sized aggregates. In Figure 4A a plot of the PHI signal from different aggregates versus total volume determined from the SEM images is presented. Some typical SEM images are shown in Figure 4B–J. In this analysis the particles were assumed to be spherical, the diameter of each particle in the aggregate was measured in the SEM image, and the volume was calculated as the sum of the volume of each nanoparticle in the aggregate. The line is the expected PHI signal in the absence of coupling effects, with the slope determined by scaling the PHI signal for a single 80 nm Au nanoparticle. The data indicates that the absorption cross-section is related to the total number of absorbers; however, plotting the volume better accounts for the heterogeneity in the particle size. Deviations from this line may occur for the following reasons: first, not all the particles are spherical, resulting in errors in the volume calculations. Second, local environment differences, like defects in the ITO substrate that change the effective dielectric environment, can cause variations in the absorption cross-sections and therefore the PHI response. Differences in the coupling between particles can also affect the absorption cross-sections of the aggregates. Indeed, the variation in the signal observed in Figure 4 is consistent with the data in Figure 3. At large sizes, the excellent correlation between the PHI signal and the total volume shows that coupling effects between particles are washed out when a large number of particles are present.
The data in Figure 4 shows that the absorption in Au NP aggregates essentially depends on the total volume of gold. This is in marked contrast to the SERS intensity which is controlled by a few hot spots within the aggregates (see Figure 1), and does not necessarily follow the total number of particles. This is one of the main results of this project.
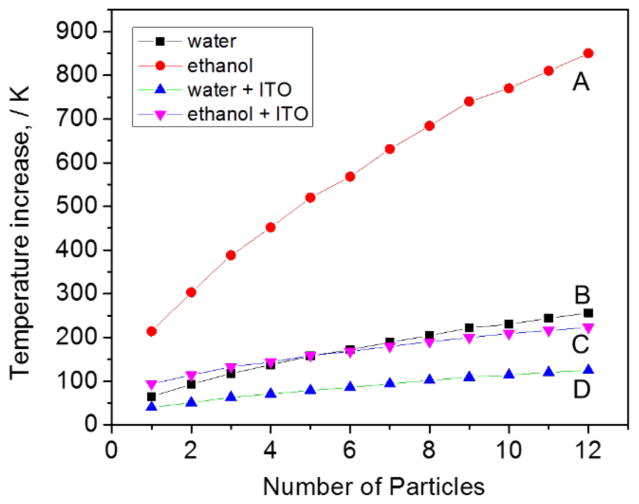
We now turn to heating effects. The absence of coupling effects in the absorption cross-sections for the aggregates means that the NPs can be modeled as independent heat sources. Figure 5 is the COMSOL calculation of the temperature increase for multi-particle aggregates at 532 nm (see supporting information for more details). Figure 5 shows the maximum temperature increase ΔTmax, which occurs at the nanoparticle surface. The simulations show several effects. First, laser heating creates very high temperatures at the particle surface. The temperature decays on a length scale proportional to the nanoparticle size, and is dependent on the thermal conductivity of the medium (see supporting information). The temperature increase is sub-linear with the number of particles. This is also an effect from thermal diffusion: for large aggregates, particles far away from each other do not influence each other’s surface temperature. The calculations also highlight the effect of using a high thermal conductivity substrate (e.g. ITO) and medium (water) to efficiently reduce the final ΔT.
Figure 5.
FE simulation of the local temperature increase (ΔTmax) with number of NPs is shown for particles in (i) ethanol, (i) water, (ii) ethanol with an ITO substrate, (iv) water with an ITO substrate. The gap between particles is 1 nm, the particle-substrate separation is 0.3 nm, and the nanoparticle diameter is 80 nm. The calculation uses the following parameters: wavelength = 532 nm, power density = 1 mW/3m2, and initial ambient temperature = 300 K.
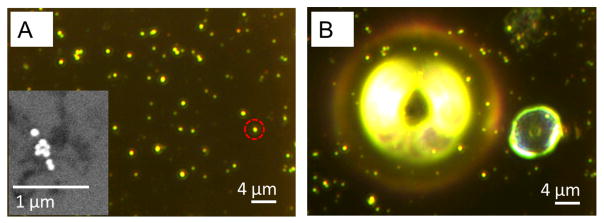
Ethanol’s thermal conductivity (0.171 W/m/K) and boiling point (78 °C) are much lower than water (0.56 W/m/K, 100 °C), and demonstrate a much larger change in temperature. Interestingly, the lower heat dissipation in ethanol results in easily observable bubble formation for aggregates on an ITO substrate, as shown in Figure 6. Figure 6(A) shows a dark field image of aggregates, and the insert shows a SEM image of one of the aggregates that was subsequently irradiated by the 532 nm pump laser. The aggregate consists of 9 NPs, and the simulations predict a maximum temperature of 390 °C (assuming 80 nm diameter particles) under our experimental conditions, which is enough to create bubbles. These bubbles are primarily air molecules, not ethanol vapor. Previous experiments have shown that bubble formation during plasmonic heating is initially due to vaporizing the solvent. However, once the bubble has formed growth is caused by dissolved gas diffusing to the bubble.31 We find such bubbles have difficulty re-dissolving in ethanol, even after the pump beam has been turned off, consistent with previous reports.22
Figure 6.
(A) True color dark field images are shown before heating. The left-bottom inset SEM image corresponds to the NPs which are inside the red circle. (B) Bubbles are observed leaving the NPs in the Dark field image after 5s heating. 532 nm heating beam power is 1.8 mW, the NPs used are highlighted in (A). NPs are dispersed on an ITO substrate which was covered with ethanol.
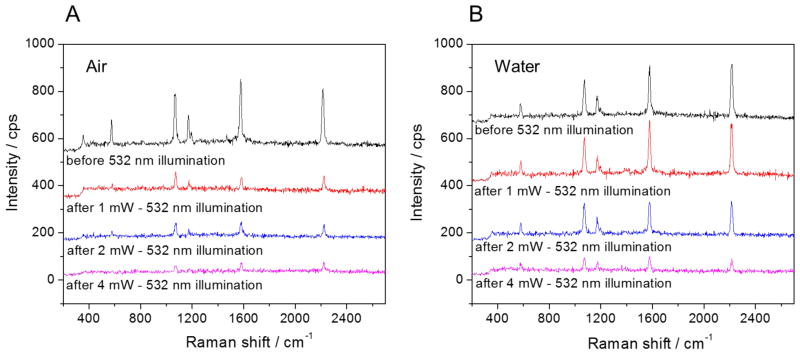
To examine the effect of laser heating on the SERS signal, we use the depolarized 532 nm pump beam for heating. As shown in Figure 4, the absorption at 532 nm simply scales as the total volume of gold, allowing us to easily estimate the temperature created by the pump laser in the aggregates. Figure 7 shows the SERS signal obtained from nanoparticle aggregates after exposure to increasing 532 nm laser powers. 4-Cyanothiophenol was used for the Raman probe molecule. The NPs are dispersed on an ITO substrate. A 633 nm laser beam with 80 3W power was used for SERS detection. The aggregates were exposed to the 532 nm laser for 5 s, at powers of 1 mW, 2 mW and 4 mW.
Figure 7.
SERS signal of 4-Cyanothiophenol molecules adsorbed on 80 nm gold nanoparticles is shown (A) in air and (B) in water. Substrate: ITO, 80 μW 633 nm laser for SERS detection, collection time: 1s, 1–4 mW 532 nm laser used for heating beam. The SERS signal was obtained from a small isolated aggregate.
The SERS signal in water is observed to be quite stable under 1 mW heating beam. The signal is reduced by half under 2 mW of 532 illumination, and nearly disappears with 4 mW of illumination. If we assume there are 2 to 6 NPs in the spot (which is typical of the aggregates studied in our measurements), the final maximum temperature will be 80 – 110 °C for 1 mW, 130 – 200 °C for 2 mW, and 230 – 370 °C for 4 mW. The loss of SERS signal can be explained by either molecular desorption or NPs sintering: Halas et al55 reported nearly total thermal release of ssDNA (Au-S bond fracture) at about 80 °C, and NPs sintering phenomenon was observed at 290 °C by Plech et al.56 These temperature ranges agree with our SERS signal loss experiment. Interestingly, the SERS signal in air decreases quickly even under 1 mW 532 illumination. The temperature increase at the particle surface in air is expected to be much higher than that in water, because the thermal conductivity of air (0.024 W/m/K) is much less than water (0.56 W/m/K), see Figure 5.
Note that the magnitude of the SERS signal decrease is dependent on the confocal performance of the Raman optical system (the spot size of the beam at the sample) and density of NPs in the sample. Tests of a region with large aggregated particles are quite different to the results presented in Figure 7 (see Supporting Information). This is because the temperature rise at the sample does not scale linearly with the number of particles, see Figure 5, and some of the SERS signal is collected from outside the heated area.
CONCLUSIONS
PHI has been used to examine optical absorption in nanoparticle aggregates. For simple dimers, the measured relative absorption cross-sections are in good agreement with the values obtained from the electromagnetic simulations. Unlike the huge electric field enhancements in coupled systems observed for SERS, the per particle absorption cross sections show moderate changes when nanoparticles are brought together. For aggregates with a large number of particles, and with depolarized excitation, the total absorption cross-sections are simply proportional to the total volume of the aggregate. This allows us to simulate laser heating in the aggregates by modeling the particles as independent absorbers. The simulations show that very high temperatures can be created. The temperatures are dependent on the environment, with the lowest temperature increases occur for particles in water on an ITO substrate. This is consistent with laser heating/SERS measurements, where it was observed that the loss in the SERS intensity is smallest for NPs in water. The calculated temperature ranges show that the loss in SERS intensity could arise from molecular desorption or NP sintering. To maintain stable SERS activity in aggregated nanoparticle structures, it is clear that heating effects must be minimized. The experiments and analysis in this paper show that using a high thermal conductivity medium and substrate is important. In particular, the NPS should have a strong thermal contact with the substrate.
Supplementary Material
Acknowledgments
The authors acknowledge support from the National Science Foundation award CHE-1507287 (ZDS) and CHE-1502848 (GVH), the National Institute of General Medical Sciences award R01 GM109988 (ZDS), and the Walther Cancer Foundation (ZCZ). 4-Cyanothiophenol was synthesized in the Notre Dame Chemical Synthesis Core facility.
Footnotes
ASSOCIATED CONTENT
Instrument setup; sample preparation; microscope stability; power and polarization dependence of the photothermal signal; computational model using COMSOL Multiphysics; the final temperature dependence on the following factors: medium effect; substrate effect; particle number effect; size effect; gap distance effect; geometric arrangement effect; coupling effect; power density consideration; SERS signal with heating power dependent; bubble formation; Local temperature in TERS system. This material is available free of charge via the Internet at http://pubs.acs.org.
References
- 1.Kelly KL, Coronado E, Zhao LL, Schatz GC. The Optical Properties of Metal Nanoparticles: The Influence of Size, Shape, and Dielectric Environment. J Phys Chem B. 2003;107:668–677. [Google Scholar]
- 2.Moskovits M. Surface-Enhanced Raman Spectroscopy: A Brief Retrospective. J Raman Spectros. 2005;36:485–496. [Google Scholar]
- 3.Kneipp J, Kneipp H, Kneipp K. Sers - a Single-Molecule and Nanoscale Tool for Bioanalytics. Chem Soc Rev. 2008;37:1052–1060. doi: 10.1039/b708459p. [DOI] [PubMed] [Google Scholar]
- 4.Camden JP, Dieringer JA, Zhao J, Van Duyne RP. Controlled Plasmonic Nanostructures for Surface-Enhanced Spectroscopy and Sensing. Acc Chem Res. 2008;41:1653–1661. doi: 10.1021/ar800041s. [DOI] [PubMed] [Google Scholar]
- 5.Hartland GV. Optical Studies of Dynamics in Noble Metal Nanostructures. Chem Rev. 2011;111:3858–3887. doi: 10.1021/cr1002547. [DOI] [PubMed] [Google Scholar]
- 6.Crut A, Maioli P, Del Fatti N, Vallee F. Optical Absorption and Scattering Spectroscopies of Single Nano-Objects. Chem Soc Rev. 2014;43:3921–3956. doi: 10.1039/c3cs60367a. [DOI] [PubMed] [Google Scholar]
- 7.Clavero C. Plasmon-Induced Hot-Electron Generation at Nanoparticle/Metal-Oxide Interfaces for Photovoltaic and Photocatalytic Devices. Nature Photonics. 2014;8:95–103. [Google Scholar]
- 8.Brongersma ML, Halas NJ, Nordlander P. Plasmon-Induced Hot Carrier Science and Technology. Nature Nano. 2015;10:25–34. doi: 10.1038/nnano.2014.311. [DOI] [PubMed] [Google Scholar]
- 9.Li JF, et al. Surface Analysis Using Shell-Isolated Nanoparticle-Enhanced Raman Spectroscopy. Nature Protocols. 2013;8:52–65. doi: 10.1038/nprot.2012.141. [DOI] [PubMed] [Google Scholar]
- 10.Schlücker S. Surface-Enhanced Raman Spectroscopy: Concepts and Chemical Applications. Ang Chem Int Ed. 2014;53:4756–4795. doi: 10.1002/anie.201205748. [DOI] [PubMed] [Google Scholar]
- 11.Sharma B, Frontiera RR, Henry AI, Ringe E, Van Duyne RP. Sers: Materials, Applications, and the Future. Materials Today. 2012;15:16–25. [Google Scholar]
- 12.Schultz Zachary D, Marr James M, Wang H. Tip Enhanced Raman Scattering: Plasmonic Enhancements for Nanoscale Chemical Analysis. Nanophotonics. 2014;3:91. [Google Scholar]
- 13.Wang H, Yao K, Parkhill JA, Schultz ZD. Detection of Electron Tunneling across Plasmonic Nanoparticle-Film Junctions Using Nitrile Vibrations. Physical Chemistry Chemical Physics. 2017;19:5786–5796. doi: 10.1039/c6cp08168a. [DOI] [PMC free article] [PubMed] [Google Scholar]
- 14.Wang H, Carrier SL, Park S, Schultz ZD. Selective Ters Detection and Imaging through Controlled Plasmonics. Faraday Discussions. 2015;178:221–235. doi: 10.1039/c4fd00190g. [DOI] [PMC free article] [PubMed] [Google Scholar]
- 15.Xiao L, Wang H, Schultz ZD. Selective Detection of RGD-Integrin Binding in Cancer Cells Using Tip Enhanced Raman Scattering Microscopy. Analytical Chemistry. 2016;88:6547–6553. doi: 10.1021/acs.analchem.6b01344. [DOI] [PMC free article] [PubMed] [Google Scholar]
- 16.Linic S, Christopher P, Ingram DB. Plasmonic-Metal Nanostructures for Efficient Conversion of Solar to Chemical Energy. Nature Materials. 2011;10:911–921. doi: 10.1038/nmat3151. [DOI] [PubMed] [Google Scholar]
- 17.Kamat PV. Photophysical, Photochemical and Photocatalytic Aspects of Metal Nanoparticles. J Phys Chem B. 2002;106:7729–7744. [Google Scholar]
- 18.Tian Y, Tatsuma T. Mechanisms and Applications of Plasmon-Induced Charge Separation at Tio2 Films Loaded with Gold Nanoparticles. J Am Chem Soc. 2005;127:7632–7637. doi: 10.1021/ja042192u. [DOI] [PubMed] [Google Scholar]
- 19.Huang YF, Zhang M, Zhao LB, Feng JM, Wu DY, Ren B, Tian ZQ. Activation of Oxygen on Gold and Silver Nanoparticles Assisted by Surface Plasmon Resonances. Ang Chem Int Ed. 2014;53:2353–2357. doi: 10.1002/anie.201310097. [DOI] [PubMed] [Google Scholar]
- 20.Adleman JR, Boyd DA, Goodwin DG, Psaltis D. Heterogenous Catalysis Mediated by Plasmon Heating. Nano Letters. 2009;9:4417–4423. doi: 10.1021/nl902711n. [DOI] [PubMed] [Google Scholar]
- 21.Lal S, Clare SE, Halas NJ. Nanoshell-Enabled Photothermal Cancer Therapy: Impending Clinical Impact. Acc Chem Res. 2008;41:1842–1851. doi: 10.1021/ar800150g. [DOI] [PubMed] [Google Scholar]
- 22.Jain S, Hirst DG, O’Sullivan JM. Gold Nanoparticles as Novel Agents for Cancer Therapy. British J Radiology. 2012;85:101–113. doi: 10.1259/bjr/59448833. [DOI] [PMC free article] [PubMed] [Google Scholar]
- 23.Jain PK, Huang X, El-Sayed IH, El-Sayed MA. Review of Some Interesting Surface Plasmon Resonance-Enhanced Properties of Noble Metal Nanoparticles and Their Applications to Biosystems. Plasmonics. 2007;2:107–118. [Google Scholar]
- 24.Baffou G, Quidant R. Thermo-Plasmonics: Using Metallic Nanostructures as Nano-Sources of Heat. Laser & Photonics Reviews. 2013;7:171–187. [Google Scholar]
- 25.Govorov AO, Richardson HH. Generating Heat with Metal Nanoparticles. Nano Today. 2007;2:30–38. [Google Scholar]
- 26.Pissuwan D, Valenzuela SM, Cortie MB. Therapeutic Possibilities of Plasmonically Heated Gold Nanoparticles. Trends in Biotechnology. 2006;24:62–67. doi: 10.1016/j.tibtech.2005.12.004. [DOI] [PubMed] [Google Scholar]
- 27.Wang F, Li C, Chen H, Jiang R, Sun LD, Li Q, Wang J, Yu JC, Yan CH. Plasmonic Harvesting of Light Energy for Suzuki Coupling Reactions. J Am Chem Soc. 2013;135:5588–5601. doi: 10.1021/ja310501y. [DOI] [PubMed] [Google Scholar]
- 28.Vázquez-Vázquez C, Vaz B, Giannini V, Pérez-Lorenzo M, Alvarez-Puebla RA, Correa-Duarte MA. Nanoreactors for Simultaneous Remote Thermal Activation and Optical Monitoring of Chemical Reactions. J Am Chem Soc. 2013;135:13616–13619. doi: 10.1021/ja4051873. [DOI] [PubMed] [Google Scholar]
- 29.Fedoruk M, Lutich AA, Feldmann J. Subdiffraction-Limited Milling by an Optically Driven Single Gold Nanoparticle. ACS Nano. 2011;5:7377–7382. doi: 10.1021/nn2023045. [DOI] [PMC free article] [PubMed] [Google Scholar]
- 30.Li M, Lohmüller T, Feldmann J. Optical Injection of Gold Nanoparticles into Living Cells. Nano Letters. 2015;15:770–775. doi: 10.1021/nl504497m. [DOI] [PubMed] [Google Scholar]
- 31.Baffou G, Polleux J, Rigneault H, Monneret S. Super-Heating and Micro-Bubble Generation around Plasmonic Nanoparticles under Cw Illumination. J Phys Chem C. 2014;118:4890–4898. [Google Scholar]
- 32.Mahmoudi M, Lohse SE, Murphy CJ, Fathizadeh A, Montazeri A, Suslick KS. Variation of Protein Corona Composition of Gold Nanoparticles Following Plasmonic Heating. Nano Letters. 2014;14:6–12. doi: 10.1021/nl403419e. [DOI] [PubMed] [Google Scholar]
- 33.Kuhlicke A, Schietinger S, Matyssek C, Busch K, Benson O. In Situ Observation of Plasmon Tuning in a Single Gold Nanoparticle During Controlled Melting. Nano Letters. 2013;13:2041–2046. doi: 10.1021/nl400232r. [DOI] [PubMed] [Google Scholar]
- 34.Setoura K, Okada Y, Hashimoto S. Cw-Laser-Induced Morphological Changes of a Single Gold Nanoparticle on Glass: Observation of Surface Evaporation. Phys Chem Chem Phys. 2014;16:26938–26945. doi: 10.1039/c4cp03733b. [DOI] [PubMed] [Google Scholar]
- 35.Qin Z, Bischof JC. Thermophysical and Biological Responses of Gold Nanoparticle Laser Heating. Chem Soc Rev. 2012;41:1191–1217. doi: 10.1039/c1cs15184c. [DOI] [PubMed] [Google Scholar]
- 36.Caldarola M, Albella P, Cortés E, Rahmani M, Roschuk T, Grinblat G, Oulton RF, Bragas AV, Maier SA. Non-Plasmonic Nanoantennas for Surface Enhanced Spectroscopies with Ultra-Low Heat Conversion. Nature Comm. 2015;6:7915. doi: 10.1038/ncomms8915. [DOI] [PMC free article] [PubMed] [Google Scholar]
- 37.Majumdar A. Scanning Thermal Microscopy. Ann Rev Mater Sci. 1999;29:505–585. [Google Scholar]
- 38.Vetrone F, Naccache R, Zamarrón A, Juarranz de la Fuente A, Sanz-Rodríguez F, Martinez Maestro L, Martín Rodriguez E, Jaque D, García Solé J, Capobianco JA. Temperature Sensing Using Fluorescent Nanothermometers. ACS Nano. 2010;4:3254–3258. doi: 10.1021/nn100244a. [DOI] [PubMed] [Google Scholar]
- 39.Yang H, He LQ, Hu YW, Lu X, Li GR, Liu B, Ren B, Tong Y, Fang PP. Quantitative Detection of Photothermal and Photoelectrocatalytic Effects Induced by Spr from Au@Pt Nanoparticles. Ang Chem Int Ed. 2015;127:11624–11628. doi: 10.1002/anie.201505985. [DOI] [PubMed] [Google Scholar]
- 40.Balois M, Hayazawa N, Catalan F, Kawata S, Yano T-a, Hayashi T. Tip-Enhanced Thz Raman Spectroscopy for Local Temperature Determination at the Nanoscale. Anal Bioanal Chem. 2015;407:8205–8213. doi: 10.1007/s00216-015-8866-0. [DOI] [PubMed] [Google Scholar]
- 41.Setoura K, Okada Y, Werner D, Hashimoto S. Observation of Nanoscale Cooling Effects by Substrates and the Surrounding Media for Single Gold Nanoparticles under Cw-Laser Illumination. ACS Nano. 2013;7:7874–7885. doi: 10.1021/nn402863s. [DOI] [PubMed] [Google Scholar]
- 42.Setoura K, Werner D, Hashimoto S. Optical Scattering Spectral Thermometry and Refractometry of a Single Gold Nanoparticle under Cw Laser Excitation. J Phys Chem C. 2012;116:15458–15466. [Google Scholar]
- 43.Berciaud S, Lasne D, Blab GA, Cognet L, Lounis B. Photothermal Heterodyne Imaging of Individual Metallic Nanoparticles: Theory Versus Experiment. Phys Rev B. 2006;73:045424. [Google Scholar]
- 44.Gaiduk A, Ruijgrok PV, Yorulmaz M, Orrit M. Detection Limits in Photothermal Microscopy. Chem Science. 2010;1:343–350. [Google Scholar]
- 45.Gaiduk A, Yorulmaz M, Ruijgrok PV, Orrit M. Room-Temperature Detection of a Single Molecule’s Absorption by Photothermal Contrast. Science. 2010;330:353–356. doi: 10.1126/science.1195475. [DOI] [PubMed] [Google Scholar]
- 46.Berciaud S, Cognet L, Tamarat P, Lounis B. Observation of Intrinsic Size Effects in the Optical Response of Individual Gold Nanoparticles. Nano Letters. 2005;5:515–518. doi: 10.1021/nl050062t. [DOI] [PubMed] [Google Scholar]
- 47.Yorulmaz M, Nizzero S, Hoggard A, Wang LY, Cai YY, Su MN, Chang WS, Link S. Single-Particle Absorption Spectroscopy by Photothermal Contrast. Nano Letters. 2015;15:3041–3047. doi: 10.1021/nl504992h. [DOI] [PubMed] [Google Scholar]
- 48.Giblin J, Syed M, Banning MT, Kuno M, Hartland G. Experimental Determination of Single Cdse Nanowire Absorption Cross Sections through Photothermal Imaging. Acs Nano. 2010;4:358–364. doi: 10.1021/nn901172s. [DOI] [PubMed] [Google Scholar]
- 49.Selmke M, Braun M, Cichos F. Photothermal Single-Particle Microscopy: Detection of a Nanolens. Acs Nano. 2012;6:2741–2749. doi: 10.1021/nn300181h. [DOI] [PubMed] [Google Scholar]
- 50.Xu H, Aizpurua J, Käll M, Apell P. Electromagnetic Contributions to Single-Molecule Sensitivity in Surface-Enhanced Raman Scattering. Phys Rev E. 2000;62:4318–4324. doi: 10.1103/physreve.62.4318. [DOI] [PubMed] [Google Scholar]
- 51.Talley CE, Jackson JB, Oubre C, Grady NK, Hollars CW, Lane SM, Huser TR, Nordlander P, Halas NJ. Surface-Enhanced Raman Scattering from Individual Au Nanoparticles and Nanoparticle Dimer Substrates. Nano Letters. 2005;5:1569–1574. doi: 10.1021/nl050928v. [DOI] [PubMed] [Google Scholar]
- 52.Brus L. Noble Metal Nanocrystals: Plasmon Electron Transfer Photochemistry and Single-Molecule Raman Spectroscopy. Acc Chem Res. 2008;41:1742–1749. doi: 10.1021/ar800121r. [DOI] [PubMed] [Google Scholar]
- 53.Zuloaga J, Prodan E, Nordlander P. Quantum Description of the Plasmon Resonances of a Nanoparticle Dimer. Nano Letters. 2009;9:887–891. doi: 10.1021/nl803811g. [DOI] [PubMed] [Google Scholar]
- 54.Kazemi-Zanjani N, Vedraine S, Lagugné-Labarthet F. Localized Enhancement of Electric Field in Tip-Enhanced Raman Spectroscopy Using Radially and Linearly Polarized Light. Opt Express. 2013;21:25271–25276. doi: 10.1364/OE.21.025271. [DOI] [PubMed] [Google Scholar]
- 55.Huschka R, Zuloaga J, Knight MW, Brown LV, Nordlander P, Halas NJ. Light-Induced Release of DNA from Gold Nanoparticles: Nanoshells and Nanorods. J Am Chem Soc. 2011;133:12247–12255. doi: 10.1021/ja204578e. [DOI] [PMC free article] [PubMed] [Google Scholar]
- 56.Plech A, Cerna R, Kotaidis V, Hudert F, Bartels A, Dekorsy T. A Surface Phase Transition of Supported Gold Nanoparticles. Nano Letters. 2007;7:1026–1031. doi: 10.1021/nl070187t. [DOI] [PubMed] [Google Scholar]
Associated Data
This section collects any data citations, data availability statements, or supplementary materials included in this article.


