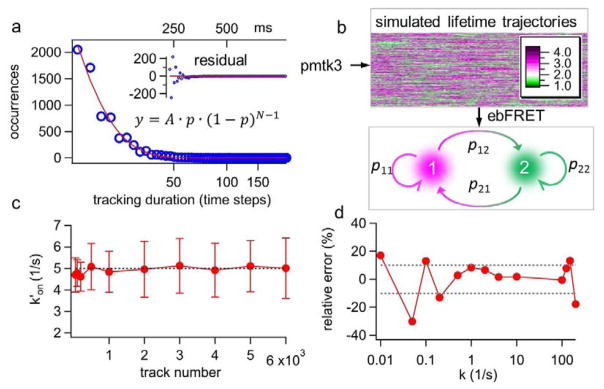
Figure 3.
(a) The experimental track durations are found to follow a geometric distribution (y) with p = 0.13, where p is the probability of losing track of the molecule in each time step; N is the number of time steps before the molecule is lost; and A is the proportional constant. (b) Based on the experimentally derived p value and the preset annealing-melting rates, we generate thousands of simulated lifetime traces of various durations using the MATLAB toolkit pmtk3. The lifetime traces are then processed by ebFRET to obtain the transition matrix, and hence to calculate k′on and koff (Supplemental Note S6). (c) Apparent annealing rate k′on converges rapidly to the preset value (5 s−1) when the number of lifetime traces used for ebFRET analysis is growing. The error bars are calculated from the standard deviations of the transition matrix, which are also the output parameters from ebFRET. (d) 2,000 simulated lifetime traces produced over a wide range of rates (here k′on= koff = k) are processed by ebFRET. The relative error of estimated k over the broad range of preset k values (0.01–100 s−1) is shown.

